3.1 Appearance of FFS and films
Supplemental Fig. 1 demonstrates the appearance of the different FFS. The poloxamer FFS was observed to be a transparent and uniform gel-like solution, whereas the carbomer FFS was an off-white gel-like solution. For 0.5 g film forming solution applied on the forearm skin, the formed thin and invisible film dried within 3 min.
3.2 Scanning electron microscopy
Some formulations couldn’t get integrated films in drying process. Like FMC1 and FMC2, the separated two-phase structure generated cracks on the film surface, and the FC1 films exhibited cracks and did not form an integrated structure (Supplemental Fig. 2). This phenomenon could be interpreted as the carbomer-HPC FFS had a poor miscibility with the lipophilic plasticizer.
As shown in Fig. 1, the surface of the original HPC-ACOA blend film demonstrated a few cracks, which indicated that the original blend film was not ideal as a drug carrier. Similarly, FC2 and FP2 also displayed cracks and a certain extent of breakage, while FP1 presented a smooth morphology with uniform texture. It revealed that a small amount of plasticizer was necessary to achieve the uniform surface morphology.
When the MCT was gradually added to poloxamer FFS, The the SEM images of FMP1 and FMP2 revealed the soft MCT inclusions surrounded by the rigid polymer framework. The inclusions also led to the formation of inter-connected holes. Such drug-carrying films may be beneficial for buccal mucosa and oral delivery. As the saliva and gastric juice enter the holes, it can promote the polymer framework swelling and drug dissolution. It is feasible to control the rate of drug release by controlling the number of holes, which has a positive correlation with the plasticizer content.
3.3 Rheological properties
3.3.1 Steady shear measurement
As shown in Fig. 2a and 2b, viscosity decreased rapidly on increasing the shear rate. The high shear rates simulates the activity of applying samples on the skin. Based on the power law fitting, the parameters n and K are presented in Supplemental Table 1. All film forming solutions exhibited a high correlation coefficient (R2 >0.98). The film forming solutions with n < 1 revealed a shear thinning behavior representing the non-Newtonian pseudo-plastic fluids. It represents an ideal property of topical semisolid systems, as the low viscosity system is more conducive to achieve the uniform paint and subsequent application.
3.3.2 Dynamic viscoelasticity measurement
The storage (G') and loss (G'') moduli of the sample are presented in Fig. 3a and 3b. As the stress was increased, the storage and loss moduli curves ran nearly parallel to each other. This was followed by a rapid decline in G', generating a crossover point with G''. The crossover point indicated the irreversible damage in the internal structure of FFS. The parallel range is also termed as the linear viscoelastic range (LVR).
In practice, G' values in LVR represent the stiffness of the sample or gel strength. The poloxamer FFS exhibited a reduction in the G' values after the incorporation of MCT in the formulations (Fig. 3a). FMP1 and FMP2 demonstrated lower G' values as compared to FP1 and FP2 (Supplemental Table 1). Another lipophilic plasticizer TBC was also evaluated in this work. As shown in Fig. 3a, an increment in the amount of the lipophilic plasticizer (both MCT and TBC) was inversely proportional to the stiffness and strength of FFS (P<0.05).
However, the inverse relation was not evident in the carbomer FFS. As observed in Fig. 3b and Supplemental Table 1, the G' values and lipophilic plasticizer did not exhibit any significant relation. Except for FC1 demonstrating the highest G' values (P<0.05), other changes in the carbomer formulation did not significantly impact the G' values (P>0.05).
The yield stress values (Supplemental Table 1) of the samples between 10 and 100 Pa indicated that a minimal force could initiate the flow (1-10 mN force over 1 cm2 area), which confirmed the easy application of the developed formulations on the skin [20].
3.3.3 Oscillation frequency sweep
Oscillation frequency sweep was used to determine the system response to the impact or gradual loading forces. Fig. 4a and 4b demonstrate the changes in G' and G'' as a function of frequency. G'' was higher than G' at low frequency values, which indicating the viscous characteristic of the system. At high frequency values, G' was higher than G'', revealing the elastic characteristic.
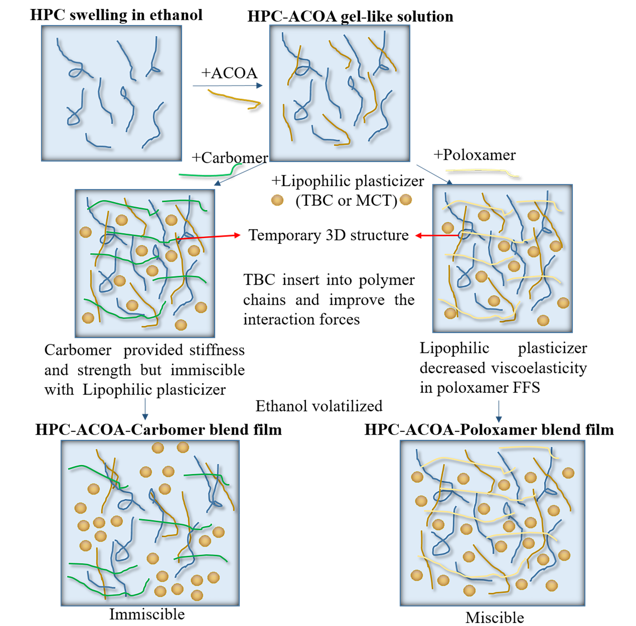
A large number of literature studies [17, 21, 22] have explained the observed changes: at low frequency values, the polymer molecular chains have sufficient time to relax and disentangle, thus, rendering the viscous fluid characteristic. However, on enhancing the frequency (the high frequency acting more like a strike on the system), the short periodic oscillation does not provide sufficient time to the entangled molecular chains to relax. These entanglements, thus, play the role of the three-dimensional (3D) network of the temporary junction. Although the entanglement of the polymer chains can be regarded as the temporary 3D structure at high frequency, G' and G'' show frequency dependency, suggesting that HPC in FFS is present as a polymer solution rather than a network structure [17, 23].
Classified curves by MCT, then respectively compared the samples with or without TBC. Both G' and G'' were observed to increase for the system with TBC, and the crossover point moved towards the low frequency values, representing a strong entanglement and hydrogen bonding among the molecules. This confirmed that the short chain plasticizer TBC was more likely to be inserted in the incompletely swollen polymer chains, so that exposed carboxyl groups on the stretched chains to form a large number of strong intermolecular hydrogen bonds
3.4 Differential scanning calorimetry
As shown in Fig. 5a, the TH drug powder demonstrated two characteristic endothermic peaks in the DSC pattern: one of the peaks was attributed to TH, while the other peak was related to its homeopathic isomers. However, these characteristic heat-absorption peaks were observed to disappear in the physical mixture. The observed phenomenon is due to the reason that a drug was physically mixed with an amorphous polymer it can dissolved in, the amorphous polymer initially absorbs the heat to form a glassy structure. On further heating to the drug melting temperature, the drug dissolves in the glassy polymer, resulting in the reduced melting enthalpy. This phenomenon can be used to determine the drug solubility in polymers [6]. The disappearance of peaks was also observed in the films indicating the crystal transformation in FFS. Overall, the crystal transformation to the amorphous structure is conducive for the drug entry in SC.
3.5 X-ray diffraction
XRD analysis was performed to verify the crystal structure of TH in the physical mixture. As shown in Fig. 5b, the pure TH powder and physical mixture exhibited sharp diffraction peaks, especially at 2θ = 5.98°. This indicated that the crystal structure still existed in the mixture at room temperature. The characteristic peaks were observed to disappear or broaden in the films. It suggested that the transformation of the Terbinafine crystal occurred in the films due to the hydrogen bonding interactions, which was consistent with the findings from DSC. Combining the DSC and XRD results also revealed that HPC maintained TH in the amorphous form during the solvent volatilization. HPC act as an ideal crystallization inhibitor.
3.6 In-Vitro release test
As shown in Fig. 6, the formulations exhibited a significantly higher extent of release than the commercial product(P<0.05), indicating the formation of a higher drug reservoir formed in SC. The high lipophilicity of TH makes it difficult to pass through the hydrophilic dermis in the absence of a penetration enhancer, thus, a high concentration of the drug reservoir does not enhance the risk of the side effects. Two features can be clearly noted from Fig. 6. Firstly, TBC occupied a content of 10.9%~16% in the dried films, however, it did not significantly influence the released amount (P>0.05). Secondly, a high amount of MCT (3 times higher than TBC) added in the carbomer-films (FMC1 and FMC2) significantly enhanced the drug release rate than FC1 and FC2 (P<0.05), which was consistent with the plasticizer effect mentioned earlier. In contrast, poloxamer improved the initial release and release rate, however, the presence of MCT in the poloxamer-film reduced the extent of release. A probable reason is that the solubility of Terbinafine may be enhanced due to the combination of MCT and poloxamer. This corresponds to a decrease in the drug saturation and thermodynamic activity, thus, reducing the drug delivery. The release curves were fitted with the first-order, zero-order and Higuchi functions respectively. As per Supplemental Table 2, the formulations mainly followed the first-order release behavior.
3.7 Thermo-analysis of release behavior
It is important to analyze the observed decrease in the drug release on adding MCT in the poloxamer FFS. In order to explore if the observed decrease in the drug release was related to the improvement in the drug solubility, the TH+HPC+P physical mixtures were prepared using different mixing ratios. DSC analysis was performed to ascertain the solubility of TH in HPC. The solubility was re-measured after adding MCT. The principle is that the drug dissolves in the glassy polymer during melting, a reduction in the melting enthalpy can be observed. This reduction should linearly related to the drug fraction. In case the weight fraction of the drug exceeds the maximum solubility level within the polymer, a fraction of the drug is no longer dissolved in the polymer, and the linear relationship with the melting enthalpy may change.
As shown in Fig. 7a, the glass transition temperature of HPC was ~55 ℃, and the glass transition curve was noted to flatten after adding MCT (Fig. 7b). This could be attributed to the molecular interactions in the HPC-poloxamer-MCT system.
As shown in Fig. 7a and 7b, compared to the TH+HPC+P mixture, the reduction in the TH melting peak was deeper in the mixture with MCT. Especially for the 40:60 mixtures, the TH+HPC+P+MCT mixture exhibited a small TH melting peak, while the melting peak was obvious in the TH+HPC+P system. This indicated that TH had a superior solubility in the HPC+P+MCT mixture.
Fig. 8 present the melting enthalpy variation observed in each mixture. For the TH+HPC+P mixture (Fig. 8), the changes of melting enthalpy could be divided into two linear stages of drug loading. The first stage occurred for the drug loading between 40 to 70%, while the second was noted from 70 to 90%. The solubility obtained by the linear regression analysis was 71.81% w/w. Similarly, the TH solubility in the HPC+P+MCT mixture was 80.90% w/w.
These findings qualitatively and quantitatively verified that the addition of poloxamer and MCT to HPC resulted in an enhanced TH solubility. These also explained the reduction in the drug release on incorporating MCT to the poloxamer FFS: the enhanced solubility led to a reduction in the super-saturation driving force.
