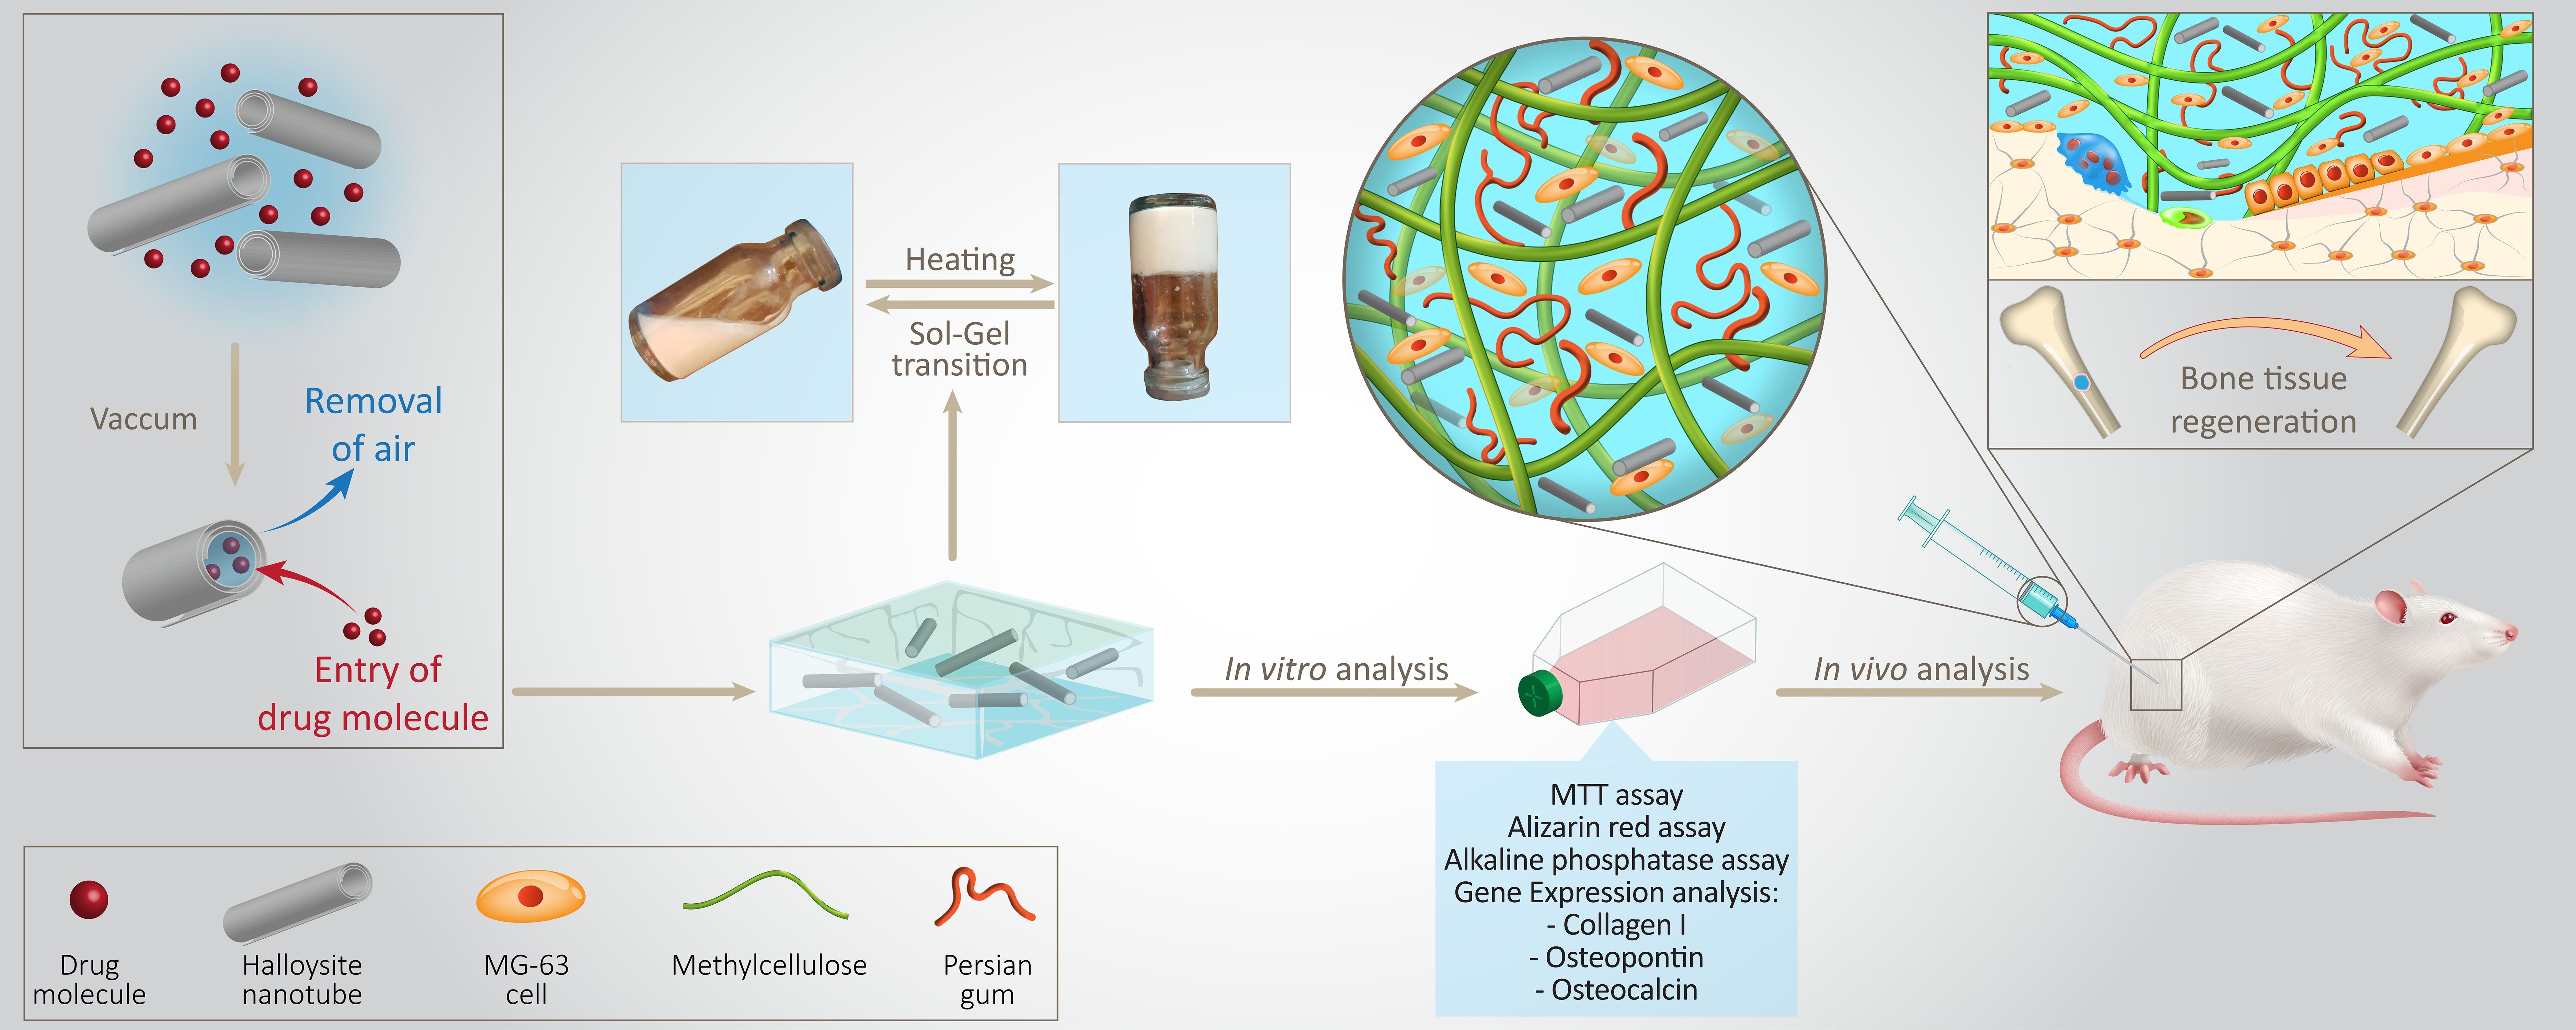
In-situ forming hydrogels have gained noticeable attention to encapsulate osteogenic agents and regenerate irregular-shape bone defects. In this study, a novel thermosensitive hydrogel based on blended methylcellulose (MC) with Persian gum (PG) was fabricated and enriched with taxifolin (TAX) loaded halloysite nanotubes (HNTs) to enhance mechanical and biological characteristics of the hydrogel in bone tissue engineering. The injectability, mechanical and rheological tests were performed for different hydrogel formulations containing 0.25-1.5 w/v% PG and 1-7 w/v% HNTs. Also, to evaluate the impact of PG and HNTs on hydrogel behavior, the degradation rate and swelling degree of hydrogels were assessed. The optimized MC/PG/HNTs hydrogel containing 1% PG and 3% HNTs (MC/PG-1/HNTs 3%) was easily injectable and gelled rapidly at physiological temperature, while it had the highest mechanical strength due to the existence of PG and HNTs. In vitro release study of TAX from this system also revealed more sustained release compared to HNTs-TAX nanoparticles. Furthermore, the interaction of cells with hydrogel and osteo-conductivity was studied using osteoblast-like cells (MG-63). Results showed higher cell adhesion, proliferation, and gene expression for MC/PG-1/HNTs-TAX hydrogel compared to MC/PG-1 and MC/PG-1/HNTs 3% possibly due to the synergic effect of HNTs and TAX. In addition, Alizarin Red S staining and alkaline phosphatase measurements indicated that the existence of HNTs-TAX promoted osteogenic differentiation. Eventually, animal studies on the femoral defects indicated improved remedy when using the MC/PG-1/HNTs-TAX hydrogel carrying MG-63 cells.
Research Article
Thermo-Responsive Hydrogels Based on Methylcellulose/Persian Gum Loaded With Taxifolin Enhance Bone Regeneration: An in Vitro / in Vivo Study
https://doi.org/10.21203/rs.3.rs-736612/v1
This work is licensed under a CC BY 4.0 License
Journal Publication
published 24 Jan, 2022
You are reading this latest preprint version
Methylcellulose
Persian gum
Halloysite
Taxifolin
Injectable hydrogel
Bone tissue engineering
Bone tissue is continuously maintaining its normal physiological structure and mineral content with a balance between the resorption by osteoclasts and bone formation by osteoblasts (Welch and Hardcastle 2014). Bone-related diseases such as osteoporosis, which can cause bone defects or fractures, are on the rise and are costly (Agarwal and García 2015). Bone has a significant ability to regenerate and heal itself. However, external intervention is often required for the complete recovery of large bone defects and complex fractures (Walmsley et al. 2016). The field of bone tissue engineering offers alternative treatment options that enhance bone regeneration while decreasing the disadvantages of traditional surgical treatments (i.e., bone grafts and metal prostheses) such as pain, infection, and high costs. In-situ forming hydrogels are paid more attention by biomaterial researchers for bone tissue engineering thanks to their suitable characteristics like; biocompatibility, biodegradability and flexibility to fill irregular-sized defects with minimal invasive injury. Besides, their similar structure to the extracellular matrix (ECM) provides a favorable microenvironment for cell adhesion and proliferation (Amini et al. 2012; Wasupalli and Verma 2020; Deng et al. 2020). The thermosensitive injectable hydrogels are polymeric cross-linked networks that can encapsulate cells or drug nanoparticles in the sol phase but when injected into the body they transform into a semisolid hydrogel phase with desired shape (Kondiah et al. 2016; Morsi et al. 2019).
Polysaccharides like methylcellulose (MC) are extensively used in fabricating thermosensitive hydrogel systems due to their biodegradability, a property not found in most synthetic polymers. MC is a water-soluble derivative of cellulose that results in a reversible thermosensitive hydrogel (Tang et al. 2010). Different variables including; molecular weight, methylation degree and addition of salts may change its sol-gel transition temperature. The gelling temperature of a pure MC solution is approximately 60°C, which is not suitable for use in vivo (Kim et al. 2018). Hydrophobic properties of MC in water may be affected by adding various salts like tri-sodium citrate (TSC), which consequently reduce their strength and the gelation temperature to below 37°C (Dalwadi and Patel 2018). MC is a suitable biomaterial for tissue engineering due to its biocompatible properties, cell protection from physical stress and stimulation effect on cells (Rangabhatla et al. 2016). However, pure MC hydrogel is similar to soft tissues in terms of strength and needs to be improved for application in bone tissue engineering (Deng et al. 2020). Polymer blending is an effective method to improve the physical properties of polymeric materials. MC/chitosan blended hydrogel has been reported to be potential in tissue engineering (Tang et al. 2010). Also, a blend of MC and pluronic has been fabricated for sustained drug delivery used in bone tissue engineering (Rangabhatla et al. 2016). Persian Gum (PG), also known as Angum, Farsi, and Zedo gum is a novel source of polysaccharide that exudes from the mountain almond trees (Amygdalus scoparia Spach) grown mainly in the Zagros forests of Fars province in Iran (Abbasi 2019). In ancient medicine, PG has been used as a treatment for swollen joints, parasitic diseases, toothaches and coughs, and today it has gained significant attention for various food and pharmaceutical applications (Dabestani et al. 2018). Besides, its compatibility with other macromolecules (Abbasi 2019) and its beneficial effects in improving stability and rheological properties have been studied (Dabestani et al. 2018). Nevertheless, according to our knowledge, the application of PG in thermosensitive hydrogel systems for bone tissue engineering is novel and its combination with MC has not been investigated so far.
Flavonoids are a group of polyphenolic compounds derived from plants that have shown good effects on bone metabolism (Welch and Hardcastle 2014). According to the natural origin, low cost, ease of access and no side effects, evaluation of flavonoids as potentially bioactive molecules for bone therapies is of high interest (Córdoba et al. 2018). Dihydroquercetin, also called taxifolin (TAX), is a common flavonoid found in Pinaceae tree family, which has various bioactivities such as antioxidant, anti-inflammatory and antimicrobial properties (Sunil and Xu 2019). TAX can stimulate the formation and stabilization of type 1 collagen fibers in vitro (Tarahovsky et al. 2007). Furthermore, it can induce osteogenic activity and mineralization in bone marrow-derived human mesenchymal cells (hBMSCs) by inhibiting the NF-κB pathway in a dose-dependent manner (Wang et al. 2017). It is also reported that TAX can inhibit osteoclastogenesis both in vitro (Zhang et al. 2019) and in vivo (Cai et al. 2018) by regulating the RANKL signal. Hence, due to the effects of TAX on stimulating osteoblast differentiation and inhibition of osteoclastogenesis (Satué et al. 2013) considering its low solubility in water and low oral bioavailability (Shikov et al. 2009; Zu et al. 2014a; Alves et al. 2018), local delivery of TAX for bone tissue can be beneficial.
Nanoparticles have great potential as bone-specific carriers by providing a size similar to bone's ultrastructure (Alencastre et al. 2016). Halloysite nanotubes (HNTs) with the chemical formula ‘Al2Si2O5(OH)4·nH2O’ are safe, biocompatible and cheap aluminosilicate clay, which have been used as a carrier in drug delivery systems, demonstrating controlled and sustained drug release (Vergaro et al. 2010; Lvov et al. 2016). Besides, HNTs can enhance the wetting ability, mechanical properties of composite scaffolds (Roushangar Zineh et al. 2018) and improve cell adhesion (Liu et al. 2013; Naumenko et al. 2016). Because these nanotubes can increase osteogenic factors, their use in bone tissue engineering can be beneficial (Huang et al. 2019).
Herein, a novel injectable thermosensitive MC/PG based hydrogel with TAX loaded into HNTs was developed. For the first time, PG was blended with MC to improve its mechanical and rheological properties, and HNTs were also incorporated into hydrogel as a source of silica to increase osteogenesis and cell adhesion while acting as a TAX carrier. Thanks to the role of TAX in stimulating osteoblast differentiation and inhibiting osteoclastogenesis, it was added to MC/PG injectable thermosensitive hydrogel to investigate its sustained-release delivery to the bone site. The prepared hydrogels were evaluated for mechanical, rheological, morphological, degradation, water absorption, and injectability properties. TAX loading into the HNTs and its release were also investigated. Finally, osteoblast proliferation/adhesion, osteogenesis and gene expression assay in vitro, as well as experiments in rat femoral defect model, were done to determine the usefulness of developed hydrogels in bone tissue engineering.
2.1. Materials
Taxifolin (C15H12O7, purity > 96%, Mw = 304.25 g mol-1) was gifted by Beckman-Kenko GMBH Company (Bassum, Germany). Halloysite nanotubes, methylcellulose (Methocel® MC low viscosity, 300-560 mPa.s at 2% in H2O (20 °C), 27.5-32% methoxyl basis), thiazolyl blue tetrazolium bromide (MTT), dexamethasone, β-glycerophosphate, ascorbic acid-2-phosphate, ethanol, glutaraldehyde, formaldehyde and hydrochloric acid were purchased from Sigma-Aldrich (USA). Trisodium citrate (TSC) and dimethyl sulfoxide (DMSO) were from Merck Chemical Co (Germany) and dialysis bags (Mol. Wt. cut-off ~ 12–14 kDa) were from Betagen Co (Mashhad, Iran). Persian gum (PG, an anionic plant polysaccharide) was bought in crystalline form with different colors from white to reddish brown from Reyhan Gum Persian Co (Iran). Then, to generate a homogenous powder, it was milled and sieved through mesh No. 60. Human osteoblast-like cell line (MG-63) was provided by the National Cell Bank (Pasteur Institute, Iran). Dulbecco's Modified Eagle Medium- Low Glucose (DMEM-LG), fetal bovine serum (FBS), streptomycin/penicillin and phosphate buffer saline (PBS) were provided by Bioidea (Iran). The alkaline phosphatase kit was from Pars Azmoon Company (Iran) and the highly pure RNA isolation kit was from Roche Company (Germany). AddScript cDNA Synthesis Kit was purchased from Addbio (Korea) and Syber Green PCR Master Mix (RealQ plus 2×) was purchased from Amplicon (Denmark). Primer genes (COL1A1, BGLAP and SPP1) were provided by Cinaclon (Iran). Ketamine and acepromazine were from the Alfasan Company (Netherlands). Moreover, deionized water (DIW) was utilized throughout the study.
2.2. Specifications of PG
In terms of solubility, PG consists of two parts: one is totally soluble (30%) while another one (70%) is insoluble, which forms a gel network (Dabestani et al. 2018). Its main elements are K+, Na+, Mg2+, Zn2+, Fe2+ and Ca2+ (Abbasi 2017). The datasheet analysis of PG by the providing company indicated the following composition for the used PG; carbohydrate: 91.3%, protein: 1.2%, fat: 0.2%, total ash: 2.16%. PG is constructed of galactose (1→3 linked β-D-Glap) and rhamnose units in the backbone and (1→6) linked β-D-Glap), (1→3) linked α-L-Araf residues in side chains (Dabestani et al. 2018; Molaei and Jahanbin 2018; Ghasemzadeh and Modiri 2020). According to GC/MS results, the main monosaccharides of PG are included arabinose and galactose in a 2:1 ratio and small quantities of other monosaccharides such as rhamnose, mannose and xylose (Fadavi et al. 2014). The existence of various functional groups in the structure of PG such as -CH2, -CH3, -COO-, C-O, C-H, hydroxyl, carbonyl, carboxyl and amide groups, seen in FTIR spectra (Dabestani et al. 2018), allows it to be easily crosslinked with other carbohydrate polymers like gelatin and gum tragacanth (Khodaei et al. 2020). According to the manufacturer, the used PG also has the following features: molecular weight of 4.6×10⁶, surface tension of about 55 mN/m, specific rotation of -6.8, pH of 4.4, and viscosity of 48 mPa.s for 1% solution.
2.3. Preparation of TAX loaded HNTs (HNTs-TAX)
To encapsulate TAX inside HNTs, TAX (8 mg) was dissolved completely in ethanol (10 ml) using a magnetic stirrer. Then varying quantities of HNTs were mixed into the aforementioned solution to obtain the mass ratio of 1:10, 1:5, 1:2, 1:1, 2:1 and 5:1 of TAX: HNTs. This slurry was then sonicated for 10 minutes before being placed in a vacuum jar. The 30-minute cycles of vacuum and atmospheric pressure were applied on the suspension. This process was repeated for 3, 5, and 7 cycles to reach the maximum loading efficiency. Eventually, after 10 min centrifugation of the suspension at 10000 rpm, HNTs-TAX nanoparticles were separated, washed with deionized water and lyophilized for other studies. To calculate the encapsulation efficiency (EE) of TAX in nanoparticles, after loading procedure the amount of free drug in the supernatant medium was measured spectrophotometrically (UV-mini 1240, Shimadzu, Japan) at 290 nm. The EE% was calculated according to Eq. (1) (Pan et al. 2017):

Where M0 is the TAX content at the beginning and M1 is the unloaded TAX.
2.4. Characterization of HNTs –TAX
The morphology of untreated HNTs was determined through a transmission electron microscope (TEM, Philips, CM300) to examine the in-depth data.
The infrared spectra of HNTs, TAX and HNTs-TAX were recorded on a JASCO FT/IR-6300 Spectrometer using KBr pellet method (400-4000 cm-1) at the resolution of 4 cm-1.
The thermal properties of the prepared nanoparticles were obtained with a gas-tight thermal analysis system (NETZSCH, STA 449 F3 Jupiter, Germany) under a nitrogen atmosphere. For this purpose, 5 mg of samples were loaded in aluminum pans, hermetically sealed and then heated from 25 to 400 ◦C at a rate of 10 ◦C min-1.
2.5. Preparation of hydrogel samples
The MC hydrogel was prepared based on procedure previously described (Dalwadi and Patel 2018). Briefly, MC powder (1.5 w/v%) was added to heated deionized water under continuous stirring for 30 min. Then, MC solution was crosslinked by trisodium citrate solution with a final concentration of 5 w/v% accompanied by stirring in an ice water bath until a clear solution was obtained. Finally, the solution was kept at 4 °C before it was used. The MC/PG hydrogels were made in the same way, except that 0.25, 0.5, 1 or 1.5 w/v% PG was first dispersed in deionized water under stirring at room temperature to obtain a homogeneous solution. Optimum MC/PG gel was selected according to injectability, rheological and mechanical properties. Then, different amounts of HNTs (1, 3, 5, 7 w/v%) were added to the optimized MC/PG hydrogel. Before adding HNTs to a warm stirring MC/PG solution, they were sonicated in deionized water for 10 minutes. Based on rheological and mechanical properties, the best MC/PG/HNTs sample was chosen as a carrier for prepared HNTs-TAX nanoparticles.
2.6. TAX release study
The release profiles of TAX from HNTs-TAX and hydrogels were evaluated by transferring the nanoparticles dispersion or hydrogels into the dialysis bags. Then the bags were immersed in 20 ml of PBS (pH 7.4, 37°C) in falcon tubes and were placed in a shaking thermostatic incubator with a constant speed of 100 rpm. At each time interval, 500 µl of released medium was picked up and its absorbance was measured by a spectrophotometer at lmax = 326 nm. For each formulation, the sample devoid of TAX was used as the blank. The standard calibration curve of TAX in PBS was used to calculate the TAX released percent. The tests were made in triplicate for each sample and the cumulative amount of released TAX was measured (Kouhi et al. 2020).
2.7. Characterization of hydrogel samples
2.7.1. Mechanical tests
A standard testing machine (SANTAM, STM-20, Iran) operating in compression mode was used to determine the mechanical properties of the prepared hydrogels (Hejazi and Mirzadeh 2016). The hydrogel samples were frozen in a 24-well culture plate overnight and freeze-dried for 48 h in a freeze dryer (Martin Christ, Germany) at 0.001 mbar. The cylindrical samples (diameter = 15 mm and height = 10 mm) were then placed between compression platens and the crosshead rate was set at 0.5 mm/min. The compressive load was applied up to 50% of the initial height of the samples. For each scaffold, the test was repeated five times and the average of the measurements was reported as mean ± standard deviation.
2.7.2. Injectability test
The injectability of MC, MC/PG and MC/PG/HNTs samples was evaluated using a texture analyzer (Brookfield, CT3-4500, USA) according to a previous study (Kim et al. 2018). A syringe (10 ml with a diameter of 15.8 mm) was charged with the gel sample and placed between the machine crosshead and compression plate at room temperature. At a crosshead speed of 0.4 mm/s, the compression stress was applied to the syringe plunger and a maximum limit of 50 N was selected for the test since the larger forces are not practically suitable in a manual injection. For each sample, the test was repeated in triplicate and the maximum force in the plateau area was determined as a maximum injectability force.
2.7.3. Morphological analysis
The hydrogel samples were morphologically studied using SEM (Philips, XL30). The hydrogels were frozen in a 24-well culture plate overnight, and then freeze-dried (Martin Christ, Germany). Before imaging, the samples were gold-coated under a vacuum.
2.7.4. In vitro physiological stability
Pre-weighted dried hydrogels (Wd) were incubated in 20 ml of PBS (37°C, pH 7.4) until equilibrium swelling occurred to investigate the effect of PG and HTN content on swelling behavior. Samples were removed from PBS at various periods; wiped off to remove its excess water and the swollen hydrogels were weighted (Ws). The relative swelling ratio (%) was assessed according to Eq. (2) (Kumar et al. 2019):

To examine the degradation rate of hydrogels, pre-weighted samples in dried form (W0) were incubated in PBS (37°C, pH 7.4). After 1, 4, 7, 14 and 28 days of incubation, the specimens were freeze-dried and weighted (Wt) instantly. The weight loss percentage was calculated using Eq. (3) (Amiryaghoubi et al. 2020):

Each test was repeated three times and the results were reported as mean ± standard deviation.
2.7.5. Rheological properties of the hydrogels
All rheological measurements were conducted using a rheometer (Anton Paar, MCR 301, Germany) equipped with concentric cylinder geometry, CC27, using bob and cup with diameters of 26.66 and 28.92 mm, respectively. Primarily, oscillatory temperature sweep experiments were performed for MC solution and its mixtures with PG at constant 1 Hz frequency and 1% amplitude gamma in the temperature range between 25 and 40°C with a heating rate of 1°C/min. Subsequently, oscillatory amplitude and frequency sweeps were carried out at 25 °C to determine the structural characterization of hydrogels containing HNTs. The amplitude sweep tests were applied from the strain 0.1 to 100% with an angular frequency of 10 rad/s to define the linear viscoelastic (LVE) region. In accordance, frequency sweeps were performed at a strain value of 1% over an angular frequency range of 100 to 0.1 Hz.
2.8. Cell culture studies
The MG-63 osteoblast-like cells were cultured in Dulbecco's Modified Eagle Medium- Low Glucose (DMEM-LG) with 10 v/v% fetal bovine serum (FBS) and 1 v/v% streptomycin/penicillin in an incubator containing 5% CO2. Every three days the culture medium was replaced. To evaluate cell-sample interaction, before cell seeding the hydrogel samples were washed with phosphate buffer saline at 37°C and sterilized for 2 h under UV light. Then, hydrogels (100 µl) were poured into a 24-well culture plate in a disk shape and were allowed to form a physical gel at 37°C incubator. Consequently, cell suspension (300 µl, 1.5×10⁴ cells) was carefully seeded on each hydrogel and tissue culture plate (TCP) as control and incubated for 1 h to enhance cellular penetration and adhesion. Then extra culture medium was added to each well up to the final volume of 1 ml and continued incubating for predetermined time.
2.8.1. Cell proliferation
Proliferation of MG-63 cells cultured onto the samples was examined using MTT mitochondrial reduction assay. At the specific times (1, 4 and 7 days of cell culturing), the medium was thrown away and the cell-seeded samples and control were incubated with 500 µl of DMEM-LG and 50 µl of MTT solution (5 mg/ml) for 4 h. After discarding the medium carefully, the dark blue formazan crystals were dissolved in 300 µl DMSO and were kept for 1 h at 37°C. Lastly, a certain volume of each well (100 µl) was transferred to a 96-well plate and its optical density (OD) was read at 490 nm using a microplate reader (Biotek Instruments, China). The relative cell survival (%) was calculated according to the Eq. (4) (Mokhtari et al. 2019):

Where Xsample, Xb and Xc were absorbance of the sample, DMSO (blank) and TCP (control), respectively.
2.8.2. Cell attachment
The morphology of MG-63 cells adhering onto the MC/PG/HNTs-TAX hydrogel was characterized utilizing SEM. After 7 days of cell culture in osteogenic medium (DMEM-LG medium containing; 10 v/v% FBS, 1 v/v% antibiotic solution, 100 nM dexamethasone, 10 mM β-glycerophosphate and 0.2 mM ascorbic acid-2-phosphate), the medium was removed and the samples were washed with PBS and fixed in 4.5% glutaraldehyde for 3 h. After rinsing with PBS, the cell-seeded hydrogel was dehydrated with a graded ethanol series, dried overnight and prepared for SEM imaging (Tian et al. 2008).
2.8.3. Alkaline phosphatase (ALP) assay
In order to measure the activity of ALP as a marker of bone mineralization, the conversion of para nitrophenyl phosphate to para nitrophenol was evaluated as previously reported (Farokhi et al. 2012). 1×10⁴ MG-63 cells were seeded on each sterilized hydrogel placed in 12-well plates and cultured in osteogenic medium for up to 14 days. After 7 and 14 days, the medium was discarded and by following the ALP kit manufacturer's instructions (Pars Azmoon kit, Iran), ALP activity was measured using spectrophotometry at a wavelength of 405 nm.
2.8.4. Alizarin Red S (ARS) staining
The ability of MG-63 osteoblast-like cells to form mineralized nodules in the presence of hydrogels was determined by the ARS method based on a previous research study (Sedghi et al. 2020). Briefly, in a 12-well plate the cells were seeded on each samples at a density of 1×10⁴ cells/well. After 14 days the osteogenic medium was aspirated, the cells were rinsed for three times with PBS (37°C, pH 7.4) and then were fixed in formaldehyde (3.6 v/v%) at 37 °C for 15 min. The fixed cells were stained by 2% Alizarin Red S with the pH of 4.1-4.3 for 15 min in an incubator. After washing the cell layer with deionized, calcium deposition was visualized by a microscope (Olympus, Tokyo, Japan) and images were recorded with a digital camera (Sony, DSC-H9, Japan).
2.8.5. Osteogenic gene expression using real-time polymerase chain reaction (RT-PCR)
Briefly, after 14 days of cell culturing, total RNA was extracted by a High Pure RNA Isolation Kit based on the manufacturer's protocol (Roche, Germany). The quality of total RNA extracted from each sample was determined by a nano-spectrophotometer (WPA, England). Complementary DNA (cDNA) of each sample was prepared using AddScript cDNA Synthesis Kit (Addbio, Korea) according to the manufacturer's instructions with oligo dT primers. Quantitative RT-PCR was carried out using Syber Green PCR Master Mix (RealQ plus 2×, Amplicon, Denmark) and the StepOne™ Real-time PCR Detection System (Applied Biosystems, Life technology, California, US). The primer sequences are shown in Table 1. The comparative Ct (ΔΔCt) was used to compute the relative gene expression.
|
Table 1 Sequences of the specific primers used for RT-PCR analyses of various gene expressions in osteoblasts |
||
|
Reverse primer |
Forward primer |
Gene |
|
5'-CAGATCACGTCATCGCACAAC-3' |
5'-GAGGGCCAAGACGAAGACATC-3' |
Collagen 1 |
|
5'-CCCTCCTGCTTGGACACAAAG-3' |
5'-CACTCCTCGCCCTATTGGC-3' |
Osteocalcin |
|
5'-TGAGGTGATGTCCTCGTCTG-3' |
5'-GCCGAGGTGATAGTGTGGTT-3' |
Osteopontin |
|
5'-GCACAGAGCCTCGCCTT-3' |
5'-GTTGTCGACGACGAGCG-3' |
Beta-actin |
2.9. Animal study
The animal study was performed under the guidelines of the Ethics Committee of Isfahan University of Medical Sciences (Ethical code, IR.MUI.RESEARCH.REC.1398.590). Healthy male Wistar rats (~250 g) were obtained from Animal House, School of Pharmacy, Isfahan University of Medical Science, Iran for the femoral bone defect model in vivo. Animals were housed in cages under 12 h light/dark cycles with provided water and food. The animals were divided into four groups each containing 6 rats: 1) healthy group (without defect), 2) untreated group as control (with defect), 3) the group treated with MC/PG/HNTs hydrogel containing MG-63 cells (with defect), and 4) the group with MC/PG/HNTs-TAX hydrogel containing MG-63 cells (with defect). Under sterile conditions, after the rats were anesthetized by intraperitoneal injection of ketamine (75 mg/kg) and acepromazine (2.5 mg/kg), an 8-10 mm incision was made in the cranial femur, proximal part, and then the Tensor Fascia lata was cut with scissors, opening the muscles along their natural length to reach the left femur. Then, a hole with a 5 mm diameter was drilled under constant irrigation with saline solution to prevent overheating and it was filled with a hydrogel containing MG-63 cells at the density of 1×10⁶ cell/sample based on experimental design. The rats were sacrificed 6 weeks after implantation and the defects were analyzed through radiography. All femurs were fixed in 10% formalin for 48 h and decalcified in 10% HCl for 12 h. The specimens were embedded in paraffin and sectioned at 7 µm thickness. At least four samples per group were stained with hematoxylin and eosin (H&E) and Masson’s trichrome (MT) and randomly chose for histological observation under a microscope (Olympus, Tokyo, Japan).
2.10. Statistical analysis
All data expressed as mean ± standard deviation were statistically analyzed using one-way ANOVA analysis followed by the Turkey's post-hoc test using GraphPad Prism Software (V.8) and p-value < 0.05 was considered as statistically significant.
3.1. TAX loading
The untreated HNTs were loaded with TAX in different weight ratios by using vacuum (Vergaro et al. 2012; Pan et al. 2017). The effects of vacuum cycles and ratio of nanoparticles to drug on efficiency of loading are shown in Table 2. According to the results, by increasing the number of cycles (from 3 to 5) and TAX to HNTs ratio (from 1:1 to 1:5 and 1:1 to 5:1) EE% increased dramatically (p<0.05). The mechanism of loading is based on entrapment of drug molecules in tubes through vacuum cycling, which leads to replacing the air inside the tubes by the drug solution. Hence, increasing HNTs or TAX ratio and repeating cycles can provide a higher capacity for drug loading (Pan et al. 2017). However, when the drug loading was continued for 7 cycles of vacuuming; and also when the ratio of TAX: HNTs was increased from 1:5 to 1:10 no significant difference was seen. Thus, the mass ratio of 1:5 for TAX to HNTs and 5 loading cycles were selected for fabricating the composite hydrogels, which caused an acceptable EE % (48.76 ± 4.40) to acquire.
Table 2 Effect of TAX:HNTs ratio and number of vacuum cycles on drug entrapment efficiency
|
TAX:HNTs |
Drug entrapment efficiency (%) |
||
|
3 cycles |
5 cycles |
7 cycles |
|
|
1:10 |
24.64 ± 1.48 |
42.74 ± 5.66 |
41.82 ± 6.43 |
|
1:5 |
23.83 ± 1.50 |
48.76 ± 4.40 |
45.31 ± 4.60 |
|
1:2 |
16.47 ± 1.14 |
32.25 ± 2.73 |
32.17 ± 3.32 |
|
1:1 |
10.32 ± 0.77 |
23.96 ± 5.63 |
22.23 ± 2.46 |
|
2:1 |
13.43 ± 0.86 |
31.05 ± 2.99 |
29.23 ± 3.27 |
|
5:1 |
15.88 ± 1.80 |
36.69 ± 3.47 |
31.91 ± 3.20 |
3.2. HNTs–TAX characterization analysis
The morphology of HNTs was evaluated through TEM (Fig. 1a). TEM results confirmed that HNTs had an open-ended rod-like structure and double-layered. According to the measurements for 50 nanotubes in several TEM images, HNTs were approximately 500-1000 nm long and their external and lumen diameter were 25-60 nm and 6-15 nm, respectively which are in accordance with other reports (Kurczewska et al. 2017).
The molecular structures of TAX, HNTs and HNTs-TAX were studied by FTIR spectroscopy (Fig. 1b). The FTIR spectrum of TAX consisted of several adsorption peaks at 3435 cm-1, 1617 cm-1, 1472 cm-1 and 1267 cm-1 due to free OH stretching vibration, C=O stretching in flavones, C=C stretching in the aromatic ring and C-O-C stretching in =C-O-C- groups, respectively. Moreover, bands at 1359 cm-1 (between O-H bending and C-O stretching in the phenolic compound) and at 1165 cm-1 (a usual band in 5, 7-dihydroxysubstituted flavonoids) were observed (Zu et al. 2012; Hasibi et al. 2020). The spectrum of HNTs revealed two characteristic bands at 3696 cm-1 and 3624 cm-1 related to the O-H stretching vibration of inner surface Al-OH groups, and a band at 911 cm-1 is due to the deformation vibration of this hydroxyl group. Various adsorption peaks at 1033 cm-1, 794 cm-1, 753 cm-1 and 689 cm-1 are attributed to Si-O stretching. The weak band at 1651 cm-1 is assigned to O-H deformation of the inner surface of absorbed water. Also, bands at 535 cm-1, 463 cm-1 and 432 cm-1 corresponded to Al-O-Si bending vibration, Si-O-Si bending vibration and Si-O deformation, respectively (Li et al. 2013; Lun et al. 2014). The presence of TAX after loading into the HNTs was confirmed by peaks at 1459 cm-1 and 1640 cm-1 due to aromatic adsorption and no interaction between HNTs and TAX was observed.
Differential scanning calorimetry (DSC) and thermal gravimetric analysis (TG) of raw taxifolin, HNTs and taxifolin loaded HNTs (HNTs-TAX) are presented in Fig. 1c and d, respectively. According to DSC findings, raw TAX had an obvious endothermic peak at 233 °C, which is characteristic of the melting of crystalline TAX (Shikov et al. 2009; Zu et al. 2014b). Also, an exothermic peak was seen at 139 °C due to recrystallization of the amorphous parts (Terekhov et al. 2020). HNTs sample represented no specific peak over 400 °C and just evaporation of adsorbed water caused a weak endothermic valley at 71.47 °C (Lun et al. 2014). DSC curve for HNTs-TAX did not show peaks at the TAX melting temperature, which can be due to conversion of TAX to an amorphous structure upon loading in HNTs. TG analysis showed TAX started to weightlessness from 243 °C, while HNTs and HNTs-TAX had a very low decomposition. HNTs had a considerably more stable structure with a significant weight loss at 280 °C attributed to the interlayer water removal and dehydroxylation process at 415 °C (Pietraszek et al. 2019). The weight loss due to the presence of TAX is not visible in the TGA curve of HNTs-TAX, which could be attributed to the low loading efficiency of TAX (Moeinpour et al. 2019) and the drug confinement inside the halloysite lumen (Pietraszek et al. 2019), resulting in a thermodynamically stable amorphous structure of TAX after loading process (Bavnhøj et al. 2019).
3.3. Preparation of MC-based hydrogels
According to our preliminary studies and based on the previous literature (Dalwadi and Patel 2018) MC and trisodium citrate concentrations were used at 1.5% and 5 w/v%, respectively. To investigate the hydrogel properties different concentrations of PG and HNTs were used according to Table 3. Gels were prepared by a heating and cooling cycle to let the MC chains swell and stretch properly. MC is a reversible thermosensitive hydrogel, which can be attributed to the water cage theory (Deng et al. 2020). Water molecules form a cage-like structure to surround methoxyl group and solubilize MC by forming hydrogen bonds along the MC chains. The addition of anion-containing salts can break hydrogen bonds that form the cage due to the salting-out effect. Thus, when the hydrophobic chains are exposed the MC gel is formed. Based on the Hofmeister anion series the ions like citrate can lower the gelation time and temperature of MC but those like nitrate ions act opposite (Kim et al. 2018). Thus, addition of trisodium citrate leads to higher intramolecular crosslinking between MC chains resulting in gelation. PG was blended with MC hydrogel in different concentrations. These natural polymers were compatible as it was previously reported about MC combination with other polysaccharides such as xanthan gum (Liu and Yao 2015). Incorporation of HNTs caused opaque milk-white color samples while all MC and MC/PG hydrogels were transparent (Huang et al. 2019). Also, HNTs could be dispersed uniformly in MC/PG hydrogel due to their hydrophilicity. All formulated hydrogel samples retained their reversible temperature-sensitive properties like MC hydrogel.
Table 3 Injectability and Young's modulus properties of the studied hydrogels
|
Young's modulus (kPa) |
Injectability (N) |
HNTs (w/v%) |
PG (w/v%) |
Hydrogels |
|
84.75 ± 2.57 |
16.56 ± 1.29 |
0 |
0 |
MC |
|
143.63 ± 3.62 |
19.67 ± 1.96 |
0 |
0.25 |
MC/PG-0.25 |
|
166.80 ± 1.58 |
21.87 ± 1.24 |
0 |
0.5 |
MC/PG-0.5 |
|
233.34 ± 3.81 |
24.61 ± 0.66 |
0 |
1 |
MC/PG-1 |
|
334.61 ± 3.70 |
41.88 ± 2.68 |
0 |
1.5 |
MC/PG-1.5 |
|
426.73 ± 4.34 |
23.47 ± 1.06 |
1 |
1 |
MC/PG-1/HNTs 1% |
|
449.60 ± 5.62 |
27.02 ± 1.20 |
3 |
1 |
MC/PG-1/HNTs 3% |
|
516.07 ± 4.08 |
31.13 ± 1.64 |
5 |
1 |
MC/PG-1/HNTs 5% |
|
478.85 ± 5.80 |
33.77 ± 1.41 |
7 |
1 |
MC/PG-1/HNTs 7% |
3.4. Injectability evaluation
Injectable hydrogels are often more favorable as a drug/cell delivery system for bone tissue engineering, which can regenerate irregularly shaped defects as well as prevent surgery. The injectability of hydrogels was evaluated using the compression test, which measures the maximum force (FMAX) necessary to evacuate the sample to the injection site. The injectability results for designed hydrogels are shown in Table 3. All MC and MC/PG samples except MC/PG-1.5 had the FMAX value below 30 N, which is the upper limit of acceptable injection force as defined in a previous study (Kim et al. 2018). The addition of PG to MC hydrogel increased viscosity so that the FMAX, which was approximately 16.56 N for MC, reached 24.61 N for MC/PG-1 sample. Incorporation of 3 w/v% HNTs into the MC/PG-1 hydrogel led to the increase of FMAX to 27.02 N, while addition of 5 and 7 w/v% HNTs showed FMAX > 30 N, which was practically unacceptable for injection.
3.5. Mechanical properties of the hydrogels
The mechanical behavior of hydrogels is an important feature for bone tissue engineering. A hydrogel should be so stable from the mechanical point of view to be able to keep the tissues from pressure (Kouhi et al. 2020). Young's modulus of the designed hydrogels are summarized in Table 3. Mechanical characteristic of the MC hydrogel was improved by blending with PG. Similar results were also reported in another study (Abbasi et al. 2011) in which PG was used to increase mechanical properties of gelatin. Also, a remarkable increase of gel strength was seen when 1-5 w/v% of HNTs were incorporated into the MC/PG-1 hydrogel. Young's modulus was increased from 233.34 kPa to 516.07 kPa when the concentration of HNTs was increased from 0 to 5 w/v% in MC/PG-1, which can be attributed to reinforcement characteristic of HNTs. The high potency of HNTs to reinforce other polymers was also reported before (Huang et al. 2017a). Furthermore, the tubular shape of HNTs and zigzag interaction with each other lead to more efficient loading condition, which affects mechanical properties (Roushangar Zineh et al. 2018). However, when HNTs content was increased to 7 w/v%, the mechanical performance was decreased (Table 3) that could be described by the reduction of load transfer mechanism due to the aggregation of HNTs at higher loading, which was previously reported for polyvinyl alcohol (Zhou et al. 2009; Azmi et al. 2016).
3.6. Rheology of hydrogels
The effect of PG and HNTs addition on gelling behavior of MC based hydrogels was studied using rheological analysis. Oscillatory temperature sweep tests (Fig. 2a) showed that at low temperature, storage moduli (G') was lower than loss moduli (G"), however, increasing temperature caused G' > G" indicating the thermosensitivity of the designed hydrogels. Addition of PG reduced the time and temperature of gelation (G' = G"), so that by adding 1% of PG to MC hydrogel the gelation temperature decreased from 29.8 °C to 27.3 °C and gelation time was also reduced from 247 s to 94 s. PG provides more –COOH and –OH groups (Ghasemzadeh and Modiri 2020), which can act as binding sites for ionic crosslinking (Kumar et al. 2019). Fig 2b shows the viscosity changes of MC based hydrogels containing 0.25-1.5% PG through increasing temperature. The viscosity was reduced initially because of the disentanglement of the macromolecular chain and disconnection of the water cage structure around the polymer molecules (Bain et al. 2012). By reaching gelling temperature, hydrophobic domains of MC molecules aggregate and consequently increase its viscosity rapidly.
MC based hydrogels were tested for their viscosity changes against strain and shear stress variation to study the shear-thinning properties of the hydrogels (Fig. 3a). In this test, the increased shear rate from about 0.3 s-1 decreased the viscosity of MC hydrogel while this reduction in viscosity happened more significantly at lower shear rates for other formulations. Incorporation of 1% of PG in MC caused a significant increment in viscosity and strength of MC/PG-1 hydrogel compared to MC (Fig. 3a). Besides, addition of HNTs in this hydrogel (MC/PG-1) caused further enhancement of viscosity and all the hydrogels showed a shear-thinning behavior by increasing the shear rate in comparison to both MC and MC/PG-1 hydrogels and became dependent on the applied stress. Although the viscosity of all hydrogels containing 1-7% HNTs was higher than the MC/PG-1, increments in concentrations of HNTs from 1 to 5% gradually increased the viscosity and further increased HNTs concentration to 7% showed lower viscosity, which may be due to less effective crosslinking by hydrogen bonds of HNTs at high concentration and their aggregation.
Fig. 3b represents the storage moduli (G') or strength of MC based hydrogels versus frequency at 25 °C. The G' value indicates hydrogel strength, i.e., the hydrogel with a higher G' value showed higher strength. The MC/PG-1 hydrogel showed a remarkably higher G' compared to MC hydrogel. The high number of carboxyl and hydroxyl functional groups in the structure of PG could provide more sites for ionic crosslinking of hydrogel-network leading to enhanced gel strength and mechanical properties. By incorporation of HNTs, the G' value increased significantly compared to both MC and MC/PG-1, but 3% of HNTs showed higher G' values in comparison to other concentrations, which can be attributed to the better reinforcing effect of HNTs through increasing crosslinking sites at this concentrations. However, incorporation of HNTs at the concentrations of 5% and 7%, resulted in the reduced gel strength of MC/PG-1/HNTs compared to the incorporation of 3%, which may be due to the aggregation of nanotubes.
3.7. SEM morphology of freeze-dried hydrogels
The SEM morphological characteristics of freeze-dried MC, MC/PG-1 and MC/PG-1/HNTs 3% hydrogels are shown in Fig. 4. All hydrogel samples revealed three-dimensional porous network structures with inter-connected pores, which are suitable for cell feeding, adhesion, growth and proliferation through incubation. A similar structure has been reported for MC based hydrogels (Huang et al. 2020). However, PG changed the micro morphology of MC hydrogel and resulted in a more compact gel. This could be attributed to the PG ability to increase molecular interactions and cross-linking (Ghasemzadeh and Modiri 2020). Inclusion of HNTs into the MC/PG-1 hydrogel decreased the pore size and increased the roughness of pore wallsthrough the aggregation of nanotubes. Huang et al. (2017b) also have reported the same results for addition of HNTs to cellulose hydrogel. Moreover, the pore size of other polymeric hydrogels has also been reduced with the incorporation of HNTs (Amir Afshar and Ghaee 2016).
3.8. Degradation and swelling of MC/PG based hydrogels
The degradation of designed hydrogels (Table 3) was studied by calculating the samples’ weight losses in PBS for 28 days. The effects of PG and HNTs addition to MC hydrogel on degradation process are shown in Fig. 5a and b, respectively. In all formulations, the weight loss was increased over time, which indicates their hydrolytic degradation ability. Incubation of cross-linked MC hydrogel for 4 days caused 30% weight loss due to gel erosion mechanism (Liu and Yao 2015; Deng et al. 2020). PG inclusion decreased degradation rate compared to MC sample (p <0.05), which could be contributed to the structure of PG containing CH3, CH2, -COO-, C-O, C=O, OH and -COOH groups that enhanced hydrogen bonding ability and hydrogel strength (Ghasemzadeh and Modiri 2020). As shown in Fig. 5b, approximately for the first 7 days weight loss in HNTs incorporated hydrogel (MC/PG-1/HNTs 3%) was significantly less than MC/PG-1 that can be due to the hydrogen bonds between clay nanotubes and OH groups of methylcellulose (Huang et al. 2017b). However, after 28 days the weight loss of MC/PG-1/HNTs 3% hydrogel was higher than MC/PG-1 (p <0.05) due to the deterioration caused by leaching out of HNTs from the hydrogel (Kumar et al. 2019).
In order to provide cells with nutrients during incubation in the tissue engineering process, a hydrogel should absorb and retain specific quantities of water (Huang et al. 2019). Fig. 5c and d show the swelling trend of different MC-based hydrogels in the presence of PG and HNTs, respectively. It is clear from results that the swelling degree of pure MC sample has been increased about 2 times by the addition of 1 w/v% PG (MC/PG-1), which could be explained by PG high capacity for water absorption and bonding (Ghasemzadeh and Modiri 2020). In contrast, HNTs incorporation (MC/PG-1/HNTs 3%) significantly decreased water uptake (p <0.05) due to acting as a barrier for water absorption by turning the original diffusion path of water into a tortuous path (Hasan et al. 2018). Besides, increased cross-linking by the addition of HNTs could inversely result in decreased swelling (Huang et al. 2017b; Kumar et al. 2019).
3.9. TAX release properties
Thein vitro release profile of TAX from HNTs-TAX as well as MC/PG-1/HNTs 3% hydrogel containing HNTs-TAX (MC/PG/HNTs-TAX) was monitored in PBS at physiological pH for 15 days and the results are shown in Fig. 6. An initial burst release of TAX (about 70%) was seen within 12 h due to the fast dissolution of weakly stored drug in fine tubes or the superficial drug molecules attached on the external surface of HNTs (Vergaro et al. 2012). Then a sustained release pattern of TAX which was about 98% of the loaded drug was followed during the next 108 h. The drug release is diffusion controlled due to TAX passage through the pores of HNTs. As the release profile of TAX displayed MC/PG/HNTs-TAX hydrogel caused a significant slower release rate of TAX than HNTs-TAX (p < 0.05), so that after 84 h around 70% and within 8 days 98% of TAX was released from hydrogels. This can be due to the additional barrier provided by hydrogel matrix through which TAX must diffuse (Wu et al. 2019). Therefore, incorporating HNTs-TAX into the hydrogels resulted in the slower TAX release rate desired for bone repair.
3.10. Cell culture studies
3.10.1. MTT assay
Before examining the cell proliferation on designed hydrogels, it was necessary to find the IC50 of TAX on MG-63 cells to select the best concentration of TAX, which was less than its toxic dose. The IC50 was measured by exposing the cells to different concentrations of TAX (0 - 500 µM) for 24, 48 and 96 h. According to the toxicity results, the IC50 of the drug was not measurable up to 48 h, and it was calculated to be 319.8 µM at 96 h, which was consistent with other studies that mentioned TAX toxicity effects are dose and time dependent (Satué et al. 2013; Cai et al. 2018). Then, the MG-63 cell proliferation was evaluated using MTT assay after 1, 4, and 7 days of culturing on MC based hydrogels as well as the tissue culture medium (control). In light of the results (Fig. 7a), none of the hydrogel samples had toxicity. Blending PG with MC hydrogel was shown to be in favor of cell growth and the cell survival of MC/PG-1 was enhanced after 4 and 7 days compared to MC hydrogel, which could be due to the improvement of mechanical properties and swelling behavior (Zhu and Marchant 2011). In all-time points, the addition of HNTs substantially increased cell proliferation caused by increasing surface roughness and osteoblast adhesion (Kumar et al. 2019). Moreover, the presence of silicon in HNTs structure could promote higher cell viability of osteoblast-like cells (Zhou et al. 2009). Results also indicated that MG-63 cells proliferated better on MC/PG-1/HNTs-TAX samples especially when the drug concentration was 100 µM compared to TAX-free hydrogel (MC/PG-1/HNTs 3%) after 4 and 7 days, which was consistent with prior reportsthat TAX could accelerate osteoblast numbers (Lektemur Alpan et al. 2020). Thus, these results suggest that our designed hydrogel (MC/PG-1/HNTs-TAX 100 µM) can be a successful host for bone cells.
3.10.2. Alkaline phosphatase (ALP) activity
ALP activity is an indicative for the differentiation of MG-63 osteoblast cells on hydrogel samples. According to the results shown in Fig. 7b, ALP activity enhanced with increment in cell culture period. MC/PG-1 hydrogel showed an increase of ALP activity of cells (p < 0.05) after 14 days in comparison to cell culture medium, which shows that PG can probably enhance osteoblasts activity thanks to its high calcium content (Abbasi 2017) similar to arabinogalactan and Arabic gum (Hadavi et al. 2017). In addition, the presence of HNTs and TAX also showed an increase in ALP and osteoblast activity both in 7 and 14 days of cell culturing, as shown in previous studies for HNTs (Boraei et al. 2021) and TAX (Wang et al. 2017). These findings indicate that M/PG-1/HNT-TAX100 µM can increase osteoblast cells proliferation and may be utilized for bone repair purposes.
3.10.3. Alizarin Red S staining
The osteogenic activity of hydrogel samples in the presence or absence of TAX was qualitatively evaluated by Alizarin Red Sstaining, which is a famous marker for determining calcium deposition in osteoblasts. After 2 weeks of cells cultured on different hydrogel samples Alizarin RedS coloration showed a difference in the intensity of the reddish color of the generated calcium granules, as revealed in Fig. 7c. MC/PG-1/HNT3% and MC/PG-1/HNT-TAX 100 µMexhibited a red color on the surface with the lowest intensity displayed by M/PG-1/HNTs and the highest shown by the M/PG-1/HNT-TAX100 µM. This shows that addition of HNTs to MC based hydrogel can provide a suitable bioactive surface for bone mineralization. Also, the TAX-releasing hydrogel had a significantly higher Alizarin RedS-calcium complex (red dots), which confirms the ability of TAX for osteogenesis (Wang et al. 2017).
3.10.4. Cell adhesion
Interaction of the MG-63 cells with MC/PG-1/HNTs-TAX 100 µM was visualized by SEM images (Fig. 8a). The formation of filopodia after 7 days confirmed the proper adhesion of cells to the hydrogel.
3.10.5. Gene expression
According to the obtained results from quantitative real-time PCR (Fig. 8b), which were arising in compression of a reference housekeeping gene (β-actin), MG-63 cells cultured on MC/PG-1/HNTs-TAX100 µM hydrogel for 14 days clearly produced more collagen 1 (COL1A1), osteocalcin (BGLAP), and osteopontin (SPP1) genes as differentiation markers compared to MC/PG-1/HNTs 3%. These results demonstrated that hydrogels containing TAX had a higher ability in osteoblast differentiation. TAX has been approved to stimulate osteoblast differentiation through the suppression of NF-κB signaling pathway (Wang et al. 2017). Also, the power of MC/PG-1/HNTs 3% to express COL1A1 and BGLAP was noticeable compared to MC/PG-1 and MC hydrogels. These results show that MC/PG-1/HNT-TAX hydrogel can stimulate bone markers possibly due to the synergistic effect of HNTs and TAX.
A rat femoral defect (5 mm in diameter) (Fig. 9a) was created to evaluate the bone-forming ability of Mg-63 cells-laden MC/PG-1/HNTs 3% and MC/PG-1/HNTs-TAX 100 µM thermosensitive hydrogels. After 6 weeks, the regeneration of the defected bone was evaluated by radiography and histological assessment in comparison to the untreated defect. Radiographs (Fig. 9b) showed that the empty defects (control) could still be observed after 6 weeks, while hydrogel-implanted specimens showed more bone formation so that the partial complete bone healing was achieved by TAX loaded hydrogel.
Histological analysis revealed that the MC/PG-1/HNTs-TAX 100 µM group had the greatest bone repair after 6 weeks in comparison to other groups. Both H&E and Masson’s trichrome staining (MT staining) showed that the abundant amount of new bone formation possessed the mature lamellar structure (Fig 9c-4) along with the osteocytes that formed the osteon (Fig 9c-8). Also in this sample, osteoblastic and osteoclastic activities, as well as angiogenesis, were observed and very little connective tissue with fine collagen fibers was detected. In contrast, the control group (untreated) represented the lowest amount of bone formation with immature structure (Fig 9c-1, 5). Moreover, TAX devoid hydrogel (Fig 9c-2, 6) showed new bone formation with varying amounts of mature spongy bone containing osteoblasts along with angiogenic areas, indicating that this hydrogel could be a good choice for bone regeneration.
For the first time, an injectable thermosensitive hydrogel based on MC/PG reinforced with TAX loaded HNTs was fabricated successfully. Results indicated that the mechanical and rheological characteristics of the hydrogel were improved significantly by the addition of PG and HNTs. Besides, the swelling ratio and degradation behavior of hydrogels were impressed by the PG and HNTs concentrations. Incorporation of TAX-HNTs into MC/PG-1/HNTs hydrogel exhibited much slower TAX release, which can be suitable for bone tissue engineering. Results showed higher osteoblast proliferation, adhesion, differentiation and bone-related gene expression by MC/PG-1/HNTs-TAX 100 µM compared to MC/PG-1/HNTs 3%, MC/PG-1 and MC hydrogels. The findings from the experiments on femoral defects induced in animal tests demonstrated that the MC/PG-1/HNTs-TAX 100 µM hydrogel could serve as a proper support for MG-63 cells differentiation and osteogenesis, recovery of bone and making a helpful approach to treat bone breaks.
Acknowledgment
The content of this paper was extracted from projects No. 198162 and 297046 approved by Pharmacy Student's Research Committee, and Novel Drug Delivery Systems Research Center, School of Pharmacy, Isfahan University of Medical Sciences, Isfahan, respectively.
- Abbasi S (2019) Persian gum (Amygdalus scoparia Spach). In: Razavi SMA (ed) Emerging Natural Hydrocolloids: Rheology and Functions. John Wiley & Sons, Ltd, pp 273–298
- Abbasi S (2017) Challenges towards characterization and applications of a novel hydrocolloid: Persian gum. Curr Opin Colloid Interface Sci 28:37–45. https://doi.org/https://doi.org/10.1016/j.cocis.2017.03.001
- Abbasi S, Mohammadi S, Rahimi S (2011) Partial substitution of gelatin with Persian gum and use of Olibanum in production of functional pastille. Biosyst Eng 42:121–131
- Agarwal R, García AJ (2015) Biomaterial strategies for engineering implants for enhanced osseointegration and bone repair. Adv Drug Deliv Rev 94:53–62. https://doi.org/10.1016/j.addr.2015.03.013
- Alencastre I, Sousa D, Alves C et al (2016) Delivery of pharmaceutics to bone: Nanotechnologies, high-throughput processing and in silico mathematical models. Eur Cell Mater 31:355–381. https://doi.org/10.22203/eCM.v031a23
- Alves MC, de Almeida PA, Polonini HC et al (2018) Taxifolin: Evaluation Through Ex vivo Permeations on Human Skin and Porcine Vaginal Mucosa. Curr Drug Deliv 15:1123–1134. https://doi.org/10.2174/1567201815666180116090258
- Amini AR, Laurencin CT, Nukavarapu SP (2012) Bone tissue engineering: recent advances and challenges. Crit Rev Biomed Eng 40:363–408. https://doi.org/10.1615/critrevbiomedeng.v40.i5.10
- Amir Afshar H, Ghaee A (2016) Preparation of aminated chitosan/alginate scaffold containing halloysite nanotubes with improved cell attachment. Carbohydr Polym 151:1120–1131. https://doi.org/https://doi.org/10.1016/j.carbpol.2016.06.063
- Amiryaghoubi N, Noroozi Pesyan N, Fathi M, Omidi Y (2020) Injectable thermosensitive hybrid hydrogel containing graphene oxide and chitosan as dental pulp stem cells scaffold for bone tissue engineering. Int J Biol Macromol 162:1338–1357. https://doi.org/10.1016/j.ijbiomac.2020.06.138
- Azmi S, Razak SIA, Abdul Kadir M et al (2016) Reinforcement of Poly(vinyl alcohol) Hydrogel with Halloysite Nanotubes as Potential Biomedical Materials. Soft Mater. https://doi.org/10.1080/1539445X.2016.1242500
- Bain MK, Bhowmick B, Maity D et al (2012) Synergistic effect of salt mixture on the gelation temperature and morphology of methylcellulose hydrogel. Int J Biol Macromol 51:831–836. https://doi.org/10.1016/j.ijbiomac.2012.07.028
- Bavnhøj CG, Knopp MM, Madsen CM, Löbmann K (2019) The role interplay between mesoporous silica pore volume and surface area and their effect on drug loading capacity. Int J Pharm X 1:100008. https://doi.org/https://doi.org/10.1016/j.ijpx.2019.100008
- Boraei SBA, Nourmohammadi J, Bakhshandeh B et al (2021) Enhanced osteogenesis of gelatin-halloysite nanocomposite scaffold mediated by loading strontium ranelate. Int J Polym Mater Polym Biomater 70:392–402. https://doi.org/10.1080/00914037.2020.1725754
- Cai C, Liu C, Zhao L et al (2018) Effects of Taxifolin on Osteoclastogenesis in vitro and in vivo. Front Pharmacol 9:1286. https://doi.org/10.3389/fphar.2018.01286
- Córdoba A, Manzanaro-Moreno N, Colom C et al (2018) Quercitrin Nanocoated Implant Surfaces Reduce Osteoclast Activity In Vitro and In Vivo. Int J Mol Sci 19:. https://doi.org/10.3390/ijms19113319
- Dabestani M, Kadkhodaee R, Phillips GO, Abbasi S (2018) Persian gum: A comprehensive review on its physicochemical and functional properties. Food Hydrocoll 78:92–99. https://doi.org/https://doi.org/10.1016/j.foodhyd.2017.06.006
- Dalwadi C, Patel G (2018) Thermosensitive nanohydrogel of 5-fluorouracil for head and neck cancer: preparation, characterization and cytotoxicity assay. Int J Nanomedicine 13:31–33. https://doi.org/10.2147/IJN.S124702
- Deng L, Liu Y, Yang L et al (2020) Injectable and bioactive methylcellulose hydrogel carrying bone mesenchymal stem cells as a filler for critical-size defects with enhanced bone regeneration. Colloids Surf B Biointerfaces 194:111159. https://doi.org/10.1016/j.colsurfb.2020.111159
- Fadavi G, Mohammadifar MA, Zargarran A et al (2014) Composition and physicochemical properties of Zedo gum exudates from Amygdalus scoparia. Carbohydr Polym 101:1074–1080. https://doi.org/https://doi.org/10.1016/j.carbpol.2013.09.095
- Farokhi M, Sharifi S, Shafieyan Y et al (2012) Porous crosslinked poly(ε-caprolactone fumarate)/nanohydroxyapatite composites for bone tissue engineering. J Biomed Mater Res A 100:1051–1060. https://doi.org/10.1002/jbm.a.33241
- Ghasemzadeh H, Modiri F (2020) Application of novel Persian gum hydrocolloid in soil stabilization. Carbohydr Polym 246:116639. https://doi.org/https://doi.org/10.1016/j.carbpol.2020.116639
- Hadavi M, Hasannia S, Faghihi S et al (2017) Novel calcified gum Arabic porous nano-composite scaffold for bone tissue regeneration. Biochem Biophys Res Commun 488:671–678. https://doi.org/10.1016/j.bbrc.2017.03.046
- Hasan SMK, Zainuddin S, Tanthongsack J et al (2018) A study of poly (3-hydroxybutyrate-co-3-hydroxyvalerate) biofilms’ thermal and biodegradable properties reinforced with halloysite nanotubes. J Compos Mater 52:3199–3207. https://doi.org/10.1177/0021998318763246
- Hasibi F, Nasirpour A, Varshosaz J et al (2020) Formulation and Characterization of Taxifolin-Loaded Lipid Nanovesicles (Liposomes, Niosomes, and Transfersomes) for Beverage Fortification. Eur J Lipid Sci Technol 122:1900105. https://doi.org/https://doi.org/10.1002/ejlt.201900105
- Hejazi F, Mirzadeh H (2016) Roll-designed 3D nanofibrous scaffold suitable for the regeneration of load bearing bone defects. Prog Biomater 5:199–211. https://doi.org/10.1007/s40204-016-0058-2
- Huang B, Liu M, Long Z et al (2017a) Effects of halloysite nanotubes on physical properties and cytocompatibility of alginate composite hydrogels. Mater Sci Eng C 70:303–310. https://doi.org/https://doi.org/10.1016/j.msec.2016.09.001
- Huang B, Liu M, Zhou C (2017b) Cellulose–halloysite nanotube composite hydrogels for curcumin delivery. Cellulose 24:2861–2875. https://doi.org/10.1007/s10570-017-1316-8
- Huang K, Ou Q, Xie Y et al (2019) Halloysite Nanotube Based Scaffold for Enhanced Bone Regeneration. ACS Biomater Sci Eng 5:4037–4047. https://doi.org/10.1021/acsbiomaterials.9b00277
- Huang Y, Guo W, Zhang J et al (2020) Thermosensitive hydrogels based on methylcellulose derivatives for prevention of postoperative adhesion. Cellulose 27:1555–1571. https://doi.org/10.1007/s10570-019-02857-4
- Khodaei D, Oltrogge K, Hamidi-Esfahani Z (2020) Preparation and characterization of blended edible films manufactured using gelatin, tragacanth gum and, Persian gum. LWT 117:108617. https://doi.org/https://doi.org/10.1016/j.lwt.2019.108617
- Kim MH, Kim BS, Park H et al (2018) Injectable methylcellulose hydrogel containing calcium phosphate nanoparticles for bone regeneration. Int J Biol Macromol 109:57–64. https://doi.org/10.1016/j.ijbiomac.2017.12.068
- Kondiah PJ, Choonara YE, Kondiah PPD et al (2016) A Review of Injectable Polymeric Hydrogel Systems for Application in Bone Tissue Engineering. Molecules 21:. https://doi.org/10.3390/molecules21111580
- Kouhi M, Varshosaz J, Beni B, Sarmadi A (2020) Injectable gellan gum/lignocellulose nanofibrils hydrogels enriched with melatonin loaded forsterite nanoparticles for cartilage tissue engineering: Fabrication, characterization and cell culture studies. Mater Sci Eng C 115:111114. https://doi.org/10.1016/j.msec.2020.111114
- Kumar A, Matari IAI, Choi H et al (2019) Development of halloysite nanotube/carboxylated-cellulose nanocrystal-reinforced and ionically-crosslinked polysaccharide hydrogels. Mater Sci Eng C Mater Biol Appl 104:109983. https://doi.org/10.1016/j.msec.2019.109983
- Kurczewska J, Pecyna P, Ratajczak M et al (2017) Halloysite nanotubes as carriers of vancomycin in alginate-based wound dressing. Saudi Pharm J SPJ Off Publ Saudi Pharm Soc 25:911–920. https://doi.org/10.1016/j.jsps.2017.02.007
- Lektemur Alpan A, Kızıldağ A, Özdede M et al (2020) The effects of taxifolin on alveolar bone in experimental periodontitis in rats. Arch Oral Biol 117:104823. https://doi.org/10.1016/j.archoralbio.2020.104823
- Li X, Nikiforow I, Pohl K et al (2013) Polyurethane Coatings Reinforced by Halloysite Nanotubes. Coatings 3:16–25. https://doi.org/10.3390/coatings3010016
- Liu M, Wu C, Jiao Y et al (2013) Chitosan-halloysite nanotubes nanocomposite scaffolds for tissue engineering. J Mater Chem B 1:2078–2089. https://doi.org/10.1039/c3tb20084a
- Liu Z, Yao P (2015) Injectable thermo-responsive hydrogel composed of xanthan gum and methylcellulose double networks with shear-thinning property. Carbohydr Polym 132:490–498. https://doi.org/https://doi.org/10.1016/j.carbpol.2015.06.013
- Lun H, Ouyang J, Yang H (2014) Natural halloysite nanotubes modified as an aspirin carrier. RSC Adv 4:44197–44202. https://doi.org/10.1039/C4RA09006C
- Lvov Y, Wang W, Zhang L, Fakhrullin R (2016) Halloysite Clay Nanotubes for Loading and Sustained Release of Functional Compounds. Adv Mater 28:1227–1250. https://doi.org/10.1002/adma.201502341
- Moeinpour F, Soofivand F, Mohseni-Shahri FS (2019) Controlled release of losartan from acid- and heat-treated halloysite nanotubes. Med Chem Res 28:160–168. https://doi.org/10.1007/s00044-018-2273-y
- Mokhtari H, Kharaziha M, Karimzadeh F, Tavakoli S (2019) An injectable mechanically robust hydrogel of Kappa-carrageenan-dopamine functionalized graphene oxide for promoting cell growth. Carbohydr Polym 214:234–249. https://doi.org/https://doi.org/10.1016/j.carbpol.2019.03.030
- Molaei H, Jahanbin K (2018) Structural features of a new water-soluble polysaccharide from the gum exudates of Amygdalus scoparia Spach (Zedo gum). Carbohydr Polym 182:98–105. https://doi.org/https://doi.org/10.1016/j.carbpol.2017.10.099
- Morsi NM, Nabil Shamma R, Osama Eladawy N, Abdelkhalek AA (2019) Bioactive injectable triple acting thermosensitive hydrogel enriched with nano-hydroxyapatite for bone regeneration: in-vitro characterization, Saos-2 cell line cell viability and osteogenic markers evaluation. Drug Dev Ind Pharm 45:787–804. https://doi.org/10.1080/03639045.2019.1572184
- Naumenko EA, Guryanov ID, Yendluri R et al (2016) Clay nanotube-biopolymer composite scaffolds for tissue engineering. Nanoscale 8:7257–7271. https://doi.org/10.1039/c6nr00641h
- Pan Q, Li N, Hong Y et al (2017) Halloysite clay nanotubes as effective nanocarriers for the adsorption and loading of vancomycin for sustained release. RSC Adv 7:21352–21359. https://doi.org/10.1039/C7RA00376E
- Pietraszek A, Karewicz A, Widnic M et al (2019) Halloysite-alkaline phosphatase system-A potential bioactive component of scaffold for bone tissue engineering. Colloids Surf B Biointerfaces 173:1–8. https://doi.org/10.1016/j.colsurfb.2018.09.040
- Rangabhatla ASL, Tantishaiyakul V, Oungbho K, Boonrat O (2016) Fabrication of pluronic and methylcellulose for etidronate delivery and their application for osteogenesis. Int J Pharm 499:110–118. https://doi.org/10.1016/j.ijpharm.2015.12.070
- Roushangar Zineh B, Shabgard MR, Roshangar L (2018) Mechanical and biological performance of printed alginate/methylcellulose/halloysite nanotube/polyvinylidene fluoride bio-scaffolds. Mater Sci Eng C Mater Biol Appl 92:779–789. https://doi.org/10.1016/j.msec.2018.07.035
- Satué M, Arriero M, del M, Monjo M, Ramis JM (2013) Quercitrin and taxifolin stimulate osteoblast differentiation in MC3T3-E1 cells and inhibit osteoclastogenesis in RAW 264.7 cells. Biochem Pharmacol 86:1476–1486. https://doi.org/10.1016/j.bcp.2013.09.009
- Sedghi R, Shaabani A, Sayyari N (2020) Electrospun triazole-based chitosan nanofibers as a novel scaffolds for bone tissue repair and regeneration. Carbohydr Polym 230:115707. https://doi.org/10.1016/j.carbpol.2019.115707
- Shikov AN, Pozharitskaya ON, Miroshnyk I et al (2009) Nanodispersions of taxifolin: impact of solid-state properties on dissolution behavior. Int J Pharm 377:148–152. https://doi.org/10.1016/j.ijpharm.2009.04.044
- Sunil C, Xu B (2019) An insight into the health-promoting effects of taxifolin (dihydroquercetin). Phytochemistry 166:112066. https://doi.org/10.1016/j.phytochem.2019.112066
- Tang Y, Wang X, Li Y et al (2010) Production and characterisation of novel injectable chitosan/methylcellulose/salt blend hydrogels with potential application as tissue engineering scaffolds. Carbohydr Polym 82:833–841. https://doi.org/https://doi.org/10.1016/j.carbpol.2010.06.003
- Tarahovsky YS, Selezneva II, Vasilieva NA et al (2007) Acceleration of fibril formation and thermal stabilization of collagen fibrils in the presence of taxifolin (dihydroquercetin). Bull Exp Biol Med 144:791–794. https://doi.org/10.1007/s10517-007-0433-z
- Terekhov RP, Selivanova IA, Tyukavkina NA et al (2020) Assembling the Puzzle of Taxifolin Polymorphism. Molecules 25:. https://doi.org/10.3390/molecules25225437
- Tian F, Hosseinkhani H, Hosseinkhani M et al (2008) Quantitative analysis of cell adhesion on aligned micro- and nanofibers. J Biomed Mater Res Part A 84A:291–299. https://doi.org/https://doi.org/10.1002/jbm.a.31304
- Vergaro V, Abdullayev E, Lvov YM et al (2010) Cytocompatibility and uptake of halloysite clay nanotubes. Biomacromol 11:820–826. https://doi.org/10.1021/bm9014446
- Vergaro V, Lvov YM, Leporatti S (2012) Halloysite clay nanotubes for resveratrol delivery to cancer cells. Macromol Biosci 12:1265–1271. https://doi.org/10.1002/mabi.201200121
- Walmsley GG, Ransom RC, Zielins ER et al (2016) Stem Cells in Bone Regeneration. Stem cell Rev reports 12:524–529. https://doi.org/10.1007/s12015-016-9665-5
- Wang Y-J, Zhang H-Q, Han H-L et al (2017) Taxifolin enhances osteogenic differentiation of human bone marrow mesenchymal stem cells partially via NF-κB pathway. Biochem Biophys Res Commun 490:36–43. https://doi.org/10.1016/j.bbrc.2017.06.002
- Wasupalli GK, Verma D (2020) Injectable and thermosensitive nanofibrous hydrogel for bone tissue engineering. Mater Sci Eng C Mater Biol Appl 107:110343. https://doi.org/10.1016/j.msec.2019.110343
- Welch AA, Hardcastle AC (2014) The effects of flavonoids on bone. Curr Osteoporos Rep 12:205–210. https://doi.org/10.1007/s11914-014-0212-5
- Wu Y, Zhang Y, Ju J et al (2019) Advances in Halloysite Nanotubes-Polysaccharide Nanocomposite Preparation and Applications. Polymers (Basel) 11:. https://doi.org/10.3390/polym11060987
- Zhang H-Q, Wang Y-J, Yang G-T et al (2019) Taxifolin Inhibits Receptor Activator of NF-κB Ligand-Induced Osteoclastogenesis of Human Bone Marrow-Derived Macrophages in vitro and Prevents Lipopolysaccharide-Induced Bone Loss in vivo. Pharmacology 103:101–109. https://doi.org/10.1159/000495254
- Zhou W, Guo B, Liu M et al (2009) Poly(vinyl alcohol)/Halloysite nanotubes bionanocomposite films: Properties and in vitro osteoblasts and fibroblasts response. J Biomed Mater Res A 93:1574–1587. https://doi.org/10.1002/jbm.a.32656
- Zhu J, Marchant RE (2011) Design properties of hydrogel tissue-engineering scaffolds. Expert Rev Med Devices 8:607–626. https://doi.org/10.1586/erd.11.27
- Zu S, Yang L, Huang J et al (2012) Micronization of taxifolin by supercritical antisolvent process and evaluation of radical scavenging activity. Int J Mol Sci 13:8869–8881. https://doi.org/10.3390/ijms13078869
- Zu Y, Wu W, Zhao X et al (2014a) The high water solubility of inclusion complex of taxifolin-γ-CD prepared and characterized by the emulsion solvent evaporation and the freeze drying combination method. Int J Pharm 477:148–158. https://doi.org/10.1016/j.ijpharm.2014.10.027
- Zu Y, Wu W, Zhao X et al (2014b) Enhancement of solubility, antioxidant ability and bioavailability of taxifolin nanoparticles by liquid antisolvent precipitation technique. Int J Pharm 471:366–376. https://doi.org/https://doi.org/10.1016/j.ijpharm.2014.05.049
- Graphicalabstract.jpg
Graphical Abstract