Identification and analysis of CA genes
We identified 11 CA genes from the P. yezoensis transcriptome and amplified them from genomic DNA using specific primers (S1 TableS1). Four CA genes belonged to the α type, three belonged to the γ type and four belonged to the β type, including one previously reported βCA renamed PyCA1. The characteristics of the other CA genes, the putative amino acid sequences and the distribution among chromosomes are listed in Table 1. Sequences of these CA genes have been submitted to GenBank with the accession numbers listed in Table 1.
|
Table 1
The characteristic of all the CA genes of Pyropia yezoensis
|
|
name
|
|
accession No. in NCBI
|
length
|
ORF
|
5'UTR
|
3'UTR
|
amino acids number
|
MW (kD)
|
PI
|
subtype
|
location in chromosome
|
|
PyCA1
|
DN38784_c0_g1
|
FJ160292
|
1153
|
825
|
177
|
151
|
274
|
29.8
|
8.51
|
β
|
C1
|
|
PyCA2
|
DN99529_c0_g1
|
MN132853
|
1867
|
693
|
876
|
298
|
274
|
29.8
|
11.29
|
β
|
C3
|
|
PyCA3
|
DN126328_c0_g1
|
MN132854
|
900
|
828
|
12
|
60
|
275
|
27.75
|
5.5
|
α
|
C2
|
|
PyCA4
|
DN84778_c0_g1
|
MN132855
|
1503
|
591
|
770
|
142
|
225
|
23.65
|
4.78
|
α
|
C1
|
|
PyCA5
|
DN105259_c0_g1
|
MN132856
|
1059
|
855
|
204
|
0
|
348
|
34.31
|
8.33
|
β
|
C2
|
|
PyCA6
|
DN50495_c0_g1
|
MN132857
|
1265
|
963
|
257
|
45
|
320
|
33.92
|
9.41
|
α
|
C3
|
|
PyCA7
|
DN91854_c1_g1
|
MT375595
|
1192
|
693
|
308
|
191
|
229
|
22.81
|
5.37
|
β
|
C3
|
|
PyCA8
|
DN91438_c0_g1
|
MT375597
|
879
|
609
|
118
|
152
|
202
|
21.47
|
6.03
|
α
|
C1
|
|
PyCA9
|
DN92894_c0_g1
|
MT375598
|
1222
|
873
|
185
|
164
|
290
|
29.02
|
4.71
|
γ
|
C1
|
|
PyCA10
|
DN146474_c0_g1
|
MT375699
|
776
|
732
|
23
|
21
|
243
|
26.33
|
6.08
|
γ
|
unknown
|
|
PyCA11
|
DN104395_c0_g1
|
MW800877
|
1094
|
822
|
76
|
196
|
273
|
26.63
|
4.93
|
γ
|
C2
|
βCAs
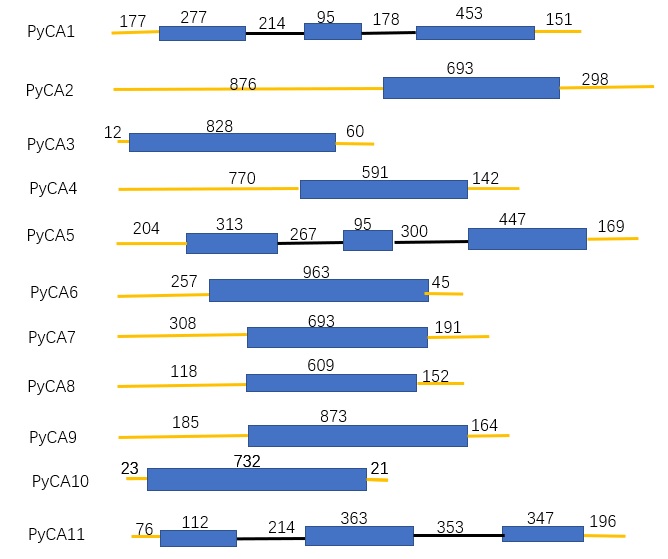
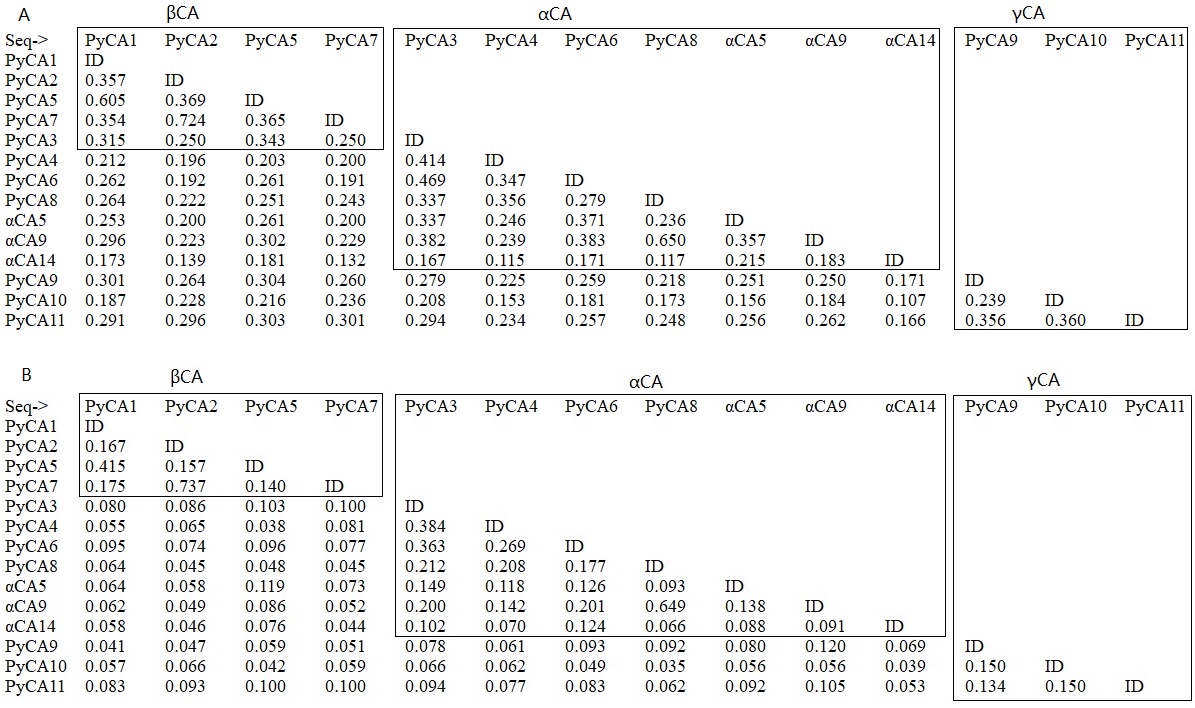
PyCA1, PyCA2, PyCA5 and PyCA7 are representative βCAs in P. yezoensis. The PyCA1 (βCA1) and PyCA5 (βCA3) genes have similar structures, consisting of three exons (S2 Fig. S1). The second exon comprises 95 nucleotides, with 86.3% similarity between genes. The two βCAs share 60% and 41.5% nucleotide and amino acid identity, respectively (S3 Fig S2), and are found on chromosome 1 (C1) and chromosome 2 (C2), respectively (Table 1). Multiple transmembrane sites in PyCA5 were predicted by TMpred. PyCA2 (βCA2) and PyCA7 (βCA4) are composed of one exon; moreover, the open reading frame (ORF) of the two genes comprises 693 nucleotides (S2 Fig. S1), with more than 70% identity at both the nucleotide level and the amino acid level (S3 Fig S2). These two genes are located on chromosome 3 (C3), with PyCA2 only 1.4 kb away from PyCA7, possibly because of a recent gene duplication. There is no transmembrane site in PyCA2, whereas the transmembrane site in PyCA7 spans from amino acids 124 to 141.
The zinc binding sites and active sites in the four βCAs are all conserved with respect to those of reported βCAs from other bacterial, microalgal and higher plant species, and are coordinated by two Cys residues and one His residue (Fig. 1A) [24, 25]. The active site conservation supports a role of these proteins in CO2 and bicarbonate conversion in different parts of P. yezoensis.
We generated a phylogenetic tree of the CAs by using the maximum-likelihood method, on the basis of the full-length ORFs of CA proteins (Fig. 2). In the phylogenetic tree, the four βCAs are divided into two subclades. PyCA2 and PyCA7 clustered closely with CAs from P. haitanensis. Meanwhile, PyCA1 and PyCA5 cluster closely with CAs from rhodophytes and green algae, such as Porphyra umbilicalis, Porphyridium purpureum and Coccomyxa sp., thus indicating the different evolution and origins of these four βCAs.
αCAs
PyCA3 (αCA1), PyCA4 (αCA2), PyCA6 (αCA3) and PyCA8 (αCA4) are representatives of αCAs in P. yezoensis, and their genes are all composed of one exon. These CAs are quite different from one another at the amino acid level, with less than 40% identity among them; the similarity at the nucleotide level is 17–38% (S3 Fig S2).) These four αCAs also show low similarity with other reported PyαCAs at the amino acid and nucleotide levels, with the exception of PyCA8 and αCA9 having about 65% identity. PyCA4 and PyCA8 are located on the same chromosome, C1. PyCA3 and PyCA6 are located on chromosomes C2 and C3, respectively (Table 1).
The four αCAs all have transmembrane sites, and PyCA3 has three transmembrane sites predicted by the TMpred server. The zinc binding sites of PyCA3 and PyCA4 differ from those of most reported αCAs, which have three His residues coordinating the Zn ion [25]. However, in PyCA3, Gln149 is substituted for the last conserved His residue, and PyCA4 lacks His at two conserved positions, which are replaced by Gln residues (Fig. 1B). This site structure was also observed in the αCAs of P. tricornutum; Although some PtαCAs lack the conserved His residues, these sequences have all been suggested to possess potential Zn ligands within the putative active domain [26].
Three PyαCAs (PyCA3, PyCA4 and PyCA6) and CAs from P. haitanensis and P. umbilicalis form a group in the phylogenetic tree, separated from the CAs from Arabidopsis thaliana, Chlamydomonas reinhardtii and Dunaliella salina. However, PyCA8 is separated from other PyCAs and closer to CA from A. thaliana in the phylogenetic tree (Fig. 2). These results indicate divergence in origin and evolution.
γCAs
There are three γCAs in P. yezoensis, in agreement with the report from Wang et al. (2020) [21]. PyCA9 (γCA1) and PyCA11 (γCA3) are located on chromosomes C1 and C2, respectively, while PyCA10 (γCA2) could not be located on any of the chromosomes (Table 1). PyCA9 and PyCA10 are composed of one exon, whereas PyCA11 has three exons (S2 Fig.S1). The similarity of nucleotide sequences and amino acids sequences among the three γCAs in P. yezoensis is low, at approximately 30% and 15%, respectively (S3 Fig S2).
According to the annotation of classical γCA from Methanosarcina thermophila (denoted as CAM), three histidine residues (His 115, His 151 and His 156) are essential for coordinating a Zn atom [31]. PyCA10 has two conserved His residues but not His151, which is replaced by glutamic acid (Fig. 1C). PyCA9 and PyCA11 lack the three conserved histidine residues and thus should be renamed as γ-like CAs. According to the annotation of CAM, Arg93, Asp95, Gln109, Asp110, His151 and His156 are important residues in γCA that are predicted to function in proton transfer in the CAM mechanism [28]. Most residues corresponding to these residues are conserved in PyCA10, with the exception of Gln109 and His151, which are replaced by glycine and glutamic acid, respectively (Fig. 1C). The putative proton-transferring amino acids in CAM are mostly conserved in PyCA9 and PyCA11, which, unlike PyCA10, have transmembrane sites.
In the phylogenetic tree, PyCA10 and CA11 are clustered with CAs from bacteria and green algae or higher plants (Fig. 2). However, PyCA9 is distinct from PyCA10 and PyCA11 and clusters together with CAs from rhodophytes such as P. haitanensis, P. umbilicalis and Gracilariopsis chorda, thus suggesting a high degree of divergence in origin and evolution between PyCA9 and the other two γCAs.
Intracellular localization
We examined the subcellular localization of the 11 Pyropia CA proteins by using a combination of bioinformatic analysis and experimental localization of translational protein fusions. Prediction results from seven predictors are listed in S4 Table S2. The predictions from most programs were very similar for the PyβCAs PyCA1, PyCA2 and PyCA5, but not for PyCA7. Among the four PyαCAs, except for PyCA4, the prediction programs yielded inconsistent results. The three PyγCAs predictions from six programs nearly coincided. However, the results from YLoc and ChloroP contradicted those of the other predictors for most PyCAs. By combining the predictions from several predictors, we concluded that PyCA1 and PyCA6 are likely to be localized in the chloroplast, and PyCA3 has a signal peptide. PyCA9 and PyCA11 may be are localized in the mitochondria. PyCA2, PyCA4, PyCA5 and PyCA10 may be localized in the cytoplasm. The localization of PyCA7 and PyCA8 is unclear because the predictions did not agree with one another.
Experimental data highlight the limits of in silico predictions for analysis of subcellular localization. We introduced the plasmid PBWA (V) HS-PyCA-GLosgfp into Arabidopsis protoplasts by PEG4000 and used PBWA (V) HS- GLosgfp as a control.
We confirmed that the βCA PyCA1 was located exclusively in the chloroplast, because the GFP fluorescence overlapped with the red chlorophyll autofluorescence (Fig. 3A); the green fluorescence from GFP was dispersed evenly throughout the cytoplasm of each infected cell harboring the PBWA (V) HS - GFP control vector (Fig. 3I). PyCA2 is a cytoplasmic CA because the GFP fluorescence was observed predominantly in the cytoplasm, although GFP fluorescence was also observed in the nuclei of Arabidopsis protoplasts (Fig. 3B), in agreement with the prediction result. We did not observe GFP fluorescence in PyCA5 and PyCA7, and therefore were unable to define their location in Arabidopsis protoplasts.
Combined GFP fluorescence and prediction results suggested that the αCA PyCA3 may be located in the endoplasmic reticulum (Fig. 3C). PyCA4 is also cytoplasmic, similarly to PyCA2 (Fig. 3D). The most interesting localization result was that of PyCA6, which did not appear to in chloroplast, as indicated by the green fluorescence of GFP (Fig. 3E), a finding contrary to the prediction. To verified its exact localization, we introduced the mitochondrial marker MSTP into the expression plasmid PBWA (V) HS-MSTP-GLosmkate. The green fluorescence from the targeted protein overlapped with the red fluorescence from the marker protein and showed yellow fluorescence, thus indicating that PyCA6 is mitochondrial (Fig. 4). GFP fluorescence was not observed in Arabidopsis protoplasts transformed with the PyCA8-GFP fusion.
The GFP fluorescence suggested that the γCAs PyCA9 and PyCA11 are located exclusively in the mitochondria (Fig. 3F and 3H), but PyCA10 is localized in the cytoplasm (Fig. 3G), in agreement with the prediction results (S4 Table S2).
RNA expression differences between two life stages and under different Ci
PyCA1, PyCA2, PyCA4, PyCA5 and PyCA6 correspond to DN38784_c0_g1, DN99529_c0_g1, DN84778_c0_g1, DN105259_c0_g1 and DN50495_c0_g1, respectively, and the transcript abundance of these five CA genes in response to different Ci concentrations during the two life stages of P. yezoensis has been demonstrated and discussed in previous work [9]. We therefore determined the transcript abundance of the remaining six CA genes under different Ci conditions during the two life stages by using transcriptomic data (Fig. 5A), and we verified these results by using real-time fluorescent quantitative reverse-transcription PCR (qRT-PCR) (Fig. 5B). Primers for qRT-PCR are listed in S5 Table S3.
The abundance of PyCA3 in filamentous thalli was so low that it was almost undetectable. However, the PyCA3 abundance was very high in leafy thalli, at a level more than 20-fold higher than that in filamentous thalli, as verified by qRT-PCR. In contrast, PyCA10 was expressed in filamentous thalli and was almost undetectable in leafy thalli. The abundance of PyCA10 was not very high, and the reads per kilobase of exon model per million mapped reads (RPKM) value was approximately 7.93 under normal inorganic carbon conditions (NC). The Ct value of PyCA10 from qRT-PCR in the two life stages was over 32, indicating that the RNA abundance of PyCA10 was low. The PyCA8 transcript abundance was very low during the two life stages, and the RPKM value was less than 1. PyCA7, PyCA9 and PyCA11 showed greater abundance of RNA during the two life stages; moreover, the RNA content of PyCA7 and PyCA9 in filamentous thalli was higher than that in leafy thalli, (approximately 6- and 1.7-fold higher, respectively). In contrast, the abundance of PyCA11 transcript in leafy thalli was approximately 1.6-fold higher than that in filamentous thalli.
Transcriptome data indicated that low carbon conditions (LC) induced expression of PyCA3 and PyCA9 in leafy thalli, to levels approximately twofold higher than those under control carbon conditions (NC). No clear difference was observed between LC and NC in the filamentous thalli (Fig. 5A). Low carbon had clear effect on the expression of PyCA7 in the filamentous thalli, but no obvious effect on its expression in leafy thalli. High Ci concentrations (HC) decreased the expression of PyCA7 in leafy thalli; no clear difference between HC and NC in filamentous thalli was observed. The PyCA8 gene was highly expressed at the transcript level in filamentous thalli under LC, as indicated by an RPKM approximately threefold higher than that under NC. Expression of PyCA9 was induced by LC but not HC, as compared with NC in leafy thalli; however, PyCA9 expression in filamentous thalli was induced by HC but not LC, as compared with NC. HC and LC had no clear effect on the expression of PyCA10 in filamentous thalli. LC and HC induced expression of PyCA11 at the two life stages but to a similar extent as NC.
qRT-PCR showed an expression tendency similar to that revealed by transcriptomic data, with the exception that PyCA10 expression under LC was higher to that under NC in filamentous thalli, but was similar to that under NC in the transcriptomic data.