Microarray data. Three gene expression datasets [GSE26566, GSE32225, and GSE77984] were downloaded from GEO. The GSE26566 dataset contained 104 human cholangiocarcinoma tissues and six noncancerous samples [16]. GSE32225 contained 150 tumor samples and five normal human cholangiocytes [17]. GSE77984 contained ten cholangiocarcinoma cells and 12 normal human cholangiocytes [18]. The DEGs between CCA and noncancerous samples were analyzed using GEO2R (http://www.ncbi.nlm.nih.gov/geo/geo2r). Adj.P-value <0.01, and logFC (fold change) >1 were considered statistically significant.
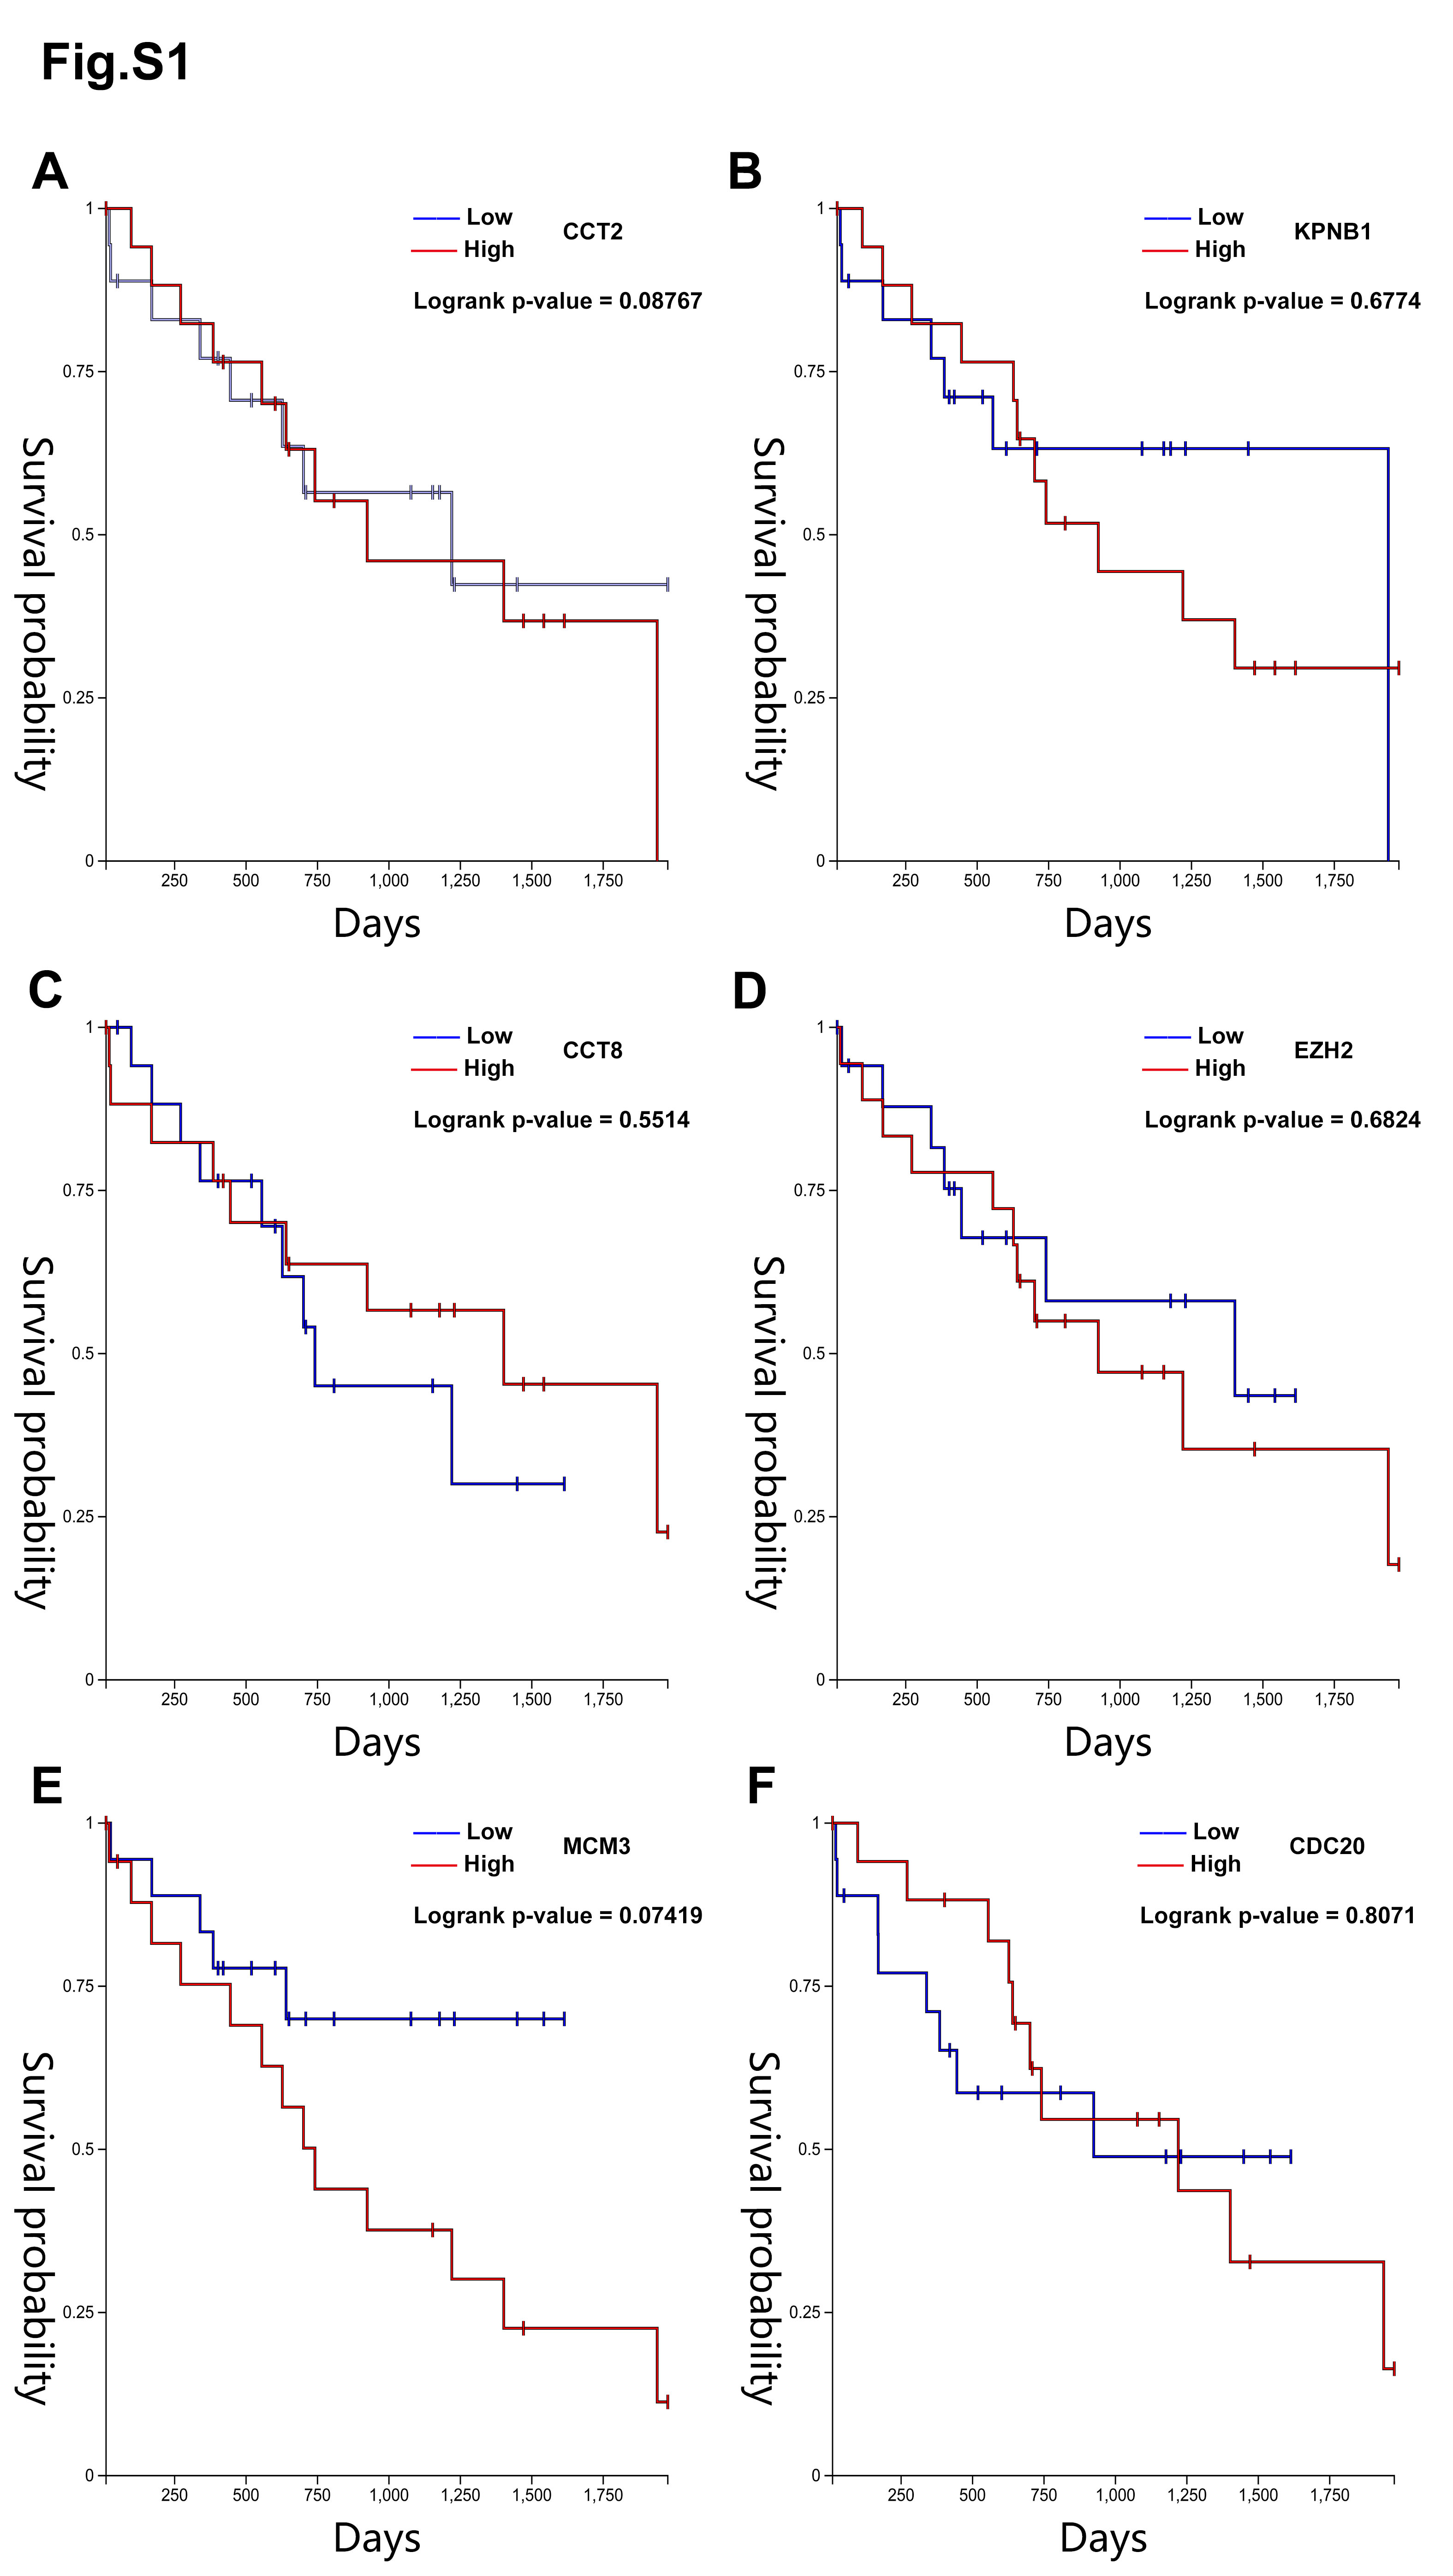
Bioinformatic analysis. The Database for Annotation, Visualization, and Integrated Discovery (DAVID; http://david.ncifcrf.gov) (version 6.7) was used to conduct biological analyses [19]. P<0.05 was considered statistically significant. Search Tool for the Retrieval of Interacting Genes (STRING; http://string-db.org) (version 11.0) was performed to predict the functional interactions between proteins and with a combined score >0.4 was considered statistically significant [20]. The plug-in Molecular Complex Detection (MCODE) (version 1.4.2) of Cytoscape was used to find densely connected regions with the criteria for selection as following: MCODE scores >5, degree cut-off=2, node score cut-off=0.2, Max depth=100 and k-score=2, and the hub genes were selected with degrees ≥15 [21]. Hierarchical clustering and the overall survival analyses of hub genes were constructed using the UCSC Cancer Genomics Browser (https:// genome-cancer.ucsc.edu) [22].
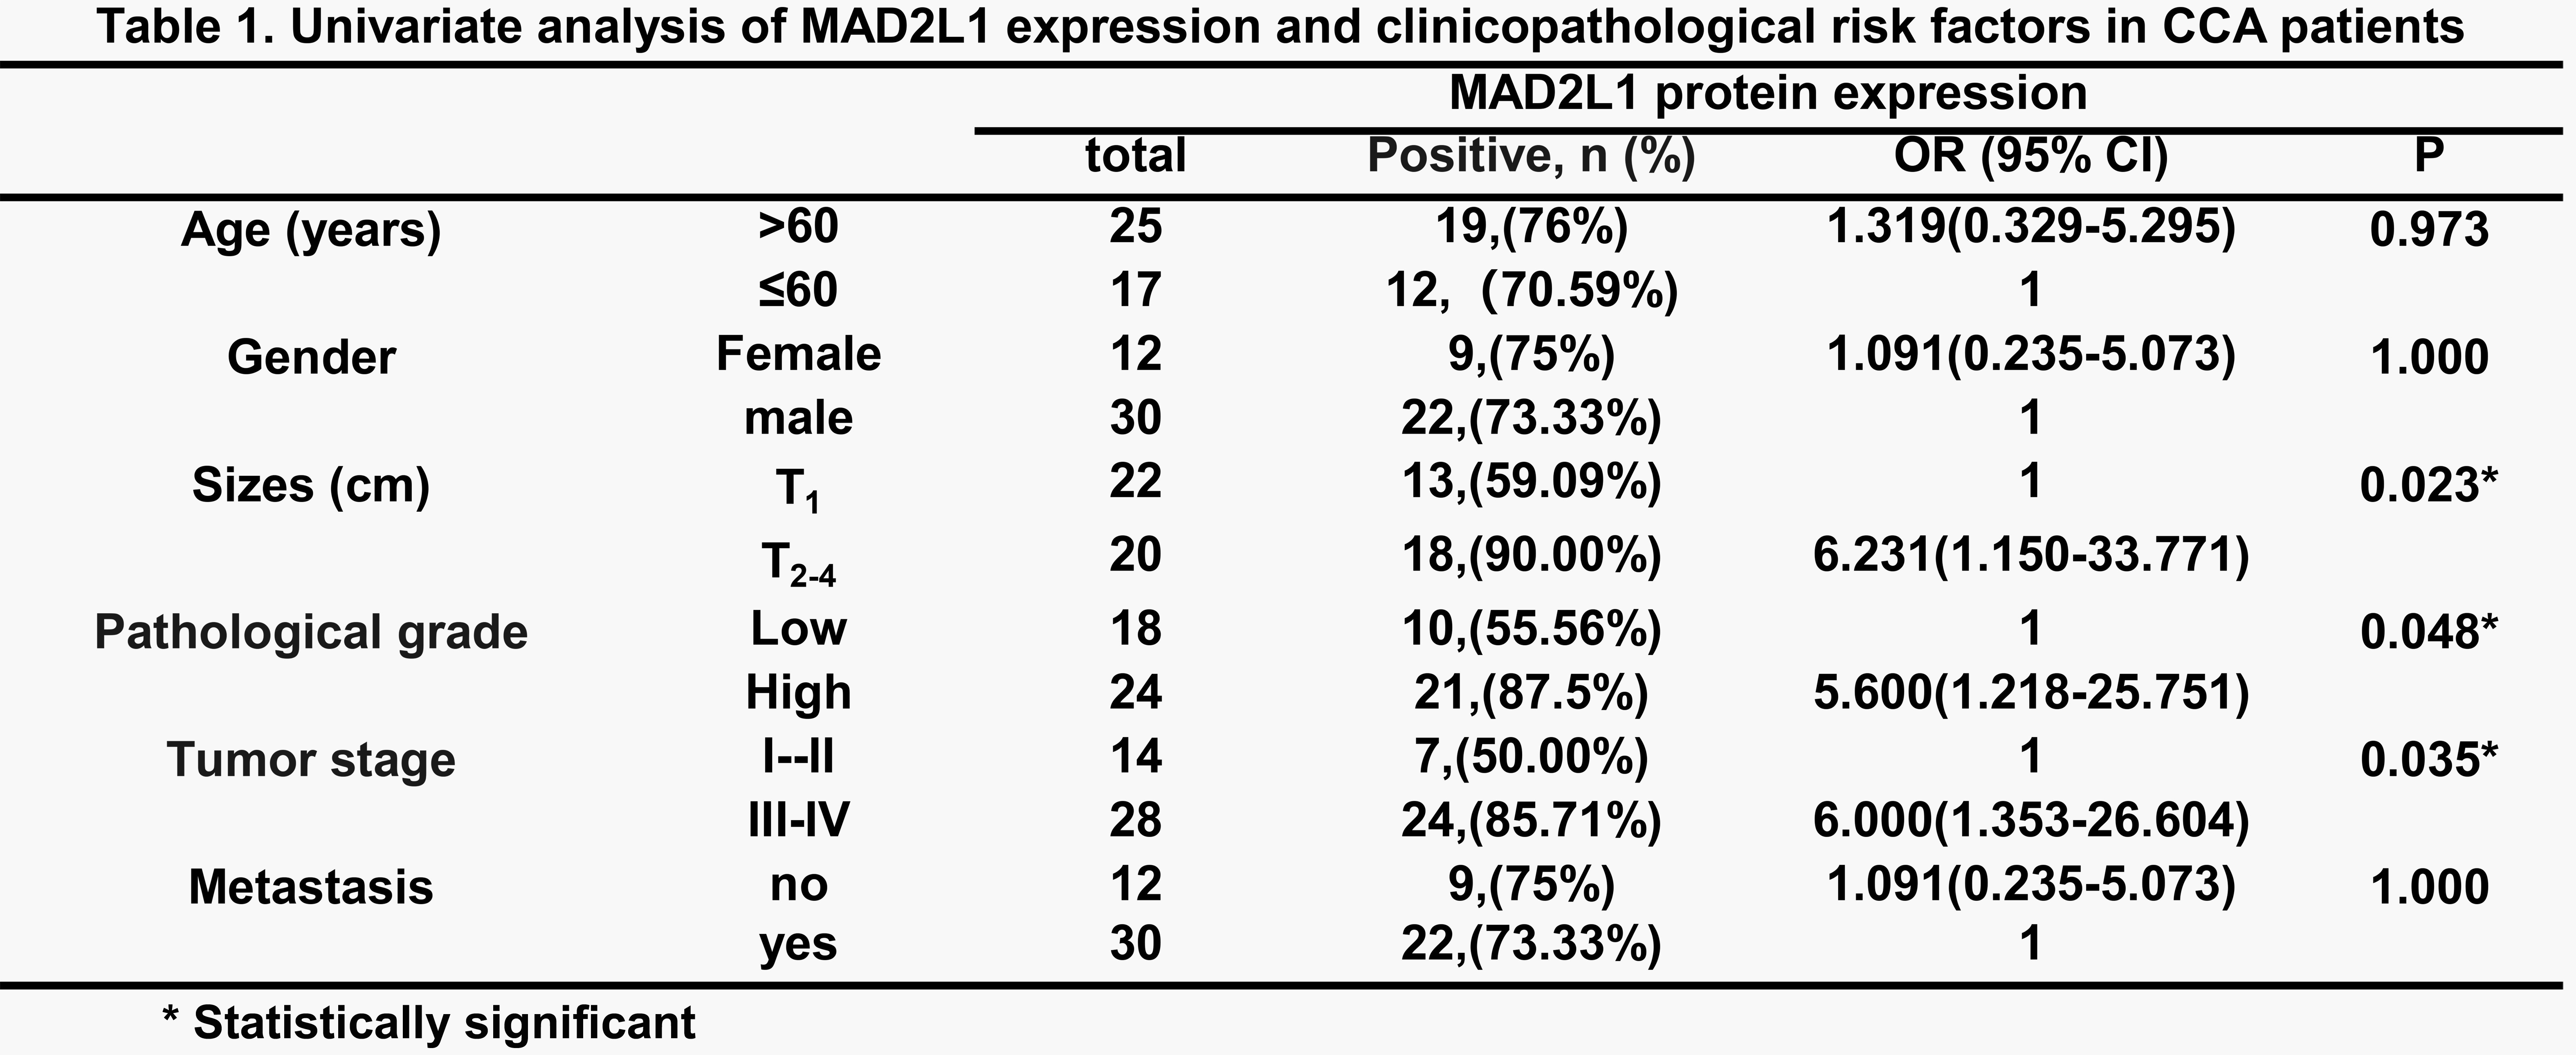
Patient selection. Forty-two surgically resected primary CCAs were collected from 2004 to 2014 at our institute. The study was approved by the ethics committee and conducted following the regulations. All patients signed informed consent for the use of their CCA samples and clinical information. This study was also performed according to the ethical guidelines of the Declaration of Helsinki 2008 [23]. The specimens were anonymized and analyzed in a blinded fashion. Follow-up time for survivors ranged from 1 to 36 months (median, 15.3 months). All 42 patients were followed up for at least one year after surgery.
Histology and Immunohistochemistry. Formalin-fixed and paraffin-embedded tissue slides (5 μm) were deparaffinized and rehydrated. Antigen retrieval was performed by incubating the tissue slides in 0.01 M citric acid buffer at 100°C for 10 minutes. After blocking with 3% H2O2 and 5% fetal bovine serum, the slides were incubated with a monoclonal antibody against MAD2L1 (1:100, ab10691; Abcam, Burlingame, CA) at 4°C overnight. The slides were then reacted with polymer–horseradish peroxidase reagent. The peroxidase activity was visualized with diaminobenzidine tetrahydroxychloride solution. The sections were counterstained with hematoxylin. Dark brown cytoplasmic staining of at least 1% tumor cells was defined as positive, and no staining or less than 1% cells stained was defined as negative. As a negative control, we replaced the primary antibody with 5% fetal bovine serum.
Cell culture. All CCA cell lines, QBC939 was donated by Dr. Li lab [24], HuCCT1 cells were purchased from the Japanese Collection of Research Bioresources Cell Bank, and HEK293T cell lines were obtained from the American Type Culture Collection. Cells were maintained in Dulbecco's modified Eagle's medium (Invitrogen; Thermo Fisher Scientific Inc.) supplemented with 10% fetal bovine serum (Thermo Fisher Scientific, Inc.), 1% glutamine, and 1% penicillin/streptomycin (Invitrogen; Thermo Fisher Scientific, Inc.). Cells were humidified in a 5% (v/v) CO2 environment at 37˚C. Tests for mycoplasma contamination yielded negative results by direct PCR.
Cell count. Trypan blue dye exclusion test by staining cells with 0.2% Trypan blue solution (Sigma-Aldrich Chemical Co, MO, USA) was performed to reveal necrotic cells after each experimental condition, according to the manufacturer’s instructions. Moreover, unstained viable cells were manually counted using a hemocytometer. Counts were performed by triplicate under a 10X objective according to standard methodology. All measurements were performed in triplicate.
Animal experiments. Eight 6-week-old nude mice were purchased from the National cancer institute (NCI) and divided into two groups for injection of QBC939 cells transfected/engineered with (1) shNC, (2) shMAD2L1. The prepared stable QBC939 cells (mixed with Matrigel, 1:1) were injected at 1 × 10⁶ into the Subcutaneous tissue of the mice. The mice were sacrificed after 8 weeks. Tumors were removed for study. Animal protocols were approved by the Animal Care and Use Committee of Nanjing medical university. And all animal experiments followed guidelines for ethical review of laboratory animal welfare of Nanjing medical university (http://iacuc.njmu.edu.cn).
Lentiviral expression plasmids and virus infection. The lentivirus system with the standard calcium chloride transfection method was applied to generate the virus. pWPI vectors over-expressing MAD2L1 and pLKO.1 vectors expressing short hairpin RNA (shRNA) were used to generate lentivirus to infect CCA cells, respectively. The pWPI/pWPI-MAD2L1/pLKO.1/pLKO.1-shMAD2L1#1/pLKO.1-shMAD2L1#2 plasmids (MilliporeSigma, MA, US), pMD2G (addgene,#12259)envelope plasmid, and psPAX2 (addgene, #12260) packaging plasmid were co-transfected into the HEK293T cells. After 8 h, the medium was changed with a warm, fresh medium. The 293 cells (Human Embryonic Kidney 293 cells) were then placed in the virus room incubator for the generation of the virus. After 48 h, the supernatants, including the viruses, were harvested and used immediately or frozen at -80˚C for later use. The The sequences were as follows: shMAD2L1#1 targeting sequence, 5'- CCTATTGAATCAGTTTCCAAT-3'; and shMAD2L1#2 targeting sequence, 5'- CGAGTTCTTCTCATTCGGCAT-3'.
Western Bolt. Freshly frozen tissues were isolated and lysed in RIPA buffer, and proteins (30-50 μg) were separated on 6–10% SDS/PAGE gel and then transferred onto PVDF membranes (Millipore, Billerica, MA). After blocking with 5% BSA, the PVDF membranes were incubated with primary antibodies and then HRP-conjugated secondary antibodies. Subsequently, The ECL system (Thermo Fisher Scientific, Rochester, NY) was used to visualize. The primary antibodies used for western blot were, MAD2L1 (1:1000; Abcam), GAPDH (1:5000; Santa Cruz Biotechnology, Santa Cruz, CA).
Real-time polymerase chain reaction (PCR). Fresh samples were used to analyze the mRNA level of MAD2L1 by real-time polymerase chain reaction (PCR) performed with the ABI StepOnePlus PCR System (Applied Biosystems, Foster City, CA). Total RNA was extracted using TRIZOL reagent, and all primers were purchased from Invitrogen (Invitrogen, Carlsbad, CA). MAD2L1 mRNA was normalized with the GAPDH mRNA level, and results were presented as the ratio of MAD2L1 to GAPDH. The primers were as follows: MAD2L1 forward primer, 5′- ACGGTGACATTTCTGCCACT-3′; MAD2L1 reverse primer, 5′- TGGTCCCGACTCTTCCCATT-3′; GAPDH forward primer, 5′-GGAGCGAGATCCCTCCAAAAT-3′, GAPDH reverse primer, 5′-GGCTGTTGTCATACTTCTCATGG-3′.
Statistics. Statistical analysis was performed using SPSS software, version 23.0 (IBM Inc.). Mann‑Whitney U test was applied to test the two groups of continuous data. Correlation between MAD2L1 expression and clinicopathological parameters was evaluated by the χ2 test and Fisher exact test. Survival rates were calculated using the unadjusted Kaplan-Meier method, and the log-rank analysis analyzed the difference in survival curves. All cell experiments were conducted in three technical replicates. Quantitation results are shown as mean ± SD. Statistical significance for cell experiments was determined using the independent‑sample t‑test. P<0.05 was considered to indicate a statistically significant difference.