Baseline Characteristics
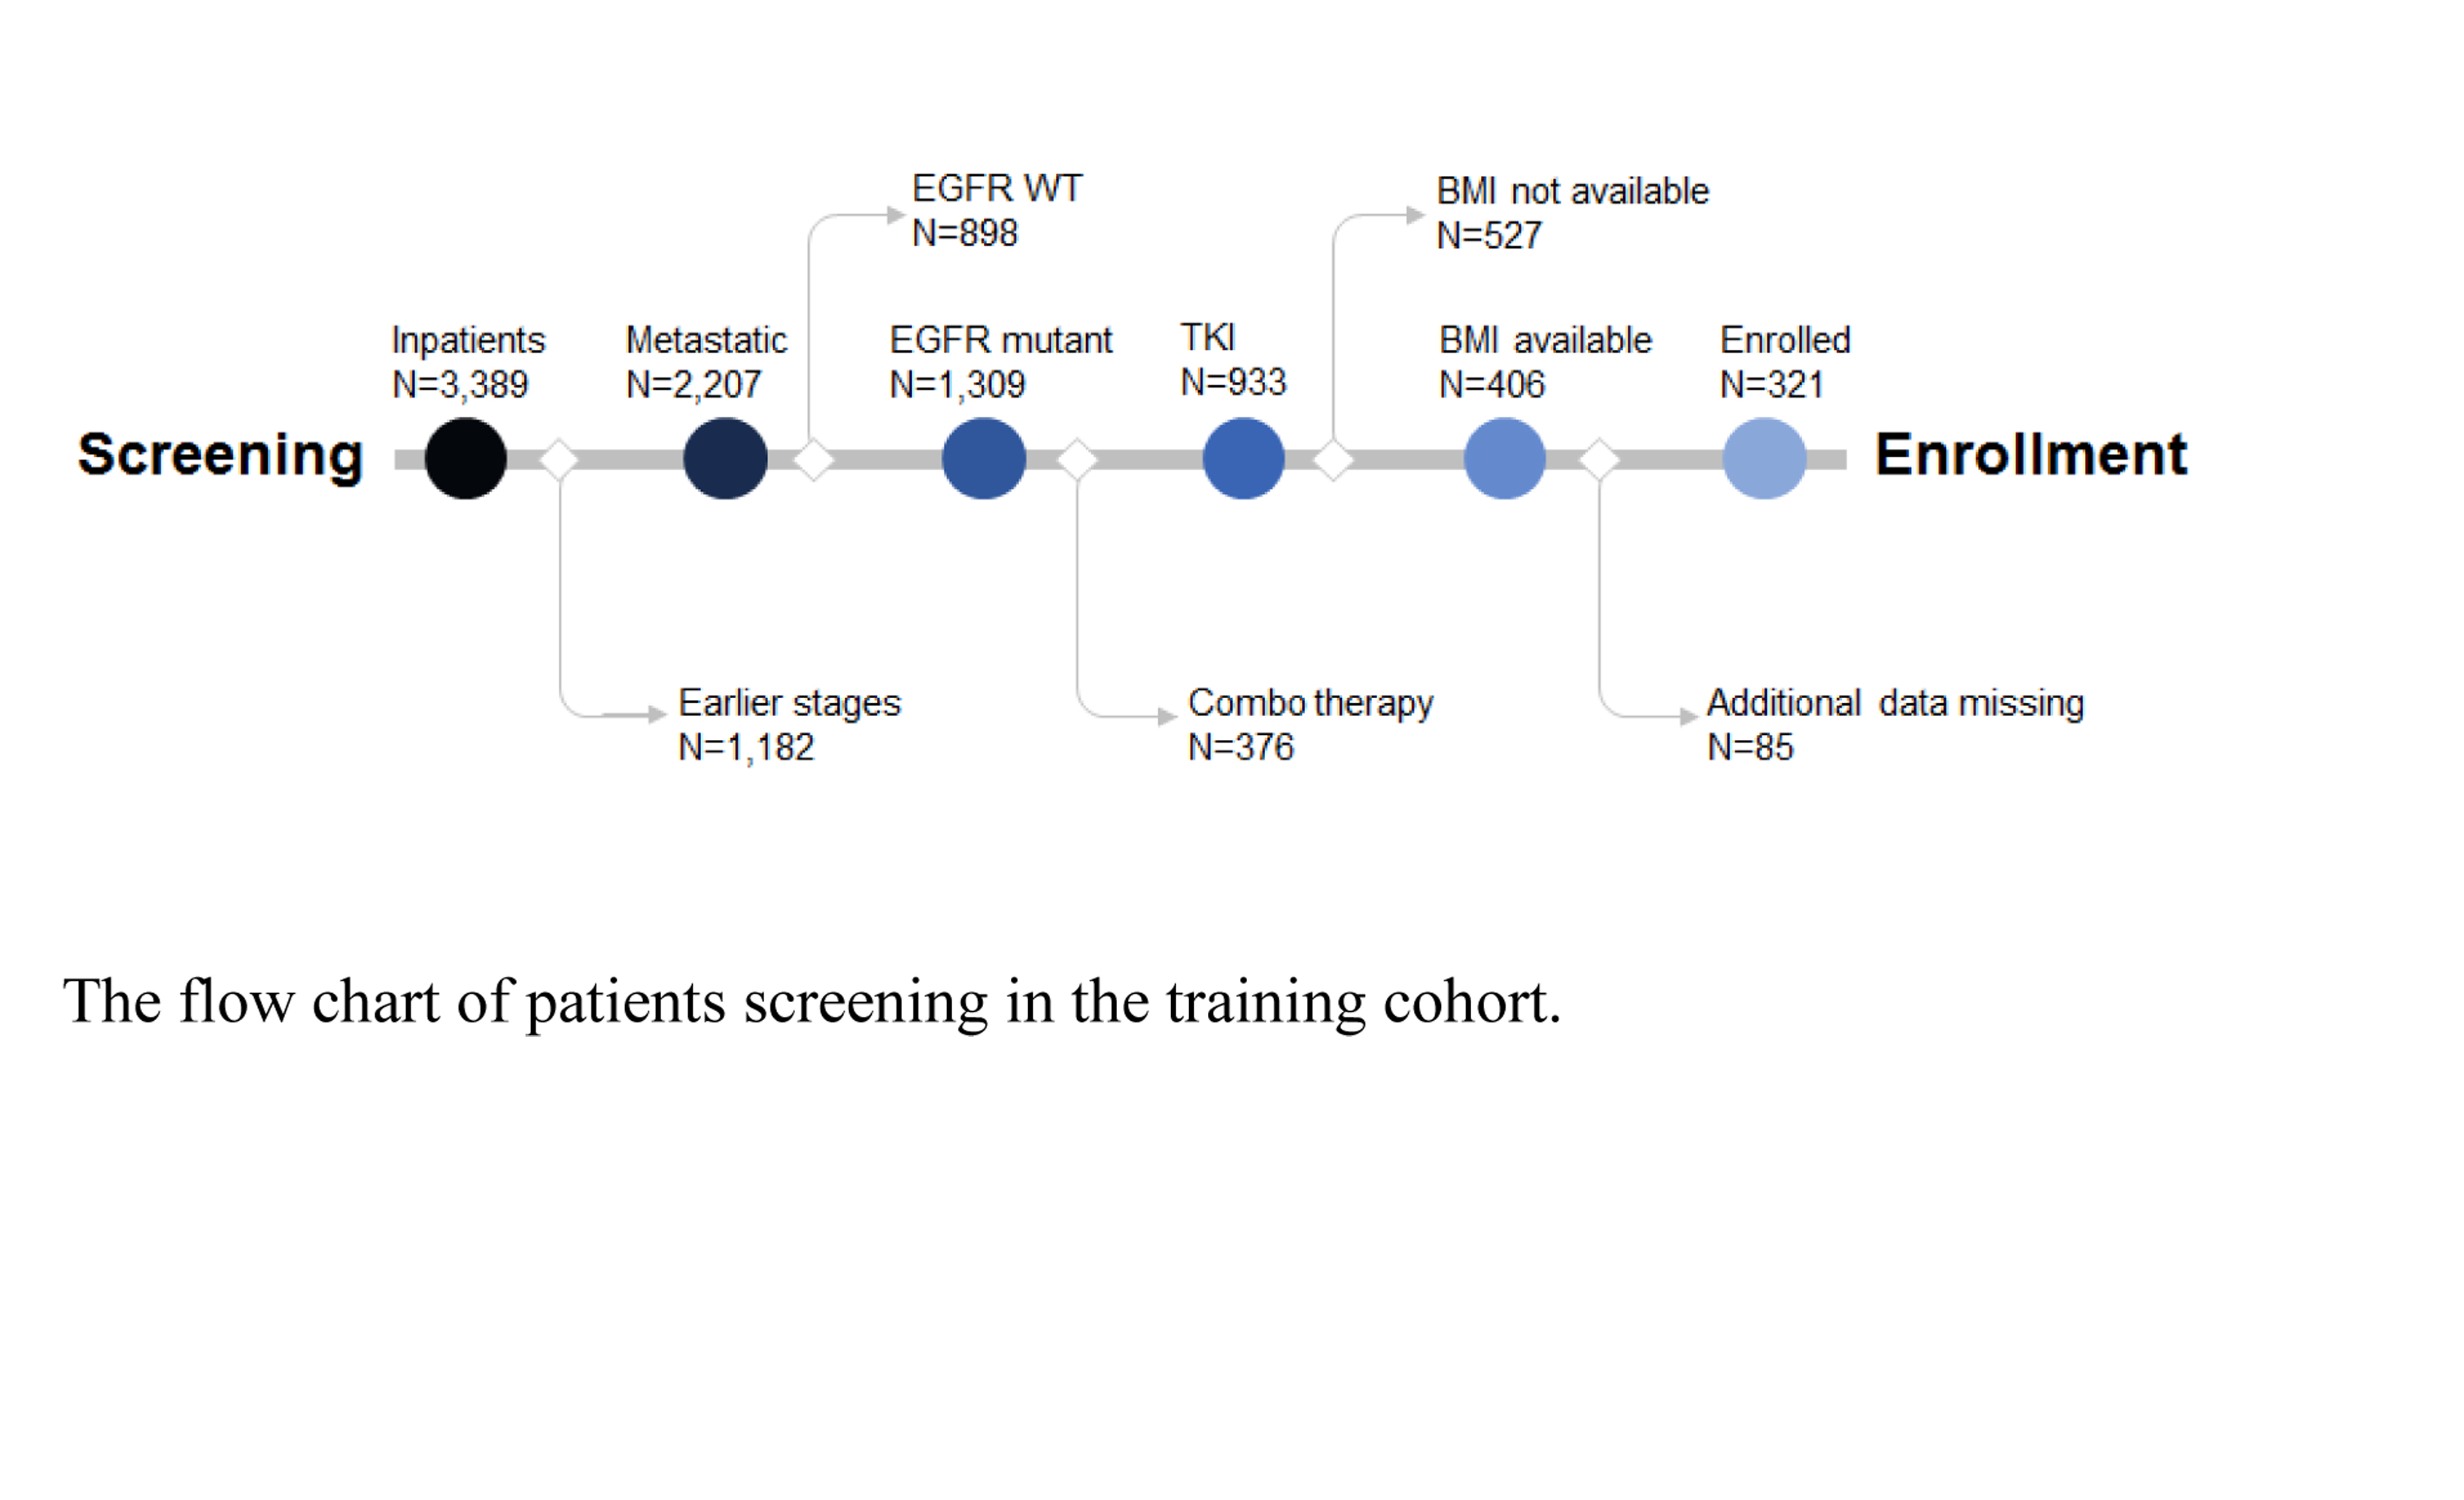
In the training cohort, totally 3,389 patients were screened. Those in the early stage (stage I-III, n=1,182), with wild-type EGFR (n=898), receiving combo therapy with chemotherapy (n=273), absence of BMI data (n=527), and for other reasons (mainly due to lost in follow-up, n=85) were excluded in a step-forward fashion (supplementary Fig S1). In the enrolled patient cohort (n=321), till the time of preparing this manuscript, 296 patients (92.2%) progressed, and 199 patients (70.3%) died. Similarly, 108 patients were screened out from 931 patients in the validation cohort. The demographic features of the enrolled patients were summarized in supplementary Table S1. Because of the high ORR achieved by TKI treatment, further stratification was difficult. Also, due to the confounding factors from later lines of therapy on OS, PFS was chosen as a primary index for the analysis of TKI efficiency.
BMI and PFS
To explore the possible relationship between BMI and PFS, a linear regression was performed. Pearson co-efficiency between BMI and PFS was 0.161 (p=0.04), which suggested a possible correlation between them. The patients in the training cohort were grouped according to their BMI by different criteria. The optimized cut-off value of 22.5 was calculated by Youden index from the ROC curve, with an area under curve of 0.63. Patients with BMI≥22.5 achieved a longer PFS (13.8 mon) compared with their counterparts (10.9 mon, p=0.001, HR=0.68 , Fig 1A). Also, patients were grouped per median BMI (22.8). Again, the PFS of the patients with higher BMI (13.8 mon) was longer than that of lower BMI group (10.9 mon, p=0.003, HR=0.71, Fig 1B). Subsequently, patients were dichotomized by different combinations (combination 1: 22.9, or combination 2: 25.0). And patients with higher BMI consistently showed superior PFS over their counterparts with lower BMI (Fig 1C, D). In addition, patients were well balanced in either of these dichotomization groups (Table 1). These data strongly supported that the therapeutic effects of EGFR-TKI was influenced by the patients’ BMI, irrespective of BMI classification criteria.
Table 1: The demographic features of variant BMI in training group
|
Characteristic
|
Optimized
|
Median
|
combination 1
|
combination 2
|
|
<22.5
|
≥22.5
|
<22.8
|
≥22.8
|
<22.9
|
≥22.9
|
<25.0
|
≥25.0
|
|
N (%)
|
151(47.0%)
|
170(53.0%)
|
162(50.5%)
|
159(49.5%)
|
165 (51.4%)
|
156(48.6%)
|
247(76.9%)
|
74(23.1%)
|
|
Gender
|
|
|
|
|
|
|
|
|
|
Female
|
88(47.6%)
|
97(52.4%)
|
94(50.8%)
|
91(49.2%)
|
97(52.4%)
|
88(47.6%)
|
145(78.4%)
|
40(21.6%)
|
|
Male
|
63(46.3%)
|
73(53.7%)
|
68(50.0%)
|
68(50.0%)
|
68(50.0%)
|
68(50.0%)
|
102(75.0%)
|
34(25.0%)
|
|
Age group
|
|
|
|
|
|
|
|
|
|
<60 year
|
79(43.6%)
|
102(56.4%)
|
83(45.9%)
|
98(54.1%)
|
86(47.5%)
|
95(52.5%)
|
136(75.1%)
|
45(24.9%)
|
|
≥60 year
|
72(51.4%)
|
68(48.6%)
|
79(56.4%)
|
61(43.6%)
|
79(56.4%)
|
61(43.6%)
|
111(79.3%)
|
29(20.7%)
|
|
Smoking history
|
|
|
|
|
|
|
|
|
|
Yes
|
39(44.8%)
|
48(55.2%)
|
42(48.3%)
|
45(51.7%)
|
42(48.3%)
|
45(51.7%)
|
68(78.2%)
|
19(21.8%)
|
|
No
|
112(%47.9)
|
122(%52.1)
|
120(51.3%)
|
114(48.7%)
|
123(52.6%)
|
111(47.4%)
|
179(76.5%)
|
55(%23.5)
|
|
ECOG
|
|
|
|
|
|
|
|
|
|
0
|
78(42.6%)
|
105(57.4%)
|
84(45.9%)
|
99(54.1%)
|
86(47.0%)
|
97(53.0%)
|
133(72.7%)
|
50(%27.3)
|
|
≥1
|
73(52.9%)
|
65(47.1%)
|
78(56.5%)
|
60(43.5%)
|
79(57.2%)
|
59(42.8%)
|
114(82.6%)
|
24(17.4%)
|
|
ALB(g/L)
|
|
|
|
|
|
|
|
|
|
ALB≤LLN-
|
67(53.2%)
|
59(46.8%)
|
69(54.8%)
|
57(45.2%)
|
70(55.6%)
|
56(44.4%)
|
102(81.0%)
|
24(19.0%)
|
|
ALB>LLN-
|
84(43.1%)
|
111(56.9%)
|
93(47.7%)
|
102(52.3%)
|
95(%48.7)
|
100(51.3%)
|
145(74.4%)
|
50(25.6%)
|
|
Histological type
|
|
|
|
|
|
|
|
|
|
Adenocarcinoma
|
143(46.7%)
|
163(53.3%)
|
153(50.0%)
|
153(50.0%)
|
156(51.0%)
|
150(49.0%)
|
234(76.5%)
|
72(23.5%)
|
|
Non-adenocarcinoma
|
8(53.3%)
|
7(46.7%)
|
9(60.0%)
|
6(40.0%)
|
9(60.0%)
|
6(40.0%)
|
13(86.7%)
|
2(13.3%)
|
|
EGFR mutation
|
|
|
|
|
|
|
|
|
|
Exon 19 deletion
|
67(42.9%)
|
89(57.1%)
|
74(47.4%)
|
82(52.6%)
|
75(48.1%)
|
81(51.9%)
|
115(73.7%)
|
41(26.3%)
|
|
L858R mutation
|
68(54.4%)
|
57(45.6%)
|
69(55.2%)
|
56(44.8%)
|
69(55.2%)
|
56(44.8%)
|
100(80.0%)
|
25(20.0%)
|
|
Other
|
16(40.0%)
|
24(60.0%)
|
19(47.5%)
|
21(52.5%)
|
21(52.5%)
|
19(47.5%)
|
32(80.0%)
|
8(20.0%)
|
The influence of BMI was maintained in the validation cohort. In this cohort, the median PFS was 12.7 mon (95%CI: 10.0-15.4 mon) and the optimized cut-off value of BMI was 22.1 per ROC analysis. The optimized cut-off values in the training cohort (22.5) and validation cohort (22.1) were similar per se. Therefore, a fixed optimized cut-off value (22.5) was adopted, and all the following analysis of high or low BMI group was based on this value. In the validation cohort, patients with BMI≥22.5 had improved PFS (14.0 mon) over their counterparts (11.6 mon, p=0.089,
HR=0.67, Fig 1E). The difference was not statistically significant, most possibly due to insufficient sample size. When combining the training and validation cohorts together, the improved PFS of higher BMI was re-confirmed in the whole cohort (13.7 mon and 11.3 mon, p=0.004, HR=0.74, Fig 1F). Of notice, in the whole cohort, besides the optimized cut-off value, other criteria could be used to group the patients with longer or poorer PFS (data not shown).
Subgroup Analysis
Subgroup analysis of the training cohort indicated that factors, including age, sex, baseline serum albumin (ALB), and performance status (PS) all influenced PFS (Fig 2A). Interestingly, the improved PFS associated with higher BMI was restricted in male (12.0 and 9.1 mon, HR 0.45, 95% CI: 0.31-0.65, P<0.0001, Fig 2B), but not in female (14.3 and 12.3 mon, HR 0.89, 95% CI: 0.66-1.2, p=0.47, Fig 2C). Furthermore, this discrepancy remained, independent of cut-off values of BMI (data not shown).
Multivariate Cox Regression Analysis
Multivariate analysis indicated that factors, including age, gender, ALB, PS score and BMI, influenced PFS independently (Fig 3). BMI, together with other factors, was proved to be independent factors (P=0.001).
Nomogram Establishment and Validation
PS score, ALB, gender, age, smoking history and BMI were found to be independent predictors of PFS in the training cohort. By integration of these factors, a nomogram was established to predict to 1-,or 3-year PFS (Fig 4A). Both internal and external validation were performed to test the nomogram algorithm. This algorithm was found to fit well in both the internal validation (training cohort, C-index=0.568, Fig 4B and 4C) and external validation (whole cohort, n=429, C-index=0.559, Fig 4D and 4E).
ORR and OS
An ORR of 71% was achieved in the training cohort (Fig 5A). Independent on the BMI dichotomy criteria, higher BMI was always associated with better response (Fig 5B). However, the difference didn’t meet statistical significance. OS was 36.7 months (95% CI: 33.3-40.1 mon) in the training group. A longer OS was achieved in the high BMI group (41.4 mon) compared to the low BMI group (33.5 mon, HR 0.70, 95%CI: 0.53-0.92, P = 0.011, Fig 5C). And patients with higher BMI consistently showed superior OS over their counterparts with lower BMI (data not shown).