2.1 Materials and Reagents
IR780 iodide, 3BP, and 2’,7’-dichlorofluorescin diacetate (DCFH-DA) were purchased from Sigma-Aldrich (St. Louis, MO, USA). PLGA-PEG-3.4k was purchased from Xi’an Ruixi Biological Technology Co., Ltd (Xi’an, China). Cell-Counting Kit-8 (CCK-8), calcein AM, and pyridine iodide (PI) were obtained from Daigang Biological Engineering Ltd., Co. (Jinan, China). Dichloromethane (CHCl2) was purchased from Chuandong Chemical Co. Ltd (Chongqing, China). Nuclear dye 4,6-Diamidino-2-phenylindole (DAPI), enhanced ATP assay kit and 1,1'-dioctadecyl-3,3,3',3'-tetramethylindocarbocyanine perchlorate (DiI) were purchased from Beyotime Biotechnology (Shanghai, China). Singlet Oxygen Sensor Green (SOSG) and MitoTracker® Deep Red FM were purchased from Thermo Fisher Scientific (Invitrogen). All other reagents were of or above analytical grade and used as received without further purification.
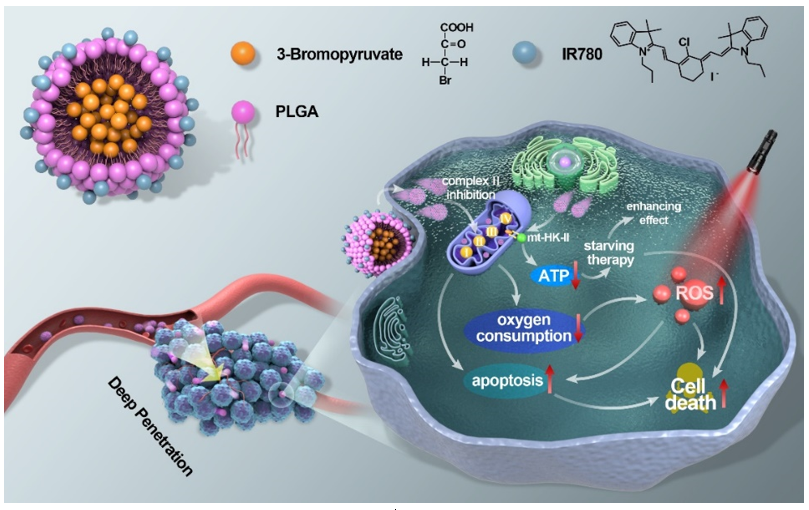
2.2 Synthesis of 3BP@PLGA-IR780
3BP@PLGA-IR780 were synthesized via a water-oil-water double emulsion protocol [52]. Briefly, 50 mg of PLGA and 1 mg of IR780 were dissolved in 2 mL of dichloromethane (CHCl2), and 3BP (50 mg) dissolved in PBS (200 µL) was added to the above solution. The polymeric solution was emulsified with an ultrasonic processor (Sonics & Materials Inc., Danbury, CT, USA) operating at a power intensity of 100 W for 3 min (on 5 s, off 5 s). Then, 9 mL of polyvinyl acetate (PVA) solution was added into the formed emulsion. Then, the emulsion was further subjected to a probe sonication (50 W, on 5 s, off 5 s). Finally, 10 mL of isopropyl alcohol was added to the above solution, and the mixture was stirred mechanically to evaporate the CHCl2 completely. The fabricated 3BP@PLGA-IR780 nanoplatforms were collected and stored at 4 oC for further use. The same procedure was made to other nanoplatforms, but differentiating the drug.
2.3 Characterizations of 3BP@PLGA-IR780
The morphology of 3BP@PLGA-IR780 was observed by transmission electron microscopic (TEM) (Hitachi H-7600, Japan) and scanning electron microscopic (SEM) (JEOL JSM-7800F, Japan). A laser particle size analyzer system (Nano, ZS90, Malvern instrument Ltd) was used to determine the size distribution and surface zeta potential of 3BP@PLGA-IR780. UV-vis–NIR absorption spectra of IR780 at different concentrations (0.125, 0.25, 0.5, 1.0, 2.0, 3.0, 4.0, and 5.0 µg/mL), and 3BP at different concentrations (0.1, 0.2, 0.4, 0.6, 0.8 and 1.0 mg/mL) were recorded using the SpectraMax Paradigm Multi-Mode Microplate Reader (Molecular Devices). The Drug Loaded Efficiency (LE) was then calculated by the following equation.
Drug Loaded Efficiency = (Initial Weight of Drug – unloaded Drug) / Initial weight of Drug
2.4 Cell Culture and 4T1 Tumor-Bearing Mice Model
Murine breast cancer line 4T1 cells were obtained from Shanghai Zhongqiaoxinzhou Biotechnology Co., Ltd (Shanghai, China). All-female BALB/c nude mice and Kunming mice were aged 4–6 weeks were purchased from Chongqing Medical University. All the experiments and procedures were performed under guidelines approved by the Institutional Animal Care and Use Committee of Chongqing Medical University. To establish 4T1 tumor-bearing mice models, 1 × 10⁶ 4T1 cells were suspended in 100 µL serum-free medium, which was then injected subcutaneously to the flanks of the nude mice.
2.5 Intracellular Uptake and Mitochondria Location of 3BP@PLGA-IR780
The intracellular uptake of 3BP@PLGA-IR780 in 4T1 cells was detected by confocal laser scanning microscope (CLSM) (Nikon A1, Japan) and flow cytometry (CytoFLEX, USA). Briefly, 4T1 cells were seeded in a CLSM-specific dish at a density of 1 × 10⁵ cells per well. After 24 h of incubation, the culture medium was replaced with a serum-free medium containing DiI labeled 3BP@PLGA or 3BP@PLGA-IR780. After different intervals of incubation (0.5 h, 1 h, 2 h, and 4 h), the cells were washed with PBS three times, fixed with 4% polyformaldehyde, and stained with DAPI. Then, the cells were observed by CLSM. Additionally, the quantitative analysis of intracellular uptake was further analyzed with flow cytometry. After 4 h of incubation with DiI-labeled 3BP@PLGA-IR780 or 3BP@PLGA, 4T1 cells were sequentially stained with MitoTracker®Deep Red FM for another 30 min. Then the cells were rinsed with PBS and observed with CLSM.
2.6 Mitochondrial Membrane Potential and ATP Measurement
Mitochondrial membrane potential was analyzed with JC-1. 4T1 cells were cultured in confocal cell-culture dishes as mentioned above. 3BPA@PLGA-IR780 and 3BP@PLGA were added in culture media (PLGA = 200 µg/mL), and the cells were further incubated for 24 h. The mitochondria were then stained with JC-1 for another 20 min. Cells were washed twice with PBS prior to CLSM imaging. Cellular ATP levels were detected with an Enhanced ATP Assay Kit performed according to the standard protocol.
2.7 Dissolved Oxygen Measurement
4T1 cells were seeded in 12-well plate (1.2 × 10⁵/well) and incubate overnight. These cells were treated with corresponding concentrations of drugs, and then 1mL of liquid paraffin oil was added to each well. After incubating for 4 h in a 37°C incubator, the oxygen content in the culture medium was measured with a dissolved oxygen meter (Mettler Toledo, Switzerland).
2.8 Intracellular ROS Generation and In Vitro Cytotoxicity of 3BP@PLGA-IR780
For the detection of intracellular ROS, pre-cultured 4T1 cancer cells were incubated with 3BP@PLGA-IR780 or 3BP@PLGA for 4 h (PLGA = 200 µg/mL). Subsequently, these cells were incubated with ROS probe DCFH-DA solution, followed by CLSM observation. In addition, the fluorescence intensities of each group were measured by flow cytometry.
To test the therapeutic effects of 3BP@PLGA-IR780, 4T1 cells were seeded in a 96-well plate (1 × 10⁴ cells per well) and incubated for 24 h. Then, these 4T1 cells were subjected to following treatments: (i) control (PBS), (ii) Laser only (1.0 W/cm2, 5 min), (iii) 3BP@PLGA, (iv) 3BP@PLGA-IR780, (v) PLGA-IR780 + Laser (1.0 W/cm2, 5 min), and (vi) 3BP@PLGA-IR780 + Laser (1.0 W/cm2, 5 min). The corresponding PLGA concentrations were 200 µg/mL. All PDT treatments were conducted in ice-bath to cool down to exclude the photothermal effect. Finally, the cell viabilities were evaluated using a standard CCK-8 kit. Besides, flow cytometry was also employed to analyze cell apoptosis induced by different treatments. To discriminate live and dead cells, the treated cells were costained with calcein-AM and PI for the CLSM observation. The red fluorescence represents dead cells, while green fluorescence means alive cells.
2.9 In Vivo Biodistribution (FL Imaging) of 3BP@PLGA-IR780
For the detection of in vivo biodistribution of 3BP@PLGA-IR780, mice bearing 4T1 tumors were intravenously injected with 3BPA@PLGA-IR780 saline solution (200 µL, the corresponding PLGA concentration was 10 mg/mL), in vivo FL imaging at varied time points was acquired with a Living Imaging System. 24 h after injection, mice were sacrificed to collect the tumor tissue and major organs for frozen section examination.
2.10 Deep Penetration of 3BP@PLGA-IR780
The deep penetration capability of 3BP@PLGA-IR780 was evaluated in 3D tumor spheroid models. To establish the 3D tumor models, 4T1 cells (5 × 10⁴) were seeded in spheroid microplates for 7 days. The established 3D spheroids were treated with DiI-labeled 3BP@PLGA-IR780 or 3BP@PLGA. After co-culturing for 12 h, the tumor spheroids were rinsed twice with PBS and then analyzed by CLSM.
For the evaluation of in vivo penetration, 4T1 tumor-bearing mice were treated with DiI-labeled 3BP@PLGA-IR780 or 3BP@PLGA, and the transplanted tumors were harvested 24 h post-injection. The tumor masses were sliced and scanned by tomography. In addition, some tumor nodules were dissected for frozen-section examination, and the anti-CD31 antibody was used to stain blood vessels for CLSM observation.
2.11 PA Imaging of 3BP@PLGA-IR780
To investigate the performance of 3BP@PLGA-IR780 as a PA contrast agent, both in vitro and in vivo experiments were conducted on a Vevo LAZR System (Visual Sonics Inc., Canada). Firstly, 3BP@PLGA-IR780 suspension was stimulated by a PA laser with excitation wavelength ranging from 680 nm to 970 nm. Then, PA values of different concentrations of 3BP@PLGA-IR780 (the corresponding IR780 concentrations were 10, 20, 30, 40, 50 µg/mL) were measured, and corresponding PA images were attained. To evaluate the in vivo PA performance of 3BP@PLGA-IR780, 4T1 tumor-bearing mice were intravenously injected with 3BP@PLGA-IR780 solution. The tumor PA images were collected at different time points (0, 1, 2, 4, 6, 24, and 48 h).
2.12 Detection of Tumor Hypoxia Status
To detect the hypoxia status of the 4T1 tumor, tumor-bearing mice were randomly divided into three groups and injected with saline, 3BP@PLGA, and 3BP@PLGA-IR780, respectively. At 24 h post-injection, the tumor masses were collected and sliced for the detection of HIF-1α expression. Meanwhile, the oxygenated hemoglobin level of tumors of each group were monitored by a PA imaging in oxy-hem mode. The average oxyhemoglobin saturation within tumors was analyzed by testing the ratio of oxygenated hemoglobin and deoxygenated hemoglobin. Furthermore, western blot analysis was operated to assess the expression of HIF-1α in tumors.
2.13 In Vivo Synergistic Tumor Therapy
To evaluate the in vivo PDT efficacy of 3BP@PLGA-IR780, thirty 4T1 tumor-bearing mice were randomly separated into five groups as follows: (i) Control (intravenous injection of saline), (ii) Laser only (1.0 W/cm2, 5 min), (iii) 3BP@PLGA (intravenous injection of 3BP@PLGA), (iv) 3BP@PLGA-IR780 (intravenous injection of 3BP@PLGA-IR780), (v) PLGA-IR780 + Laser (intravenous injection of PLGA-IR780 + laser exposure), and (vi) 3BP@PLGA-IR780 + Laser (intravenous injection of 3BP-PLGA-IR780 + laser exposure). The corresponding PLGA concentrations were 10 mg/mL and the injection volume was 200 µL.
To exclude the photothermal effect, the laser irradiation was implemented for 40 s and subsequently followed by intervals to keep the tumor temperature under 42°C. The above irradiation was repeated for 15 cycles. The tumor volumes and bodyweight of mice were monitored every other day. At the end of treatments, the tumor tissues were dissected, weighed, and photographed. The main organs (heart, liver, spleen, lung, and kidney) and the tumor tissues were harvested and fixed in a 4% paraformaldehyde solution for histopathological analysis.
2.14 Biosafety Assessment
The biosafety assessment of 3BP@PLGA-IR780 was implemented on healthy Kunming mice. The mice were intravenously injected with 3BP@PLGA-IR780 (The corresponding PLGA concentrations were 10 mg/mL and the injection volume was 200 µL), while the untreated mice were used as the control. The blood of the mice was collected at various time points (7 d, 15 d, and 30 d) for blood cell analysis and biochemical assays. Meanwhile, the major organs of the mice were collected and stained with Hematoxylin-eosin (H&E).
2.15 Statistical Analysis
All statistical analyses were performed with SPSS 20.0 software. Data were presented as mean ± standard deviation. The significance of the data is analyzed according to a Student’s t-test: *P < 0.05, **P < 0.01, ***P < 0.001.