Reagents
Cadmium chloride (CdCl2), diethylnitrosamine (DEN), and carbon tetrachloride (CCl4) were obtained from Sigma Chemical Co (St. Louis, MO). Other reagents were of analytical grade.
Animals
Male C57BL/6 mice (6 week old) were purchased from the Animal Center Institute of Surgery Research of the Third Military Medical University (Chongqing, China). Animals were maintained in the special pathogen-free (SPF)-grade facilities at Zunyi Medical University, with controlled environment (22 ± 1°C, 50 ± 2% humidity and a 12 h: 12 h light: dark cycle) and free access to purified water and standard laboratory chow. Efforts were made to ameliorate distress and harm to animals by daily monitoring and humane treatment of animals. All animal were adequately cared for, and experimental protocols were in compliance with the Animal Management Guidelines of the Chinese Ministry of Health and approved by Animal Use and Care Committee of Zunyi Medical University (2015-01). The study is reported in accordance with ARRIVE guidelines (https://arriveguidelines.org).
Experimental desin
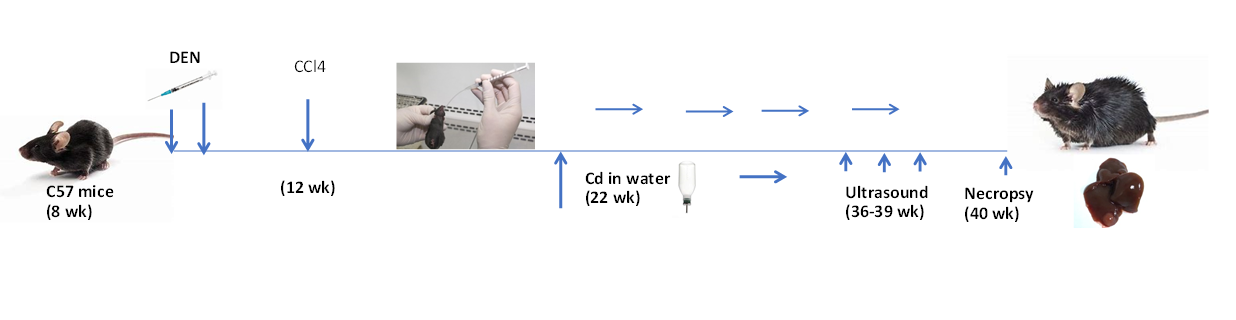
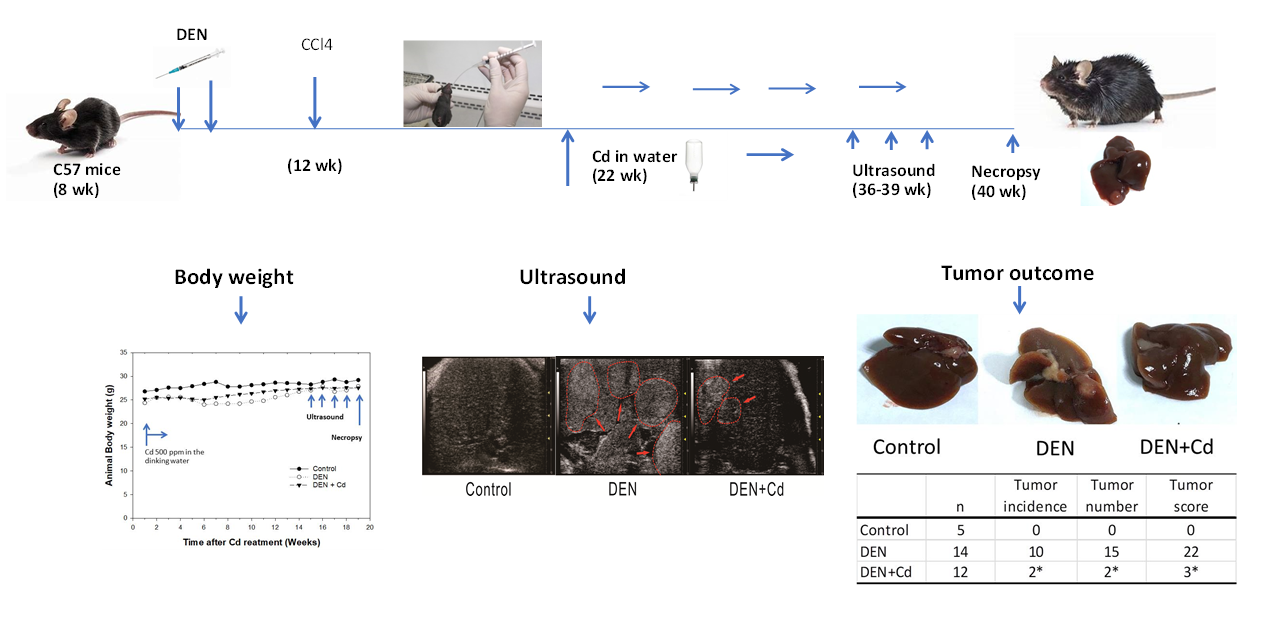
After 2 weeks of acclimation, mice (8-weeks of age) were given the first injection of diethylnitrosamine (DEN, 90 mg/kg, ip). Approximately 80% of mice survived the first DEN injection, and two weeks later, the surviving mice were given the second injection of DEN (50 mg/kg, ip), according to the protocol 22. Four weeks after initial DEN challenge (12 weeks of age), mice were given 20% CCl4, 5 mL/kg, po, twice a week in an attempt to promote liver tumors for 4 months. Twenty-one weeks after initial DEN initiation, mice were randomly divided into DEN and DEN + Cd group. Cadmium was given via the drinking water (500 ppm) as CdCl2 from 21-40 weeks according to the literature 7,8. The body weights were monitored weekly, and ultrasound examination of liver tumor formation was performed at the 35-39th weeks after DEN initiation. At the end of 40-week experiment, mice were anesthetized with sodium pentobarbital (65 mg/kg, ip), and livers were harvested. Liver weights and tumor outcomes were recorded as illustrated below.
The visible tumors were counted and recorded. The tumor incidence (number of tumor-bearing mice), tumor numbers (total tumors found), and tumor size scores (1= tumor size < 1 mm, 2 = tumor size 1-2 mm, 3= tumor size > 2 mm) were recorded.
Ultrasound detection
The liver tumor formation was measured using B-mode ultrasound (Vevo® 2100, Fujifilm VisualSonics, Canada) with 30 MHz peak frequency linear array transducers (MS400, Fujifilm VisualSonics, mean beam frequency range of 22–55 MHz) in a digitized scale 23.
Histopathology
Paraffin-embedded tumor and tumor surrounding tissues were cut into 3.5 μm sections. Hematoxylin-eosin (H&E) staining was used for morphometric measurement. The digitized images of slices were observed via the OLYMPUS image analysis system (OLYMPUS, Japan) at 10× and 40× magnification 24.
Immunohistochemical analysis
After removing endogenous peroxidase with 3% hydrogen peroxide, sections were subjected to citric acid antigen retrieval. Sections were blocked with goat serum or rabbit serum, and then incubated with metallothionein-1 (MT-1, 1:100) primary antibody (Abcam, Cambridge, MA) overnight at 4 °C, followed by the instructions of SABC Detection System. Finally, sections were stained with DAB and counterstained with hematoxylin. The digitized images of slices were observed via the LEICA image analysis system at 40× magnification. The expression of proteins was quantitatively measured by Image ProPlus 6.0 to get the positive staining-integral optical density/area (IOD/area, density mean). 4 discontinuous areas were used to analyze the expression of proteins in blinded fashion 24.
Quantitative real-time RT-PCR
Total RNA was extracted with Trizol (Takara, Dalian, China) and reverse transcribed to cDNA using PrimeScript™ RT reagent kit (Takara, Dalian, China). RT-qPCR was performed utilizing iQ™ SYBR Green Supermix (Bio-Rad, USA). The PCR cycling conditions were 94 °C for 3 min and 40 cycles of (94 °C for 15 s, 60 °C for 20 s and 72 °C for 40 s). Data were normalized to β-actin and expressed by the comparative Ct method 23. Primers for amplifying mouse genes were shown in Table 1.
Table 1
Primer sequence for RT-qPCR
|
Name
|
Access
|
Forward
|
Reverse
|
|
AFP
|
NM_007423
|
AGCAGGACTGCTCGAAACAT
|
AGCGAAATGTAGCAGGAGGA
|
|
β-actin
|
NM_007393
|
GATCTGGCACCACACCTTCT
|
GGGGTGTTGAAGGTCTCAAA
|
|
MT-2
|
NM_008630
|
CCGATCTCTCGTCGATCTTC
|
AGGAGCAGCAGCTTTTCTTG
|
|
TNF-α
|
NM_013693
|
TAGCCAGGAGGGAGAACAGA
|
TTTTCTGGAGGGAGATGTGG
|
Statistical analysis
Data were presented as mean ± SE and analyzed by one-way ANOVA, followed by Ducan's multiple comparison test with SigmaPlot version 14 (San Jose, CA). p < 0.05 was considered statistically significant.