Constructs & Reagents.
The following antibodies were purchased from Abcam: ROBO1(C-terminal) (ab7279), SLIT2(ab134166), ROBO2(ab75014), ROBO3(ab77216), TIMP1 (ab109125), LOX (ab174316), MIF (ab7027), SAA1/2 (ab199030), CD163 (ab182422), CD68 (ab955), CD11b (ab133357), Ly-6G (ab25377), Keratin19 (Rabbit-derived) (ab52625), Keratin19 (Mouse-derived) (ab7754), P-p38(T180+Y182) (ab4822), P-MEK3(S189/T193)+P-MEK6(S207/T211) (ab4759), MEK3+MEK6 (ab200831), active Caspase 3 (ab2302), Albumin (ab207327), Donkey Anti-Goat IgG H&L (HRP) (ab6885), Rabbit IgG (ab172730). The following antibodies were purchased from Cell Signaling Technology: DAPK1(3008), active Caspase 7 (9491), active Caspase 8 (9748), JNK (9252), P-JNK (Thr183/Tyr185) (9251), ERK1/2 (4695), P-ERK1/2(T202/Y204) (4370), c-jun (9165), P-c-jun (9261), GSK3α/β (5676), P-GSK3α/β (Y216/Y279), Mouse IgG (37988). P38α MAPK antibody (orb229976) was purchased from Biorbyt. Neutralizing antibody towards Ig1-Ig2 domain of ROBO1, HAM1H6-1-8 was purchased from HuaBio. Duolink® proximity ligation assay (Olink Bioscience, DUO92007) kit and polybrene (H9268) were purchased from Sigma-Aldrich. P38α MAPK specific inhibitors VX-702 (S6005) and PH-797804 (S2726) were purchased from Selleck. Cell Counting Kit-8 (CCK-8) was purchased from Dojindo Molecular Technologies. Caspase-3/7 activity Kit (G7790), D-luciferin (P1043) and FuGENE transfection reagent were purchased from Promega. was purchased from Promega. Puromycin (A1113802) was purchased from Gibco. Lipofectamine 2000 was purchased from Invitrogen. G-Dynabeads (10004D) was purchased from Life technologis. Cell Lysis Buffer for Western and IP (P70100) was purchased from New Cell & Molecular Biotech. In Situ Cell Death Fluorescein Kit Tunel (11684795910) and SYBR Premix Ex Taq (04,913,914,001) were purchased from Roche. Trizol reagent (9109) and PrimeScript RT-PCR kit (RR037A) were purchased from Takara. Tumor dissociation kit (mouse) (130-096-730) was purchased form Mlitenyi Biotec.
Clinical samples
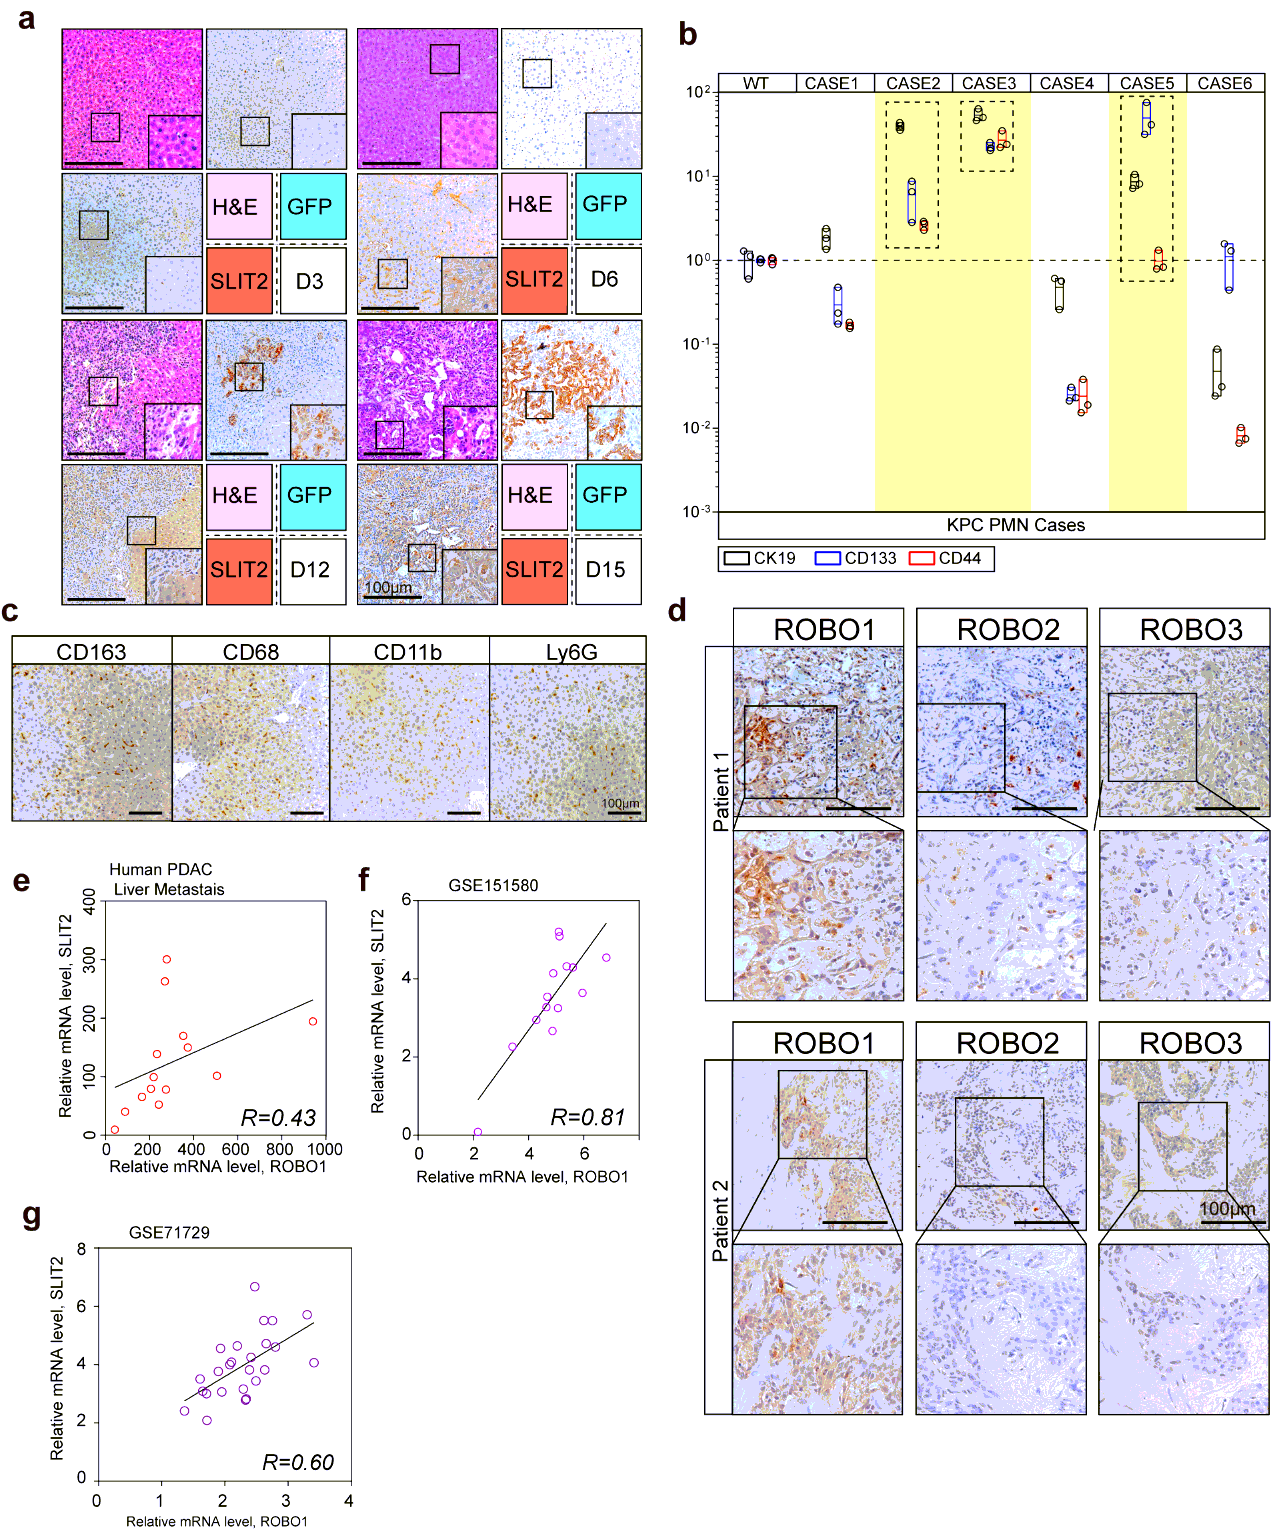
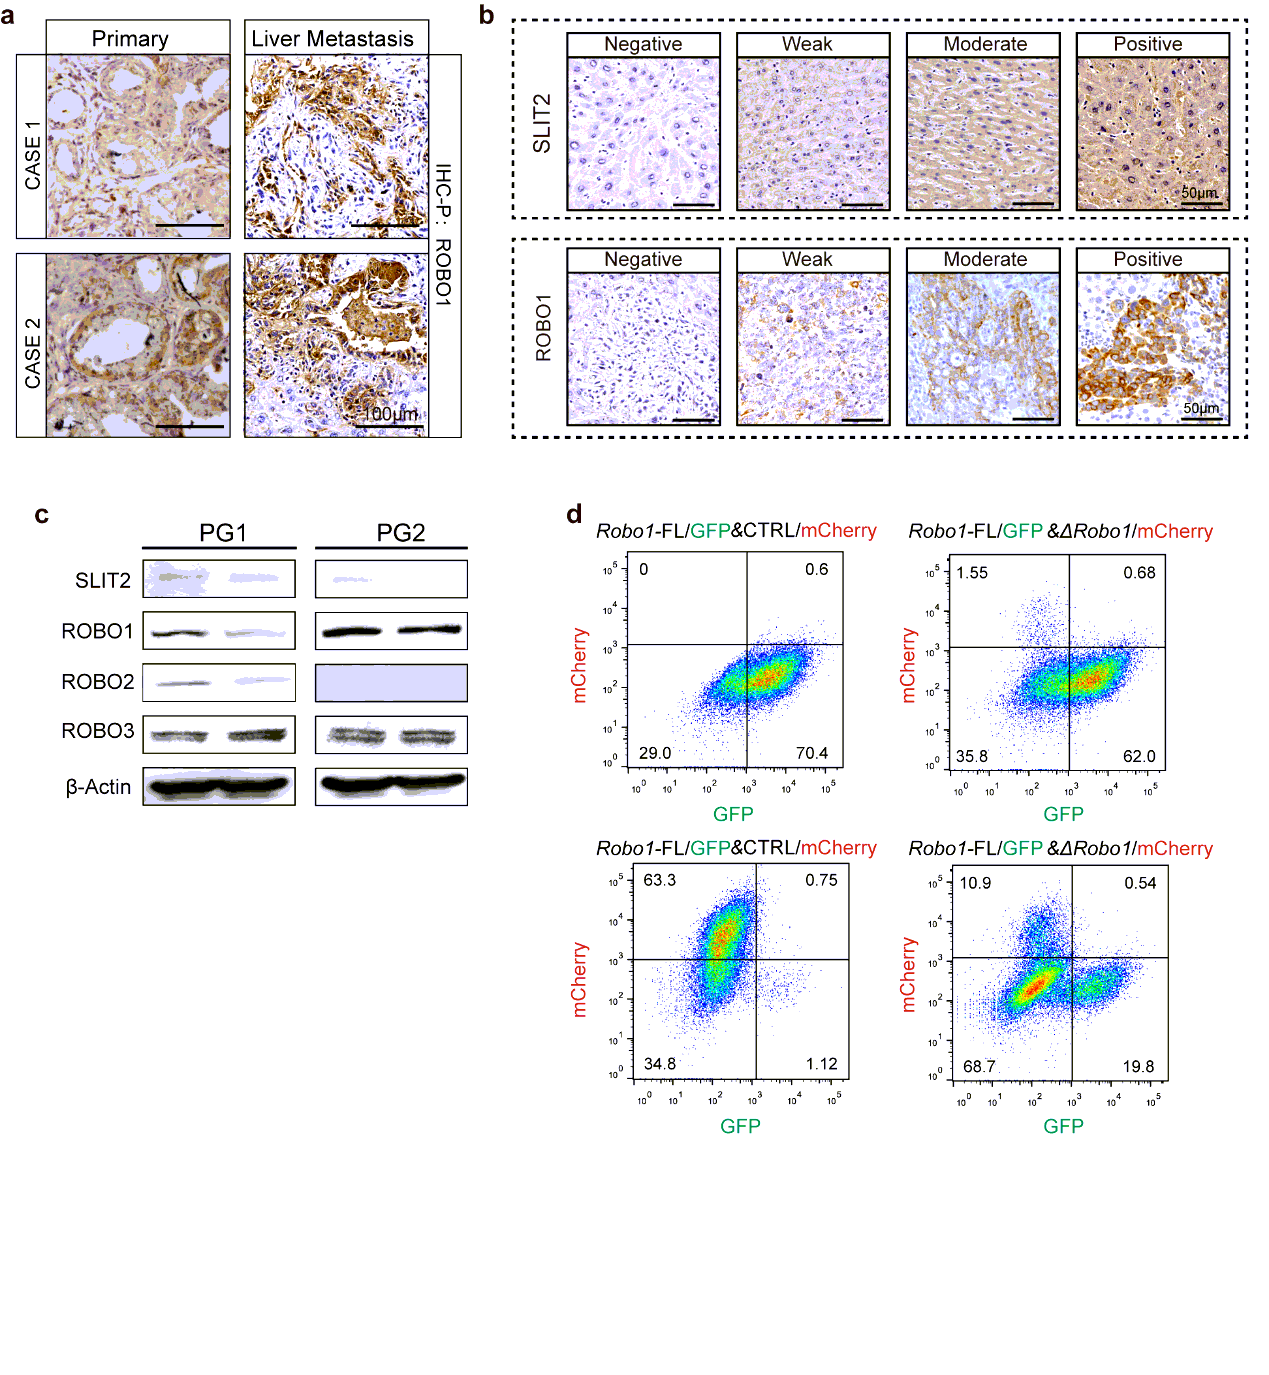
Specimens involved in this study mainly included 3 cohorts for respective experimental designs: Cohort I containing 35 cases liver metastasis tissues of PDAC patients together with paired primary tumor tissues was used for IHC-P or IF analysis; cohort II containing 14 fresh cases liver metastasis tissues of PDAC patients together with their paired primary tumor tissues was used for transcriptional analysis, which could be referred on https://www.biosino.org/node/project/detail/OEP000481; cohort III containing 266 cases PDAC primary tumor tissue of patients with their respective prognosis was performed for IHC-P and survival analysis.
Specimens of patients involved in our study were all from -- hospital, ---- University School of Medicine. Specimen collection, experiments design and performance were all approved by local ethics committee in ---- Hospital with patients’ informed consents. All these patients were diagnosed by both clinical surgeons and professional pathologists. Approval letter of ---- University School of Medicine, ---- Hospital Ethics Committee is ----.
Animal Experiments
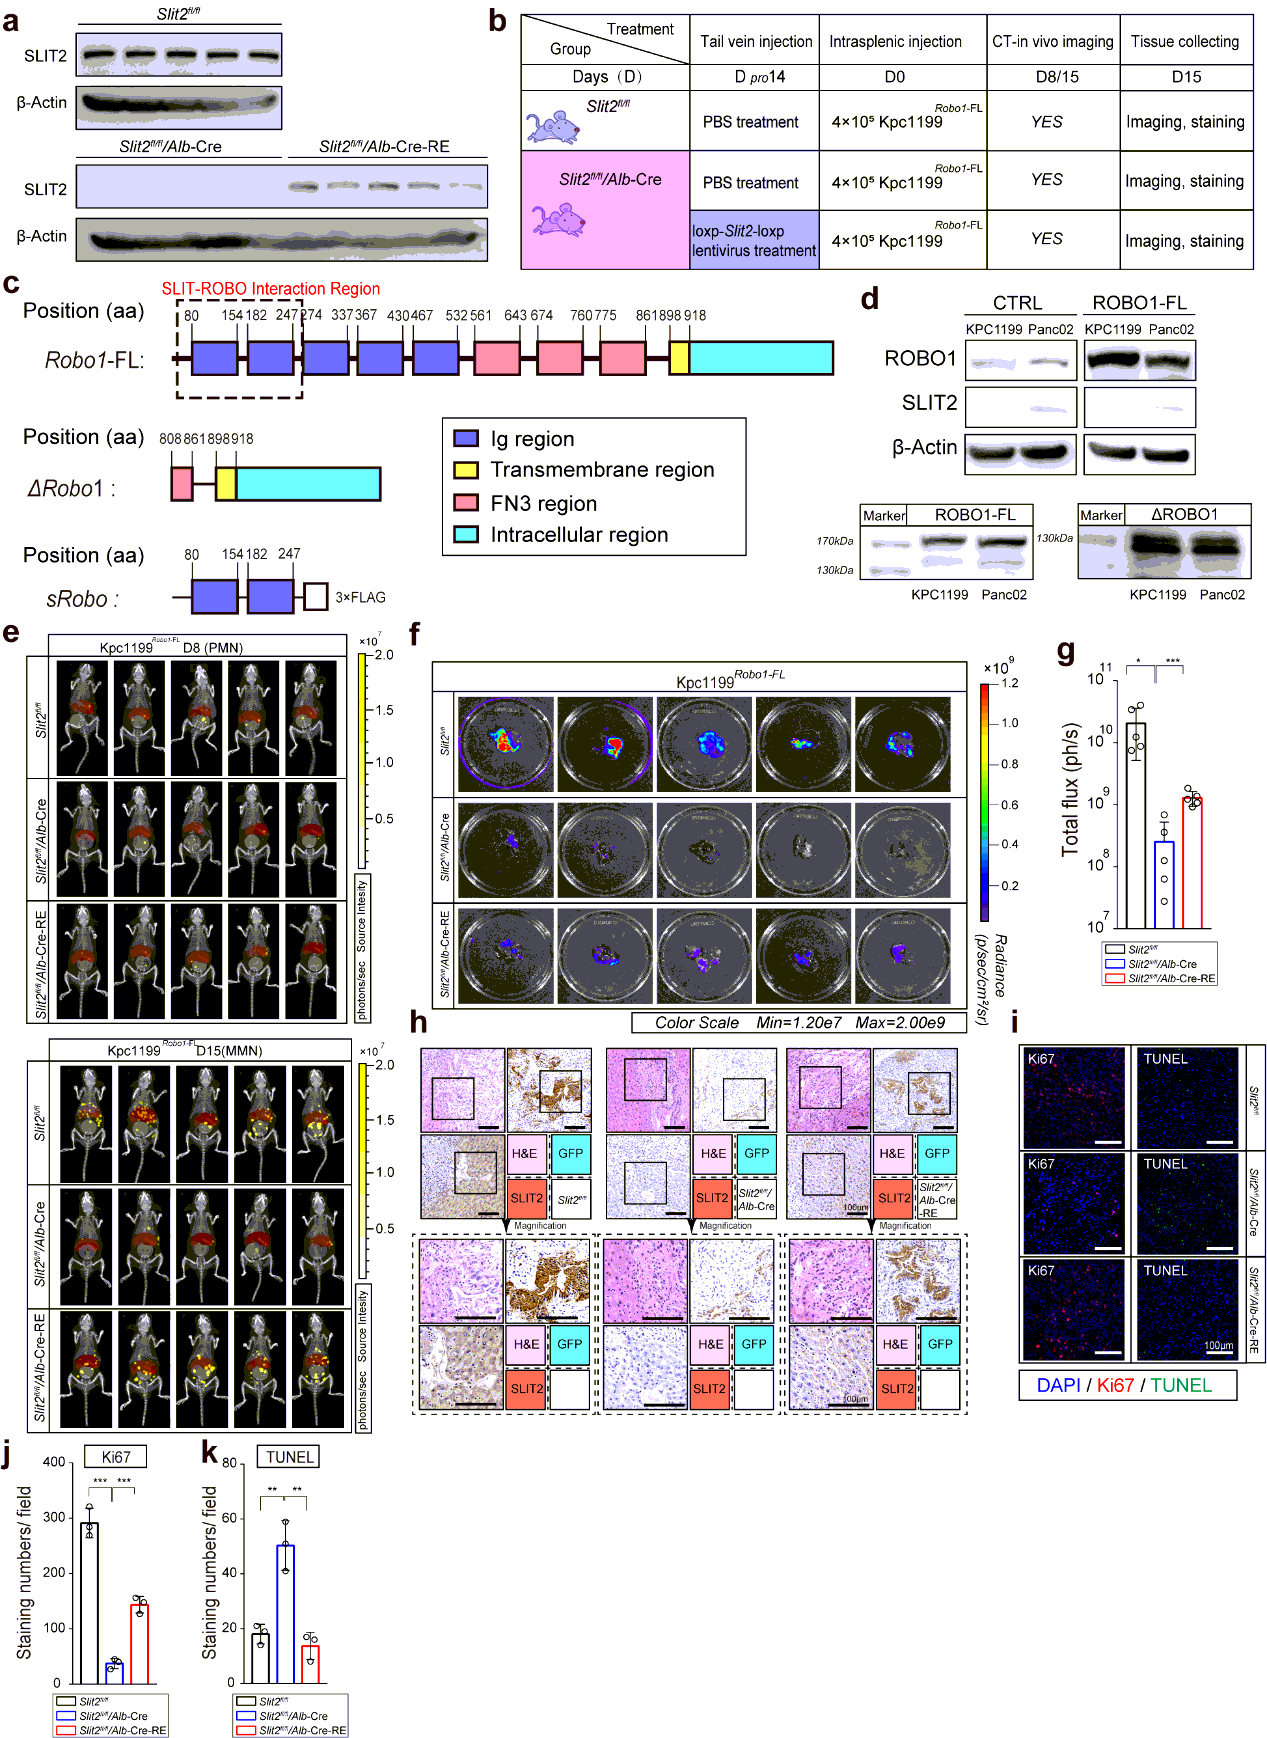
lox-stop-lox-KrasG12D/+; lox-stop-lox-Trp53R172H/+; Pdx1-Cre mice were purchased from The Jackson Laboratories (Bar Harbor, ME) to generate transgenic PDAC mouse model. Slit2fl/flmice and Alb1-Cre mice were purchased from Cyagen. All mice above were on the C57BL/6 genetic background. All C57BL/6 wildtype mice and nu/nu mice were purchased from ---- University.
Animal experiments were approved by Institutional Animal Care and Use Committee of ---- University. All animals received humane care according to the criteria outlined in the “Guide for the Care and Use of Laboratory Animals” prepared by the National Academy of Sciences and published by the National Institutes of Health. All manipulations were performed under approved protocol number ---- assigned by the Research Ethics Committee of ---- University. Mice were housed under specific pathogen-free conditions at ---- University. We chose male animals at ages of 6 to 8 weeks for tumor studies. Assignment of experimental groups was according to body weights of animals using stratified randomization. Investigators in these animal experiments were blinded to allocation during experiments and outcome assessments.
Liver Metastasis Model and Definition of PMN and MMN.
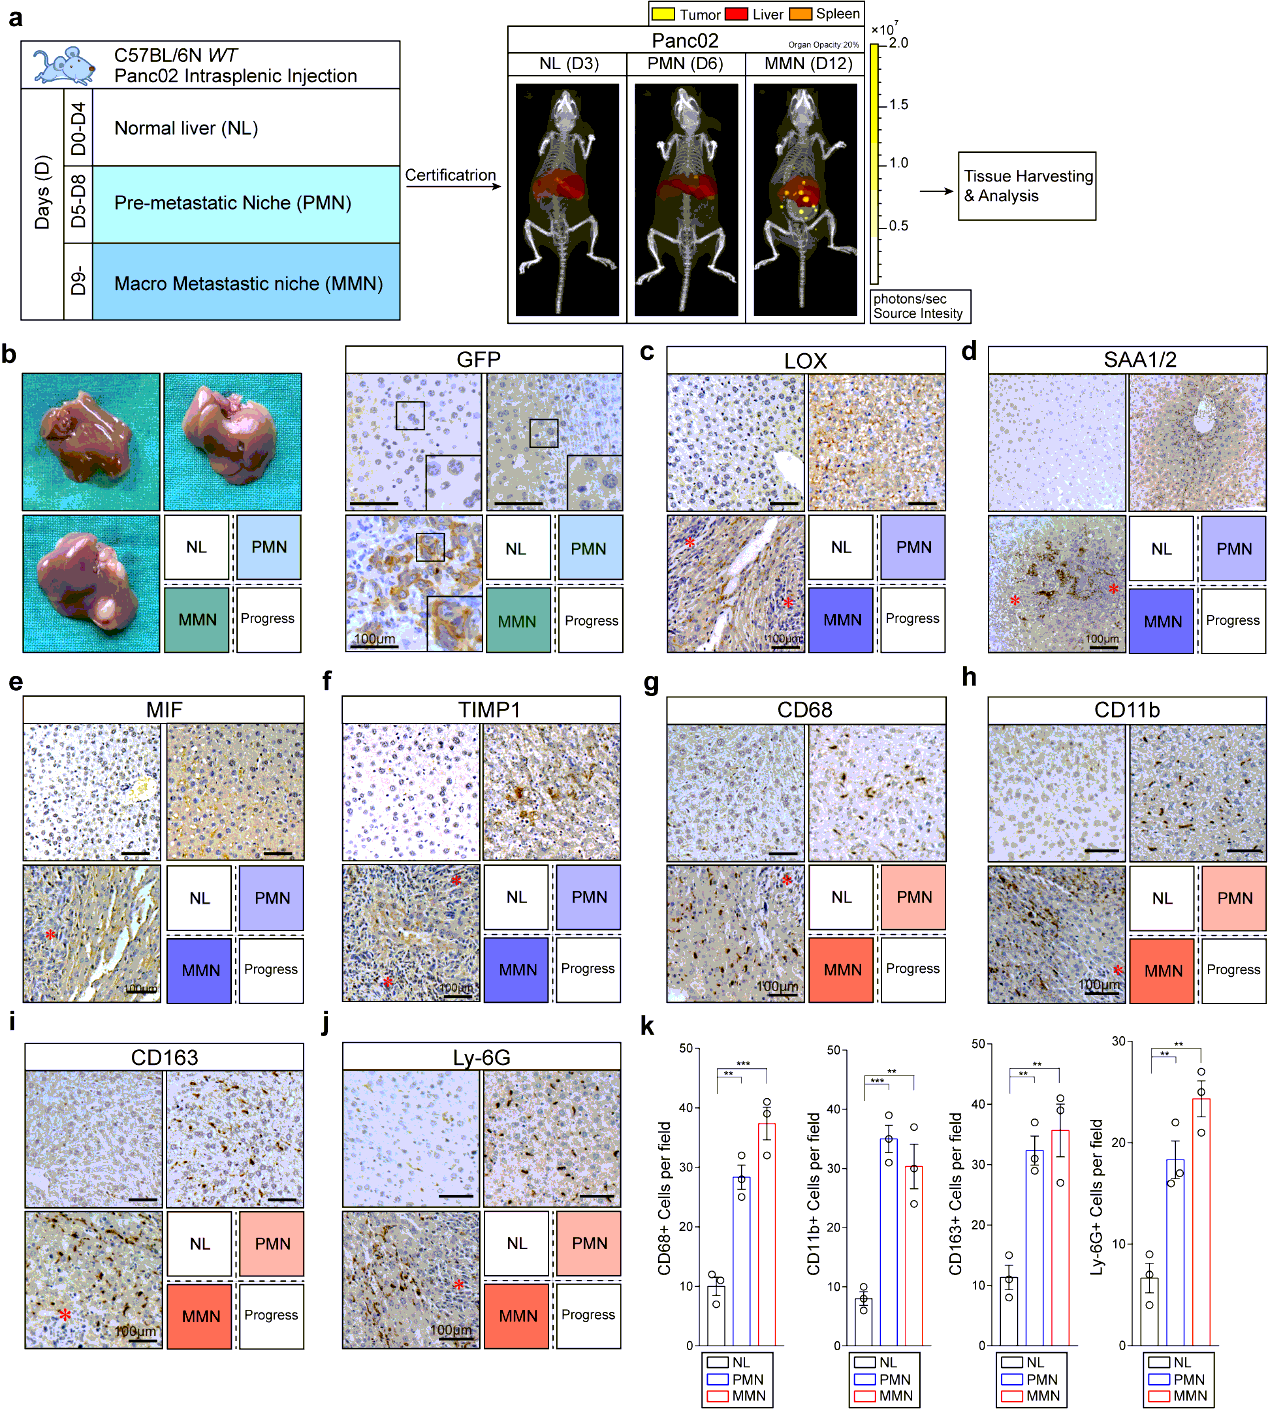
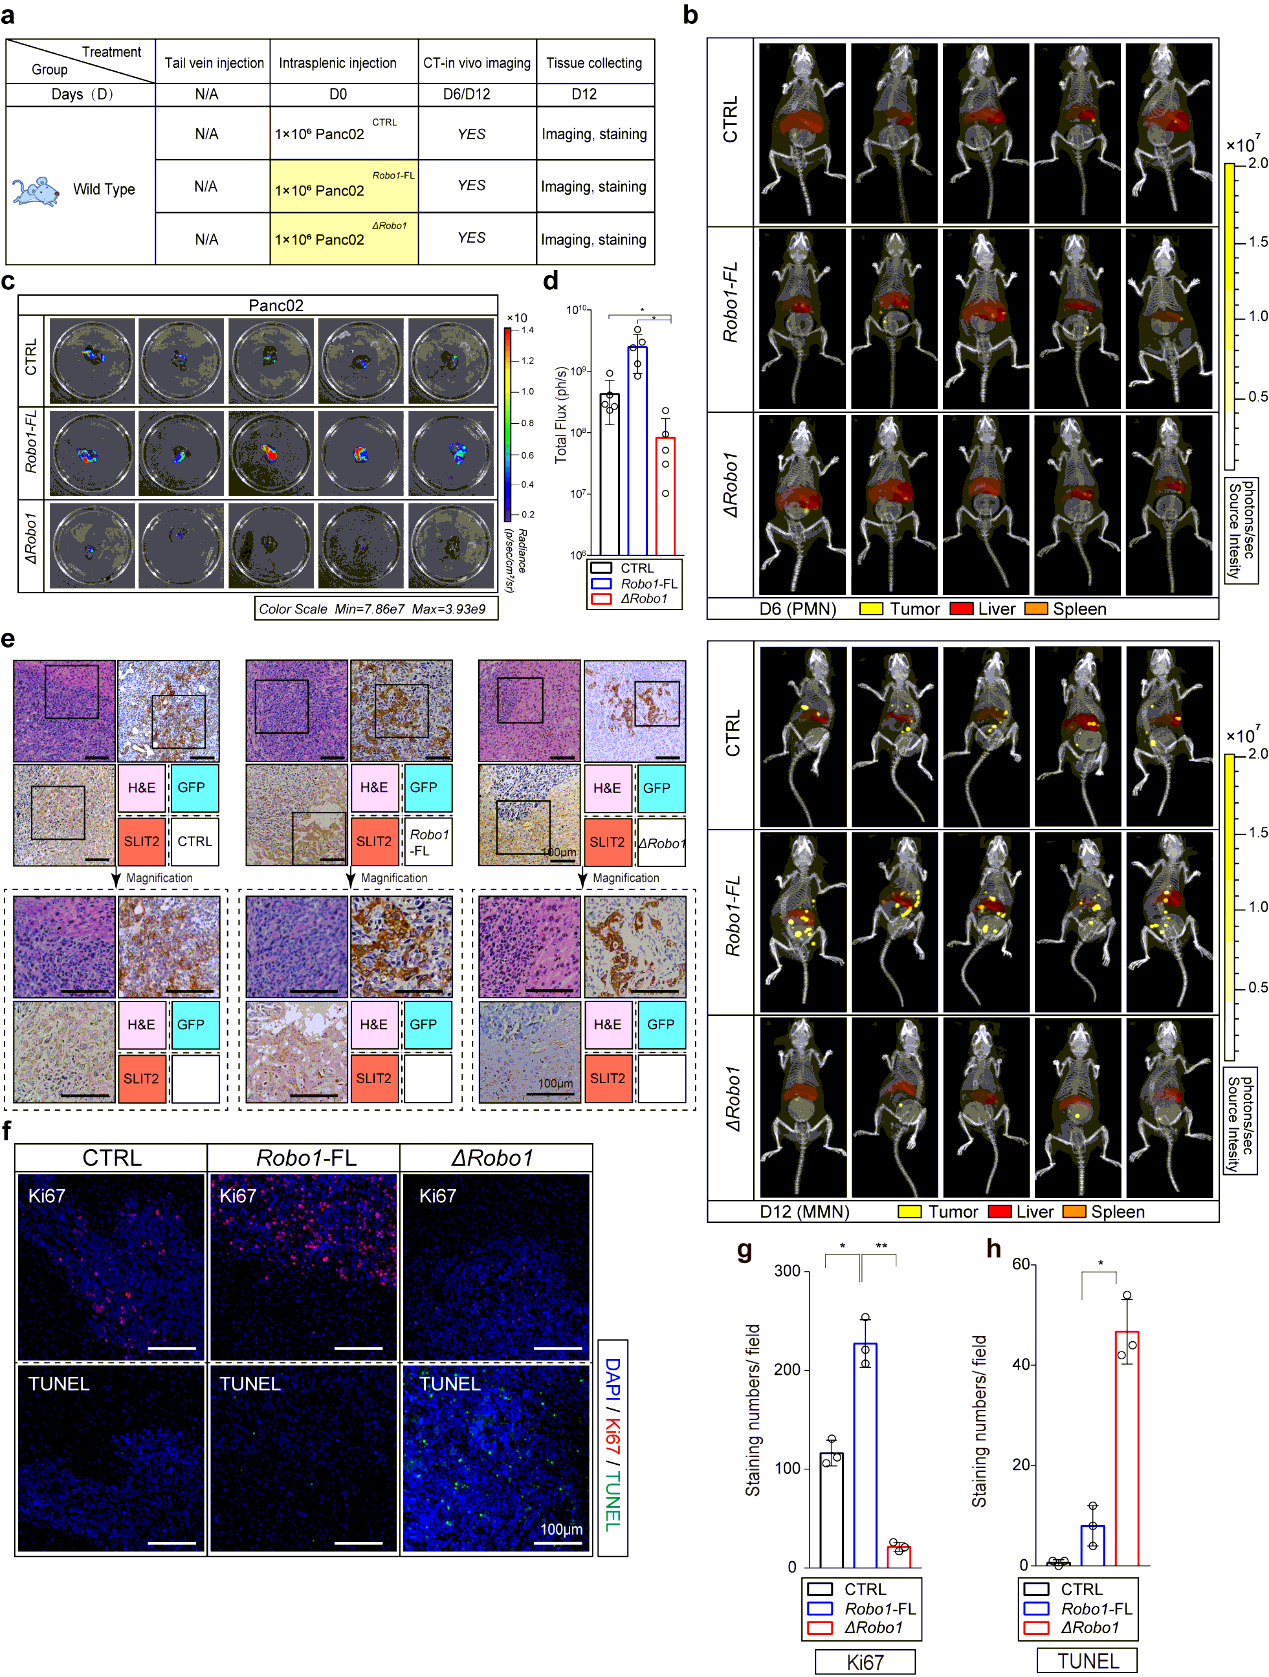
Intrasplenic injection model provides repeatable and controllable liver metastasis at relative fixed time in mice, which make it possible for research on PMN and MMN37–38. The disadvantages of this model involves that the progress of liver metastasis is more rapid than that in spontaneous ones such as KPC model, while it generates liver metastasis at a stable location and time point once using same experimental conditions15.
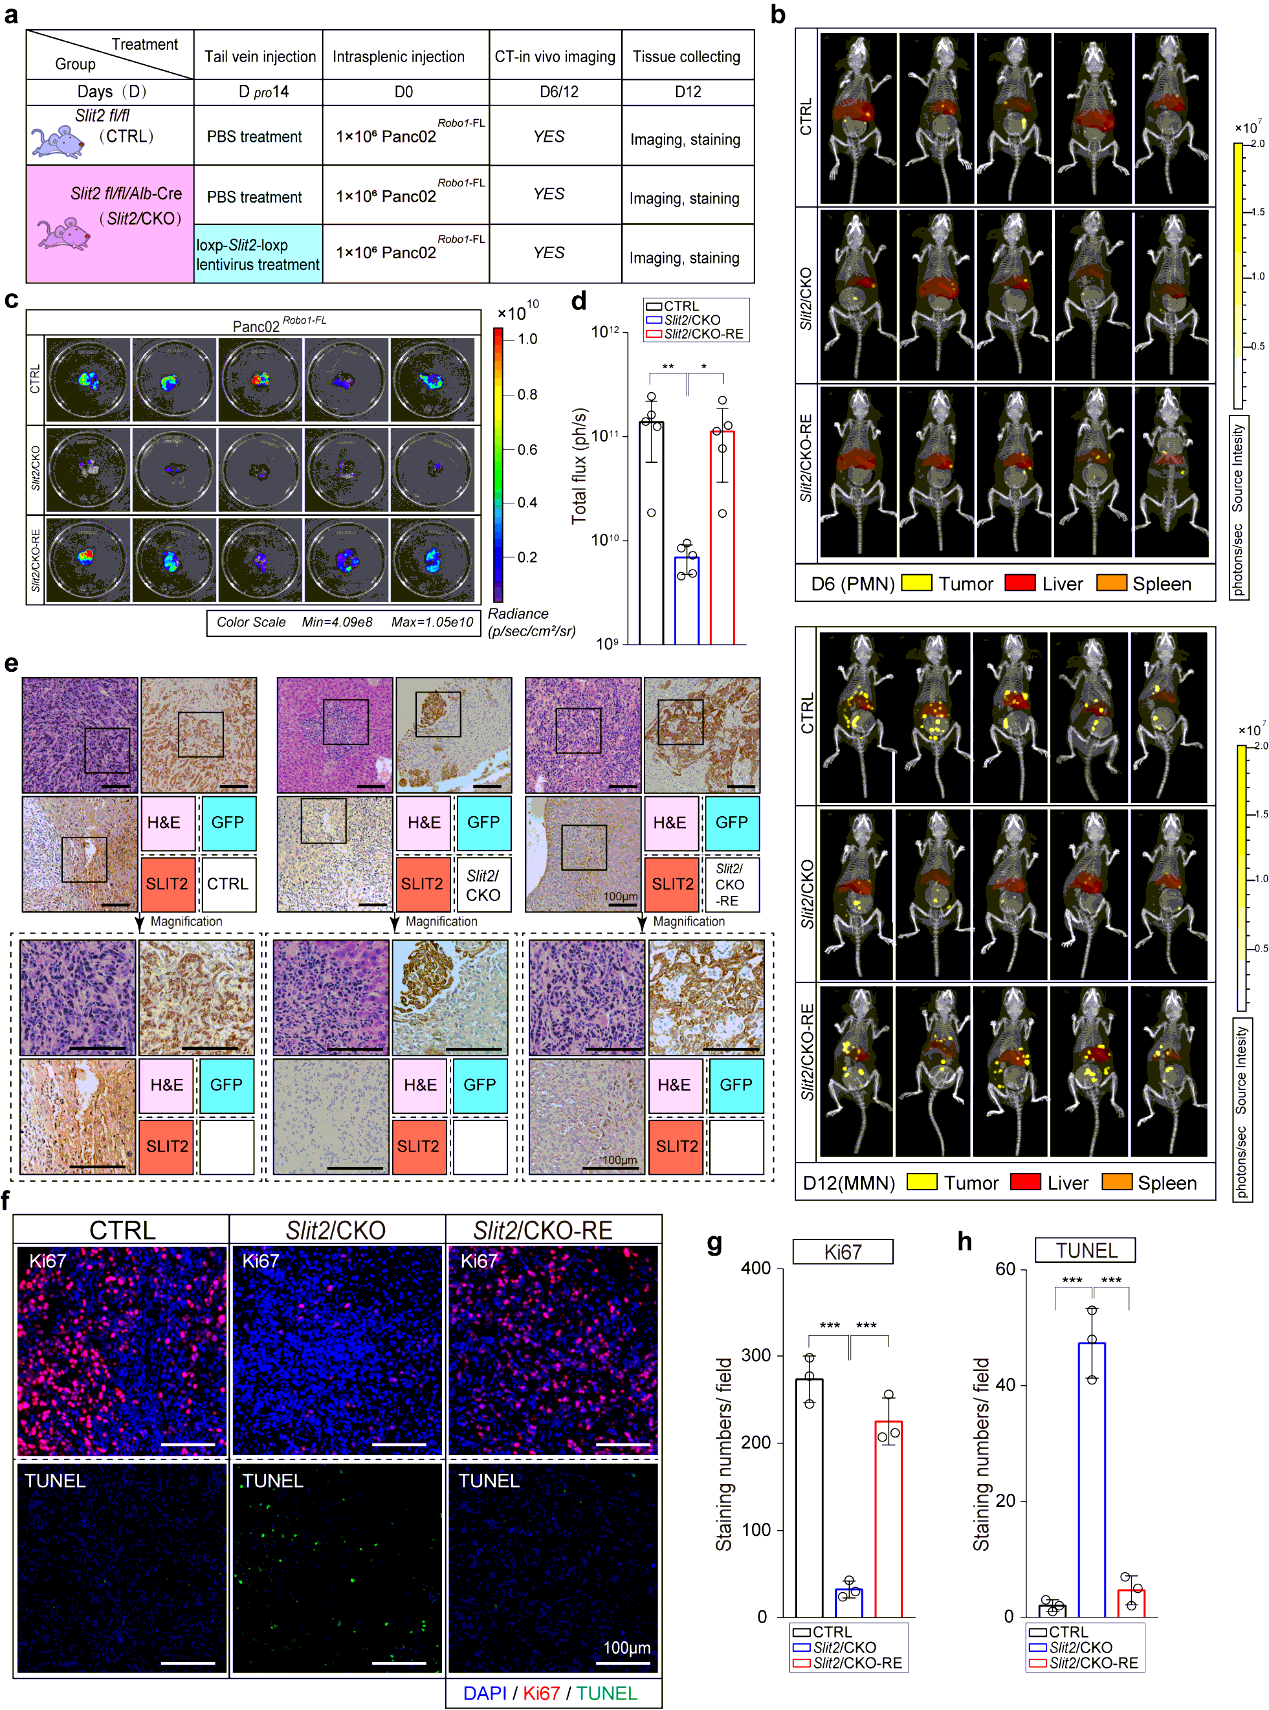
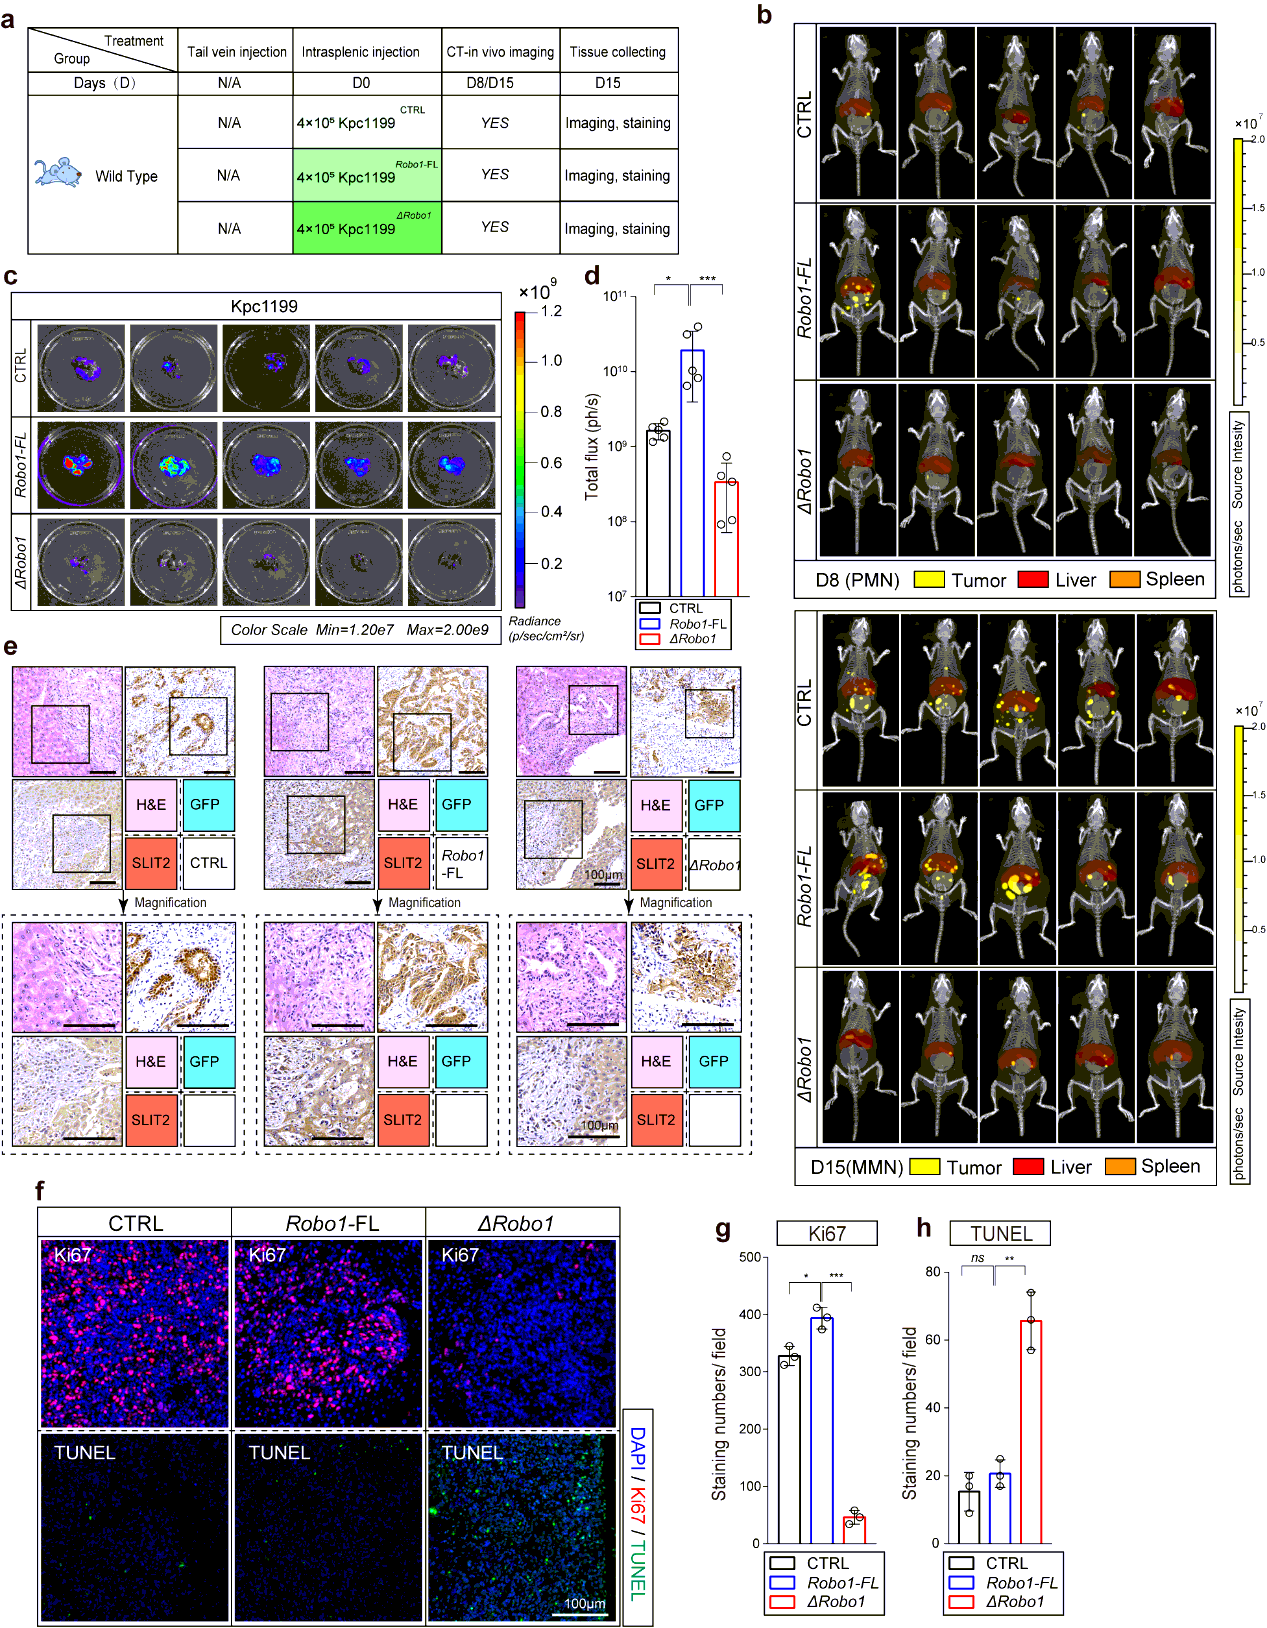
To start, we first explored the time points at which MMN formed in most modeled mice using Kpc1199 cells or Panc02 cells at different concentrations through IHC-P on liver left lobule sections every 3 days. We then chose Kpc1199 at 4 × 10⁵/mouse or Panc02 1 × 10⁶/mouse to ensure that the formation of MMN would not be too early or late which would make it difficult to settle down the time points of PMN. Results of IHC-P and CT combined 3D organ reconstruction bioluminescence imaging have finally defined the approximate time point of MMN (day 12- for Kpc1199 and day 9- for Panc02). In preliminary data involved in 50 mice for each cell line respectively, more than 90% mice would generate MMN on right time (98% for Kpc1199 cells on day 12 and 92% for Panc02 cells on day 9). Then we examined liver sections before MMN formation by staining GFP and reported PMN markers including LOX, TIMP-1, MIF, SAA1/2, and markers of M2 type macrophages. PMN recognized as GFP−/markers+ liver sections were then determined (day 7-11 for Kpc1199 and day 5-8 for Panc02). In preliminary data involved in 50 mice for each cell line respectively, more than 85% mice would generate PMN on right time according to markers mentioned before (90% for Kpc1199 cells on day 8 and 86% for Panc02 cells on day 6). We thus recognized the time point of both these events (Fig. 1b; Extended Data Fig. 1a).
In brief, 4 × 10⁵ Kpc1199 cells or 1 × 10⁶ Panc02 cells suspended in 20 µl DMEM without FBS were performed. Immunocompetent isogenic C57BL/6 mice under 2.5% isoflurane inhalation anesthesia were performed 10-15 mm subcostal incision through abdomen skin and peritoneum for surgical exposure of spleen after sterilization. The speed of injection was slower than 5 µl/s followed by 2s needle retention to prevent leakage. Wound closure was then rapidly performed.
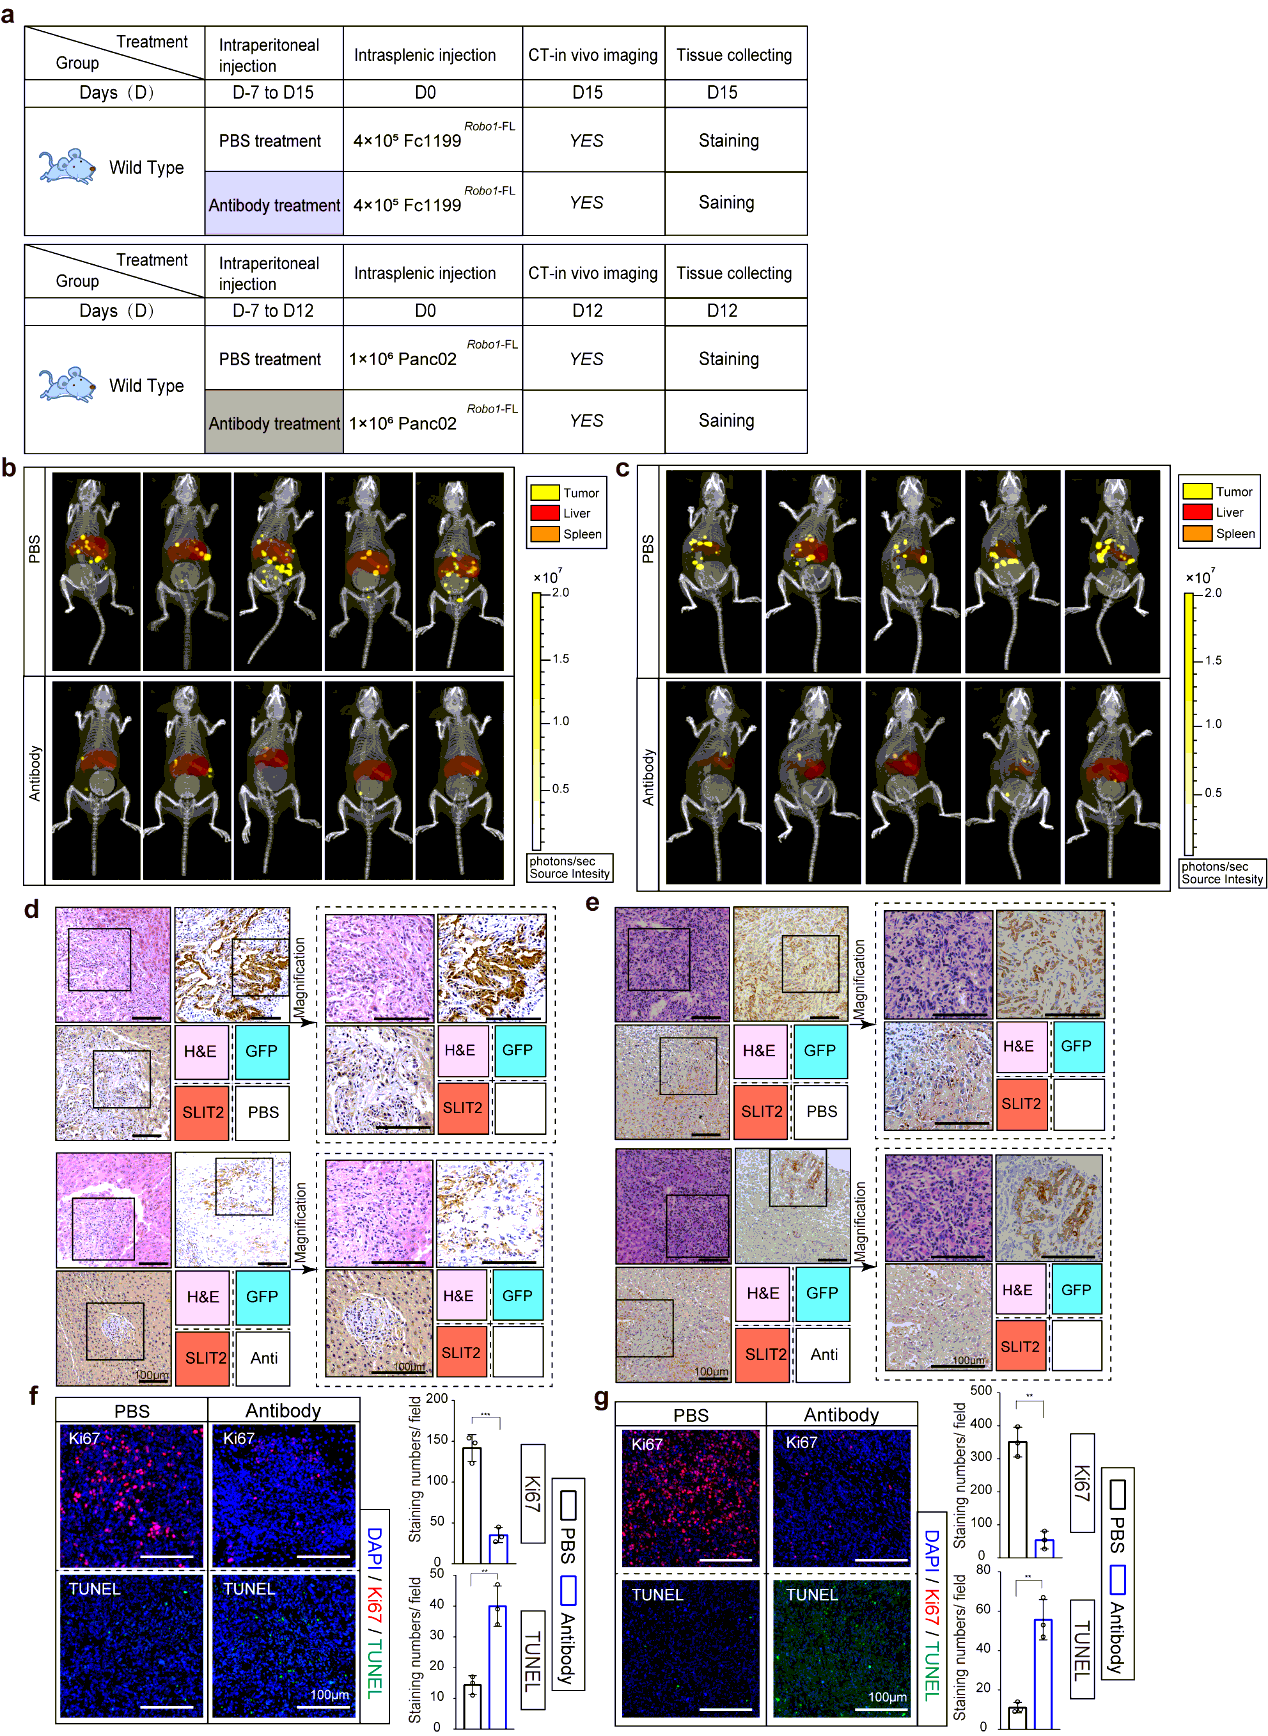
For retrieval of expression of SLIT2 in SLIT2 conditional knockout mice, we perform vector GV348 (Ubi-MCS-SV40-puromycin) containing loxp-NM_004787-loxp for lentivirus package. 200µl saline with or without a dose of 3×10⁷ of HIV were then delivered into the tail vein of mice respectively. Mice were anesthetized with 2.5% vaporized inhaled isoflurane and placed in restraint that positioned the mouse tail in a lighted, heated groove. The speed of injection was slower than 50 µl/s. The efficiency of restoration was evaluated 10 days later and the performance. Treatment was performed 2 weeks before the intrasplenic injection of tumor cells. For neutralizing antibody treatment, antibody towards Ig1-Ig2 domain of ROBO1 was performed intraperitoneal injection 1 week before hepatic metastasis modeling, and the administration of which was every 3 days until the mice were sacrificed. For administration of neutralizing antibody on KPC mice, intraperitoneal injection was performed every 3 day since week 12 or week 16 till week 18 before tissue harvsesting.
Subcutaneous Xenograft Model.
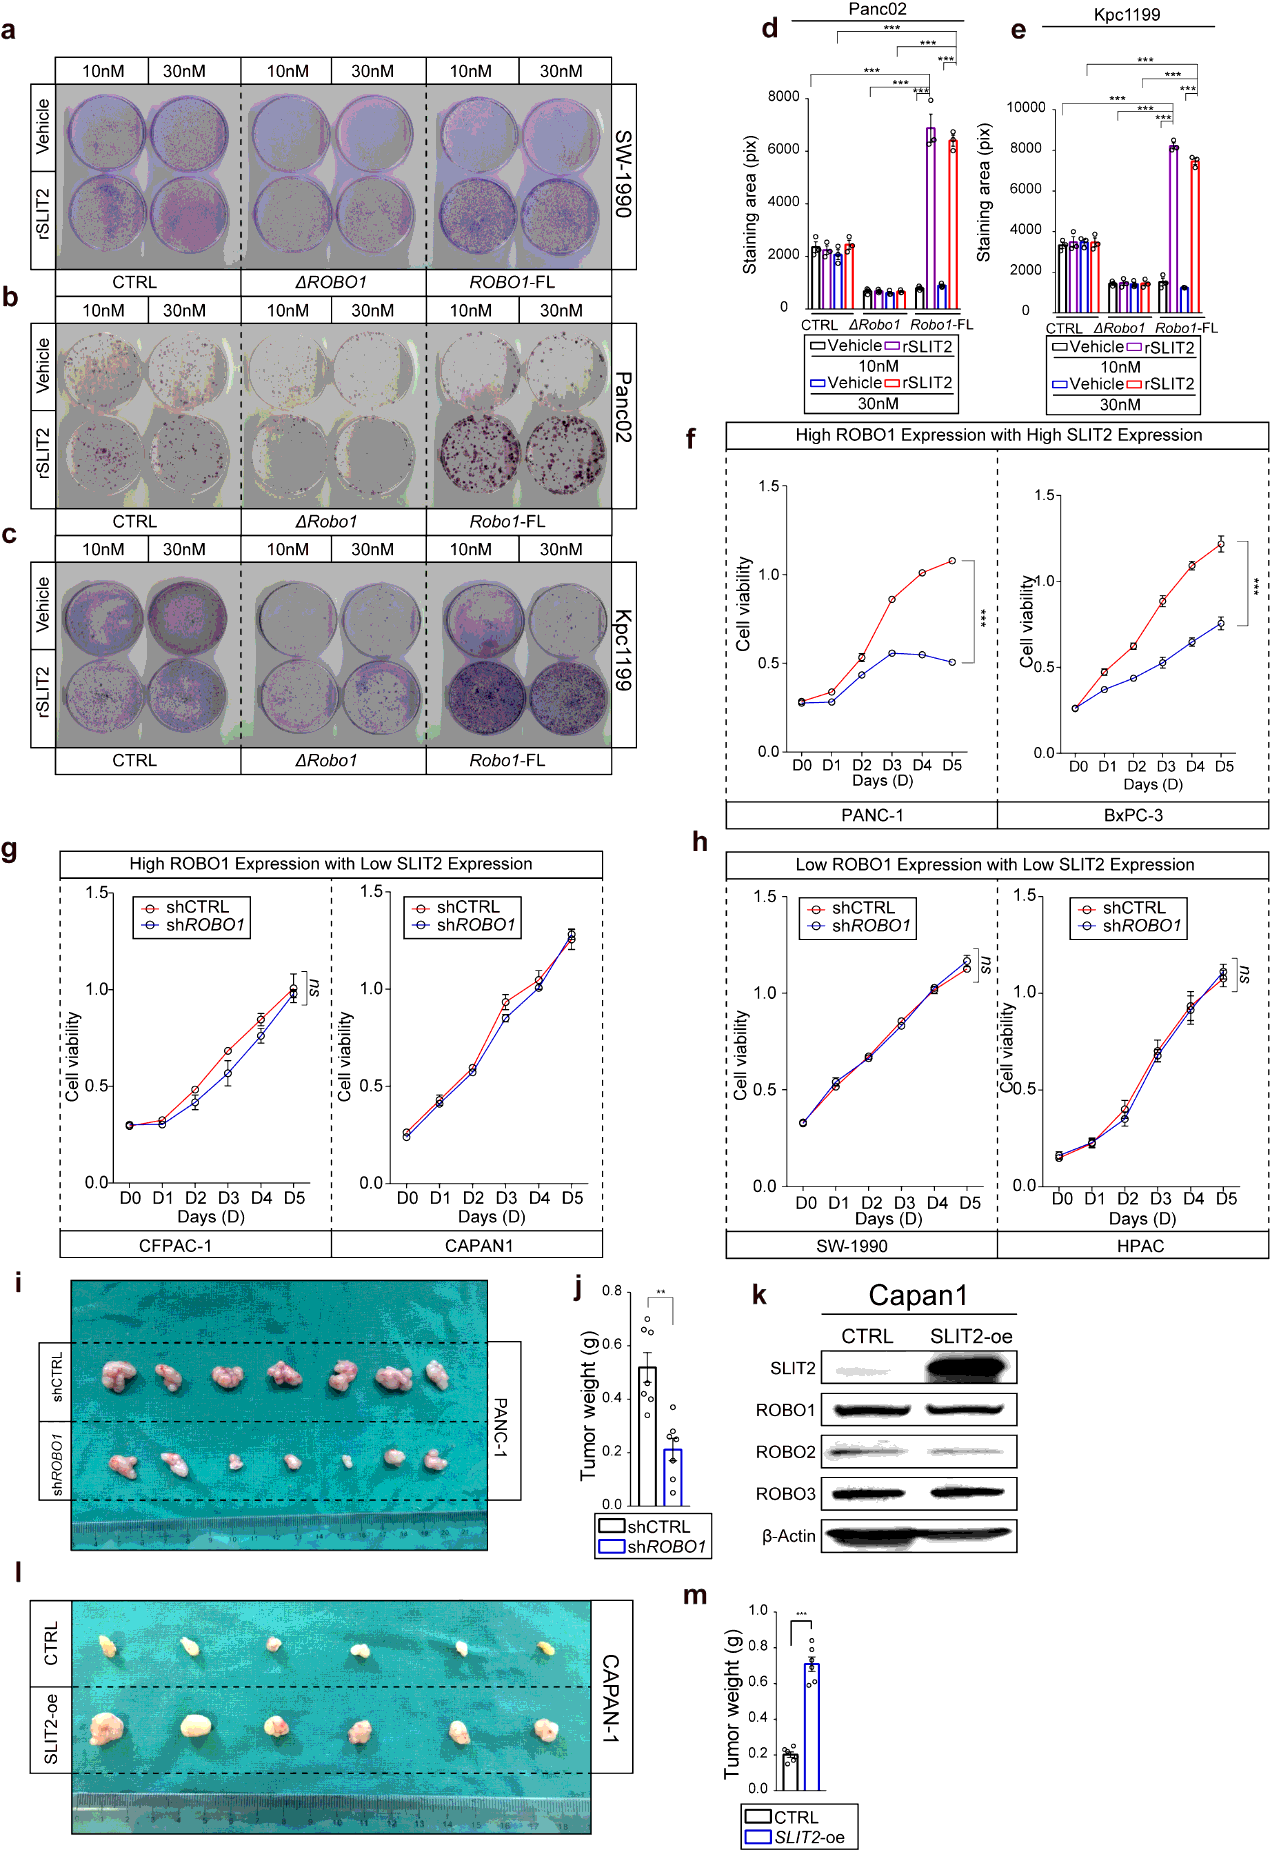
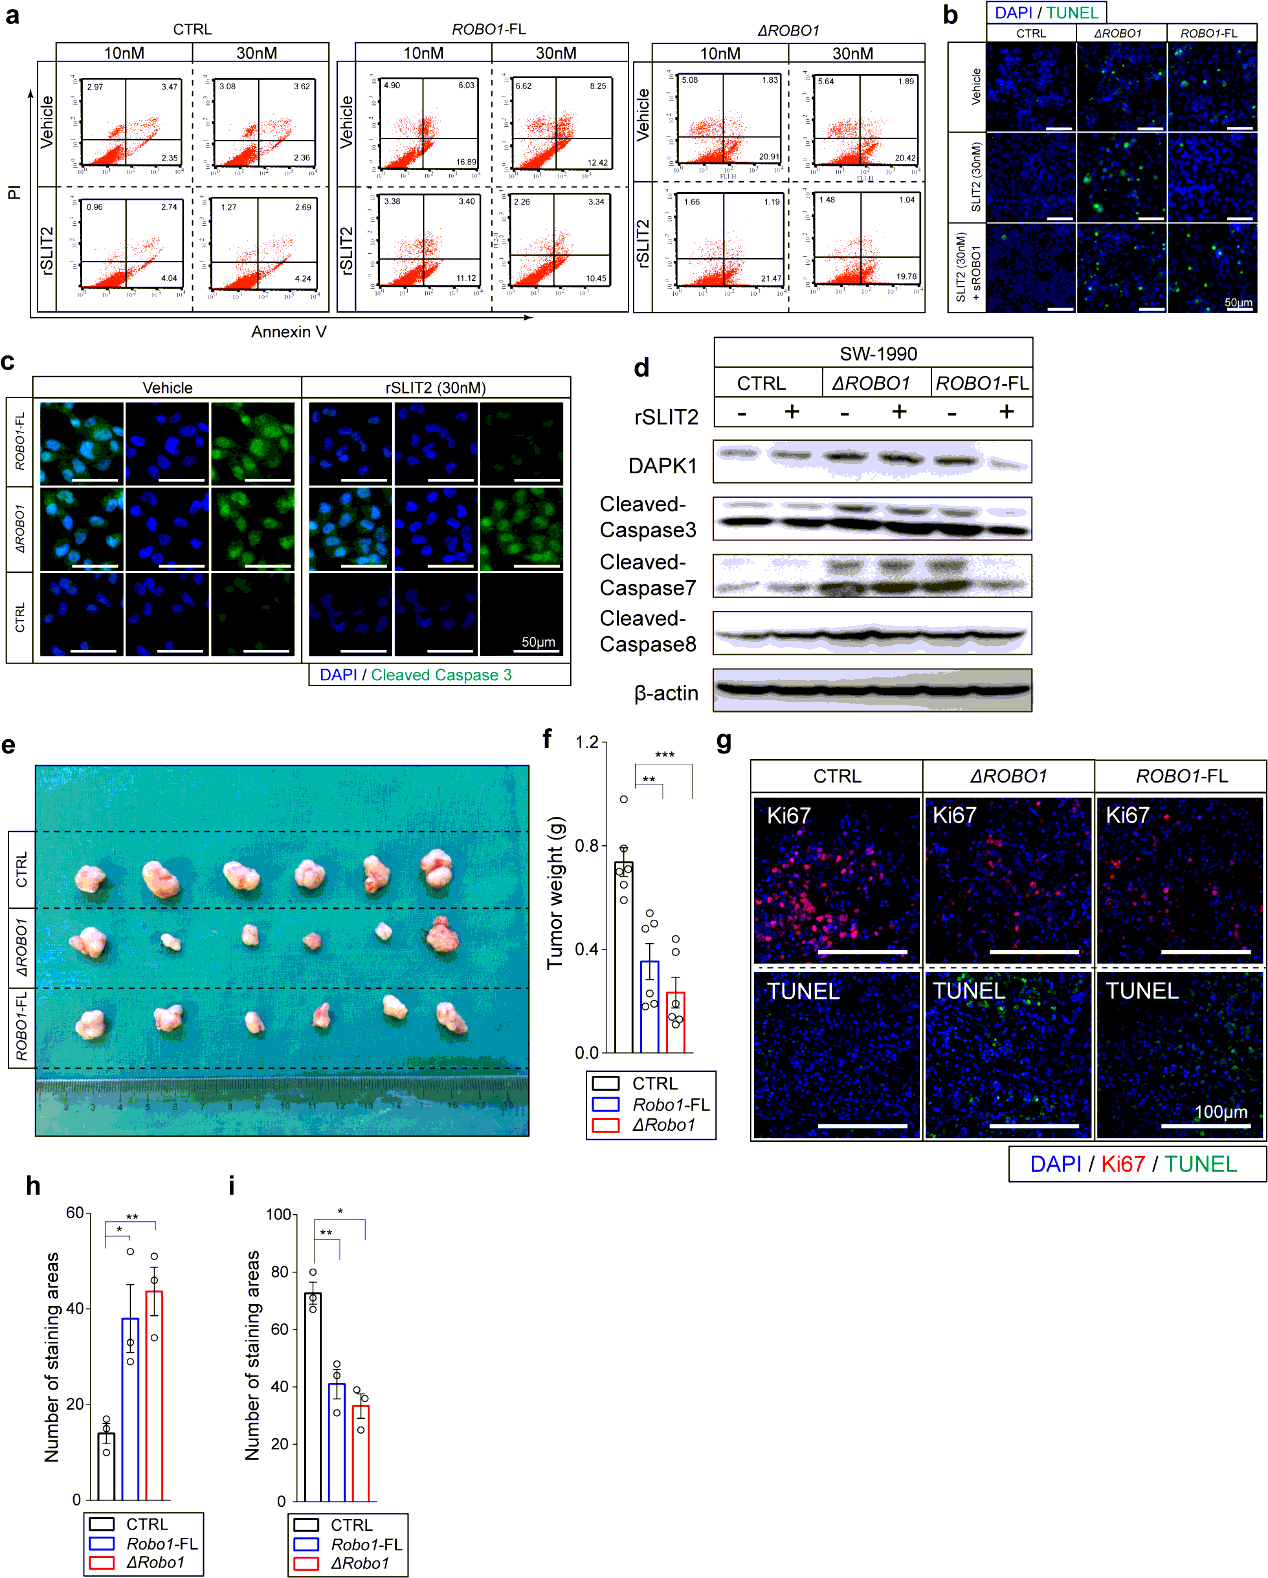
Athymic male nu/nu mice ages 6 to 8 weeks were used in subcutaneous xenograft model. For SW-1990, SW-1990CTRL, SW-1990ΔROBO1 and SW-1990ROBO1−FL suspended in DMEM at a concentration of 1 × 10⁷ cells/ml were injected, the injecting volume was 200µl, respectively, and tumor diameters were monitored with calipers every 4 days until the sacrifice of mice at day 24; for CAPAN-1, CAPAN-1CTRL and CAPAN-1SLIT2−oe suspended in DMEM at a concentration of 1 × 10⁷ cells/ml were injected, the injecting volume was 150µl, respectively, and tumor diameters were monitored with calipers every 3 days until the sacrifice of mice at day 15; for PANC-1, PANC-1shCTRL and PANC-1shROBO1 suspended in DMEM at a concentration of 2 × 10⁷ cells/ml were injected, the injecting volume was 200µl, and tumor diameters were monitored with calipers every 5 days until the sacrifice of mice at day 40. Inoculation was performed under the right inguinal skin of mice. Tumor volumes were calculated as volume = 0.5× length× width2. After mice were sacrificed, the tumors were separated from body and the weights of which were measured.
CT combined 3D Organ Reconstruction Bioluminescence Imaging.
Mice bearing hepatic metastasis composed of luciferase expressing tumor cells were intraperitoneal injected 150 mg D-luciferin at volume of 200µl. Mice were then anesthetized with 2.5% vaporized inhaled isoflurane 2 min after injection before placed into IVIS Spectrum (Caliper Life Sciences, Waltham, MA). CT was then performed to merge with firefly bioluminescence signals. For organ reconstruction, CT image was utilized to be placed into auto-reconstructed liver and spleen at opacity of 20%. The normalization and quantification of firefly bioluminescence signals were performed according to the red cube surrounding area. Mice were sacrificed at the end of test, the tumor-bearing livers were immediately isolated before icy PBS washing. Photo of luciferin emission imaging of every liver was then taken. All the imaging or calculating were performed by living Image software, version 4.5.3.
Transcriptional Analysis
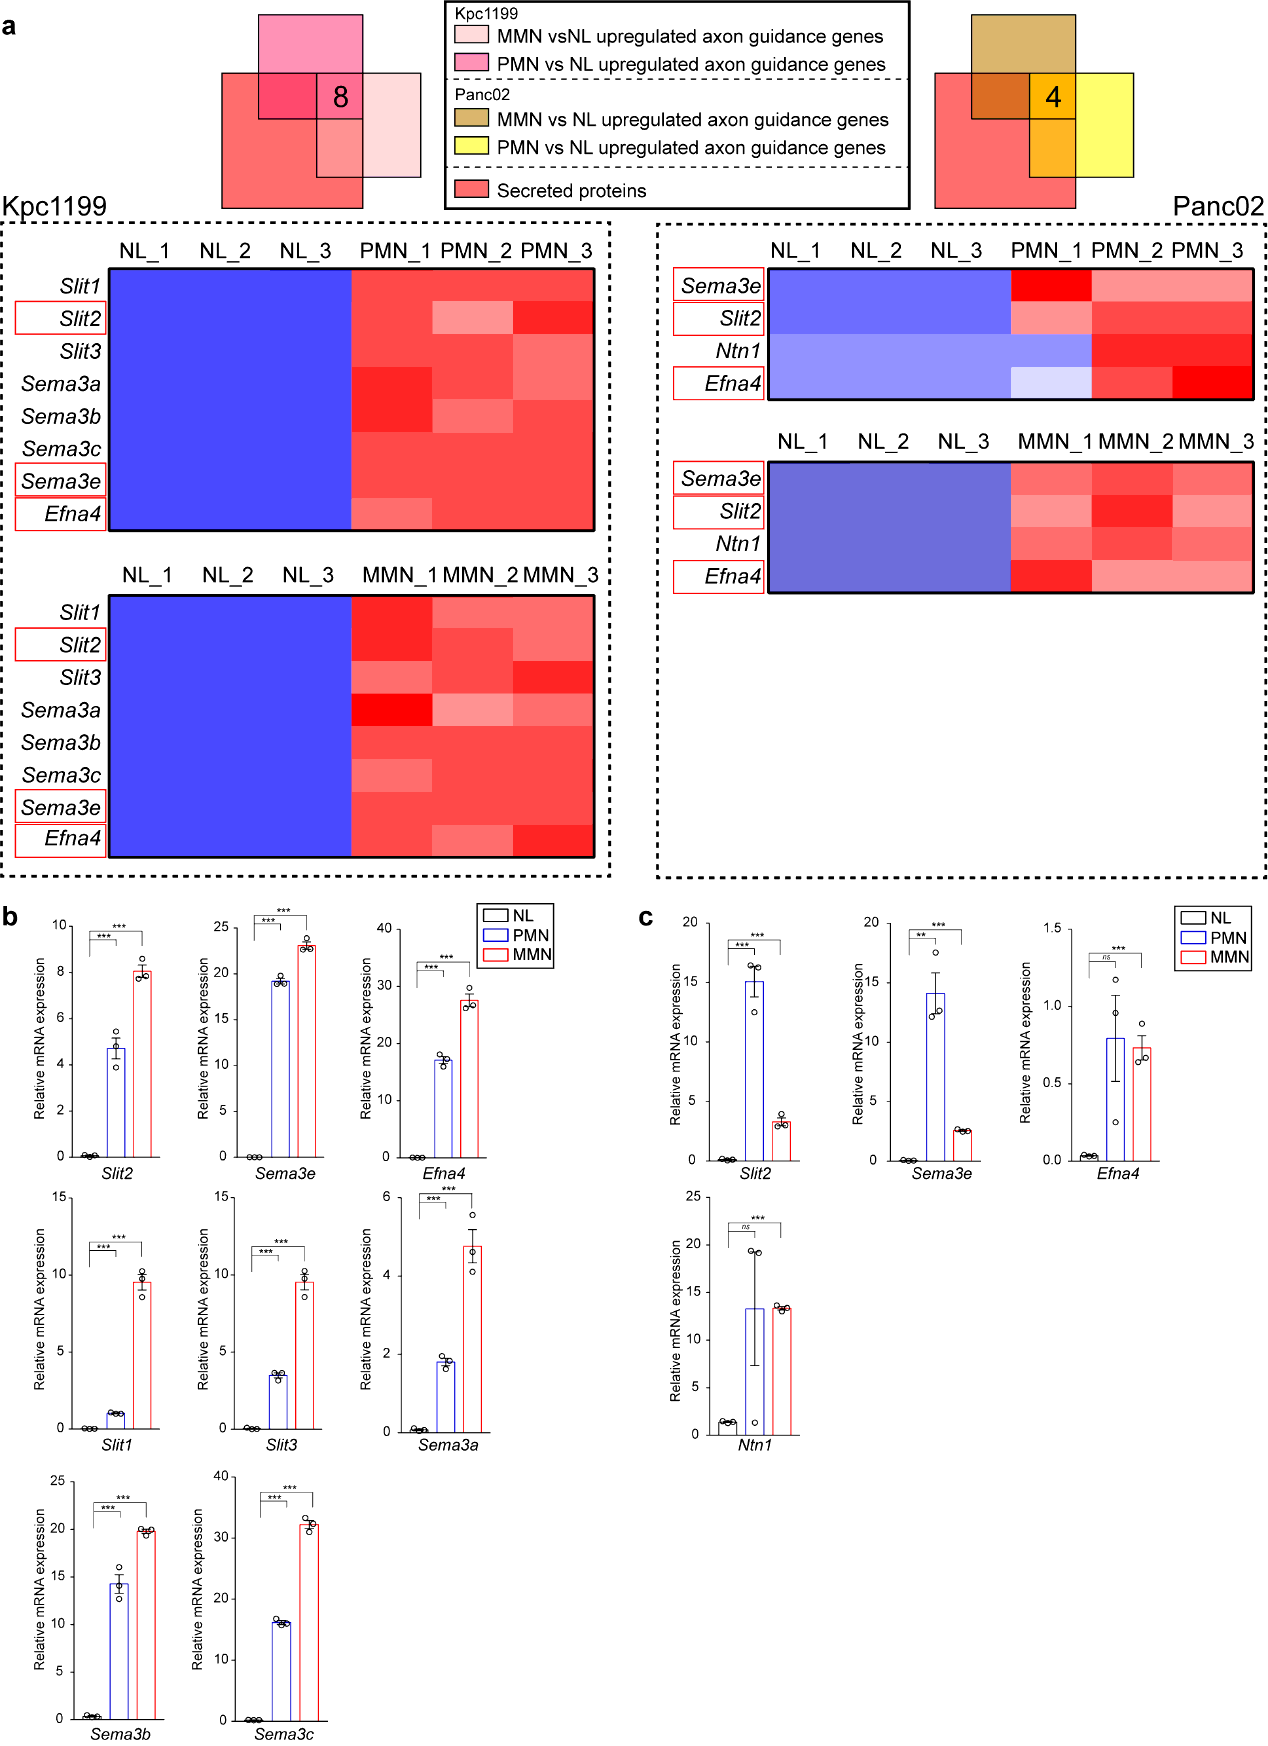
Panc02 or Kpc1199 intrasplenically injected mouse models were performed. Then mice were sacrificed at specific days and the livers of which were harvested. For Panc02 modeled mice, the time points were day 3, day 6 and day12; for Kpc1199 modeled ones, the time points were day 3, day8 and day15. The fresh livers gained were then washed by icy saline and left hepatic lobules of which were sliced into 2×2×2 mm3 cubes. Especially, for tissues of Panc02 modeled mice on day12 and Kpc1199 modeled mice on day 15, obvious metastatic niches could be observed, while only adjacent livers without metastasis would be selected for further study. In the following-up, PMN and MMN markers were measured before transcriptional analysis. The analysis data is available in the Sequence Read Archive (SRA), the number of which is PRJNA590588 (for Kpc1199) and PRJNA590599 (for Panc02).
For GSEA, 4GB (64bit) GSEA v4.01 Java Web Start (all platforms) were used. Analyses were performed as D3 vs. D8 and D3 vs. D15 for Kpc1199 and D3 vs. D6 and D3 vs. D12 for Panc02. Gene sets involved in these analyses were “c2.cp.kegg.v7.0.symbols.gmt”.
Metastatic Tumor Dissociation, Culture and Examination Intrasplenic injection model mice bearing liver metastasis were sacrificed after operation. The metastasized livers were then gained carefully and immediately followed by icy saline washing. Metastatic niches were carefully recognized and separated from liver. Fine-pointed forceps were used for detachment of remained liver parenchymal tissue, tumor associated fibrous or necrotic areas. Then “clean” liver metastatic tumors were washed by icy DMEM for 3 times and cut into 1×1×1mm cubes before transferred into 2.5 mL DMEM containing 100 µL of Enzyme D, 50 µL of Enzyme R, and 12.5 µL of Enzyme A provided in kit. After suspending the dissociated tumor tissues in the solution mentioned before, the tubes were tightly closed and put on constant temperature oscillator for 1h at 37℃, 120 rpm. The mixtures were then performed centrifugation at 1000 rpm for 5 min and the samples would be resuspended in DMEM for 3 times. The suspended tumor cells in DEMN were next for cell counting before planted on dishes. Briefly, approximate 5 × 10⁴ cells in complete DMEM would be add into 6-hole plates for further culture. Examination of GFP or mCherry expression and activity of luciferase would be taken into consideration for tumor cell certification.
Histology and Immunohistochemistry.
The tissues were fixed in 4% paraformaldehyde and embedded in paraffinized blocks. The blocks were cut into sections at a thickness of 5 µm, then deparaffinized and rehydrated for histopathological evaluation. For hematoxylin-eosin (HE) staining, the sections were dyed in hematoxylin for 5 mins and in eosin for 5-10 secs for HE staining. For immunohistochemical staining, the sections were placed in sodium citrate buffer solution (PH 6.0) for 20 minutes to carry out repair of tissue antigens. Then these sections were incubated with 0.3% hydrogen peroxide/phosphate-buffered saline for 30 mins and blocked with 10% (w/v) BSA (Sangon)/Phosphate-buffered saline (PBS). Slides were first incubated using the antibodies at 4°C overnight with optimal dilution. After washed three times with 1×PBS, the slides were labeled by HRP second antibody at room temperature for 1 h. Then the sections were washed three times in 1×PBS, then treated with DAB substrate liquid (Thermo) and counterstained by hematoxylin. All the sections were observed and photographed with a microscope (Carl Zeiss). Various primary antibodies were used as follow: ROBO1 (N-Terminal) (1:300), ROBO2(1:300), ROBO3 (1:500), SLIT2 (1:500), CK19 (1:500), p38α (1:700), P-p38(T180+Y182) (1:500), F4/80 (1:200), CD68 (1:100), CD11b (1:200), Ly-6G (1:300), LOX (1:500), MIF (1:300), TIMP-1 (1:500), SAA1/2 (1:700). Secondary antibodies were utilized as follow: HRP-conjugated anti-Goat (1:1000), HRP- conjugated anti-Rabbit (1:500), HRP- conjugated anti-Mouse (1:500).
Immunofluorescence Staining.
For tissue staining, the sections carried tissues were placed in PH 6.0 sodium citrate buffer solution for 20 minutes to subject heat-mediated antigen retrieval. Then these sections were blocked by 10% (w/v) BSA/PBS and co-incubated with primary antibodies at 4°C overnight with optimal dilution. For cell staining, SW1990 cells at 2×10⁴ cells per well, PANC1 at 2×10⁴ per well or MIA PaCa-2 at 3×10⁴ cells per well were seeded on slides in 12-well plates (ibidi) respectively and cultured at 37°C. After washed three times with 1×PBS, the slides were labeled with Alexa Fluor 594-conjugated anti-rabbit antibody and Fluor 488 conjugated anti-mouse antibody at room temperature for 1 h. The nucleus was stained with DAPI (Sigma) after the redundant second antibody were removed. After washed three times with 1×PBS, the immunoflurescene signals were captured using confocal-scopy (Carl Zeiss).
Ex vivo Living Tumor Tissue Culture
Liver tissues containing Panc02 Robo1−FL formed metastatic niches gained from intrasplenic injection mouse model or metastasized liver tissue of KPC mouse model were separated on ice for maintaining their structural integrity and activity. Then tissues were washed in icy saline within 15min after resection, followed by sliced into small cubes at an approximate volume of 5×5×5 mm3. Each cube must contain liver metastatic niches and their adjacent livers. Then these cubes were placed into complete medium with or without 30nM rSLIT2 administration/ ROBO1 neutralizing antibody respectively.
For intrasplenic model derived livers, these tissues were stimulated for 1h to measure the rapid phosphorylation of p38αMAPK. Importantly, a cube would be cut into two pieces in the middle and placed into medium with or without rSLIT2 respectively for ensuring the same tumor microenvironment (TME) of metastatic niches undergoing. After rSLIT2 administration, all tissues were immediately fixed by 4% paraformaldehyde for further IHC-P test.
For KPC mice derived livers, these tissues were treated with antibody no more than 8h to maintain the tissue constructures. All tissues were then immediately fixed by 4% paraformaldehyde followed by IF staining.
Recombinant SLIT2 and sROBO Protein Expression and Purification
Episomal expression vector with pCEP-Pu-Strep II-tag were cloned in the SLIT2 or sROBO1 ORF. The reconstructed plasmids were transfected into 293T cell line for recombinant protein expression. Puromycin for screening was administrated into complete DMEM at a concentration of 5-10 µg/ml 48h after transfection for 10 days and 2 µg/ml of which was performed to maintain the expression positive cells after that. Then the culture medium of transfected 293T was collected and applied to Strep Tactin sepharose column (IBA, 2-1202-101) followed by washing of binding buffer and elution buffer containing 2.5mM desthiobiotin on ice. The harvested fractions were further quantified by Nanodrop 2000 spectrophotometer (Thermo) and western blotting was performed for identification. See also our pervious study39.
Cell Culture
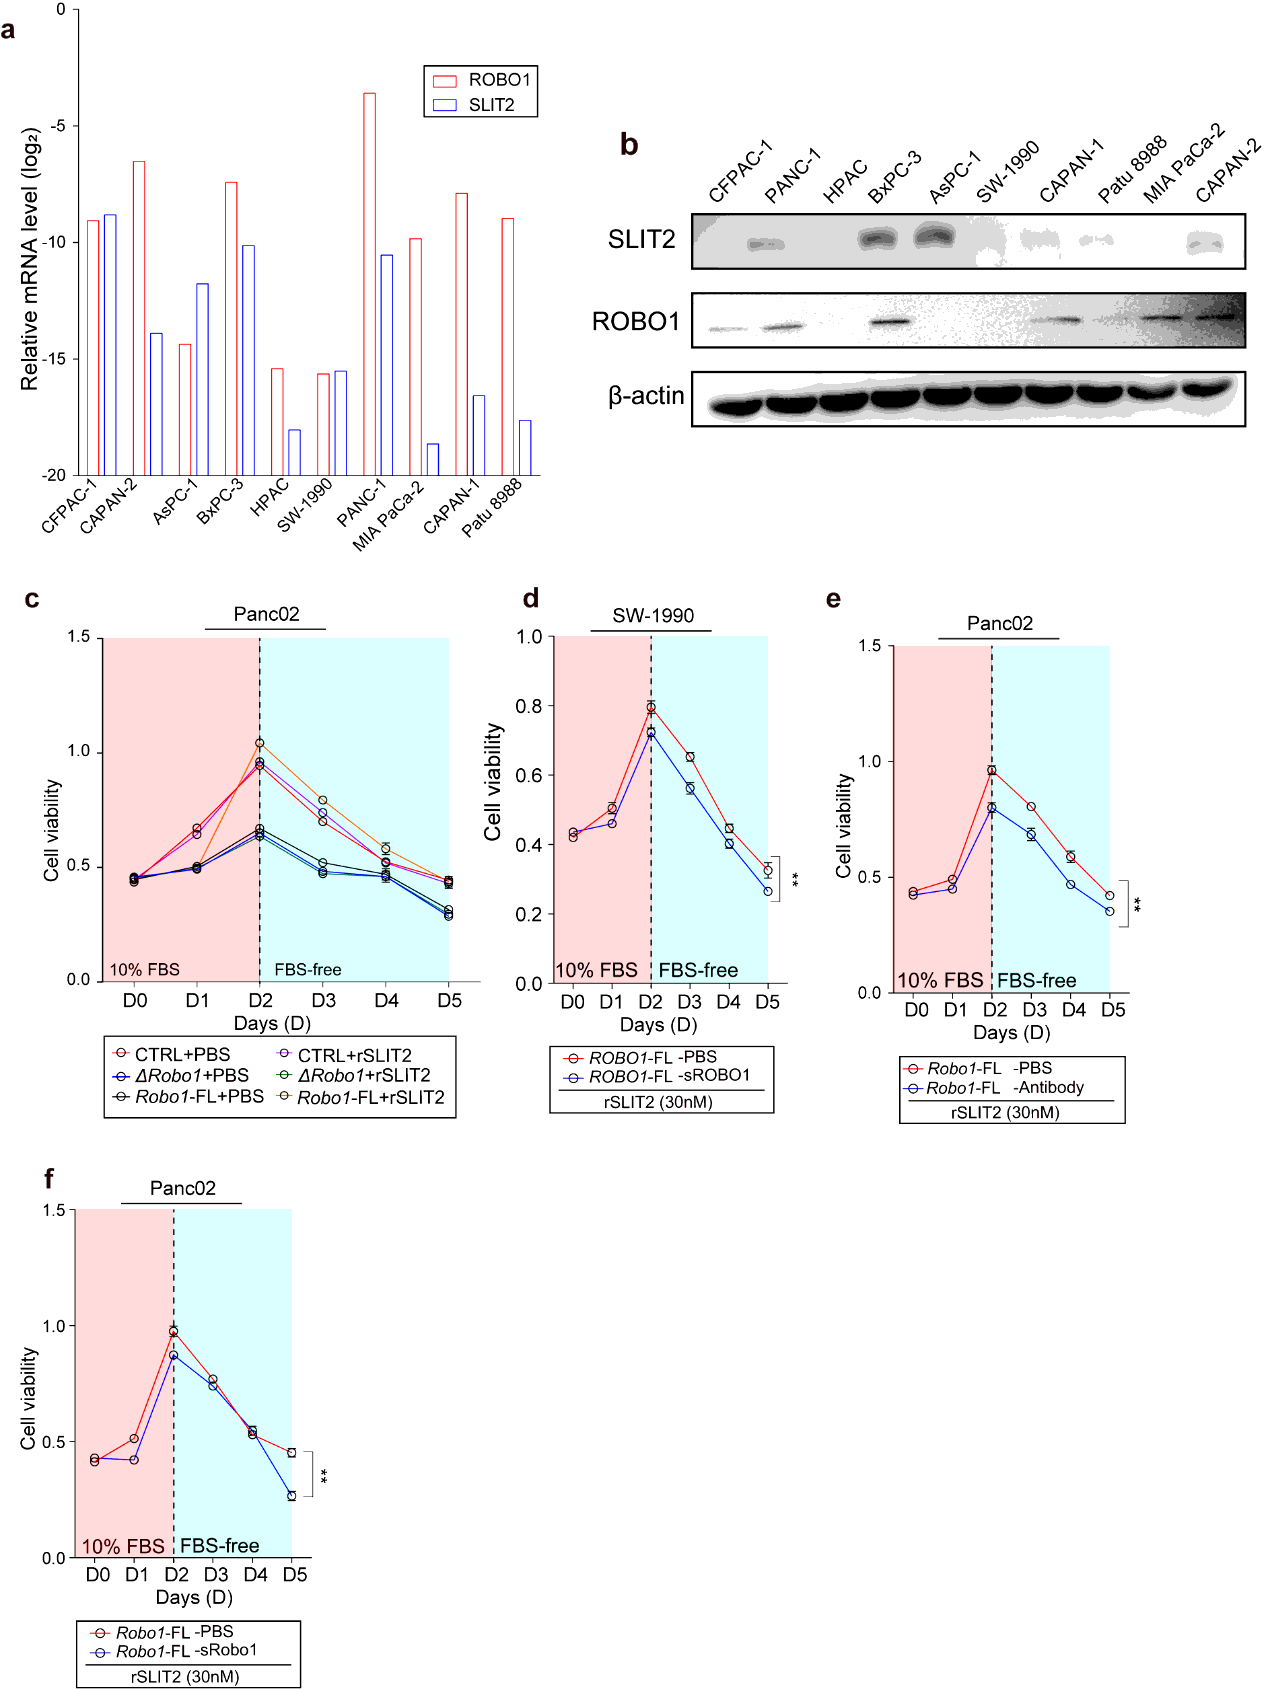
Human PDAC cell lines PANC-1, BxPC-3, CFPAC-1, HPAC, CAPAN-1, CAPAN-2, Patu 8988, MIA PaCa-2, SW-1990 and AsPC-1 and Murine cell lines Panc02 and Kpc1199 were all preserved in -- Hospital, School of Medicine, -- University. All cells were cultured in suggested conditions following granted protocols including respective medium supplemented 10% (v/v) FBS and 1% antibiotics and kept in 37℃ humidified incubators with 5% CO2. Medium contained 4.5g/L glucose and 2mM L-glutamine when cellular function assays were performed.
Cell Transfection
For shRNA transfection, lentivirus carried shRNA sequences were in Table. 1
For negative control, scramble shRNA targeting no known genes were also designed and used.
For overexpression, pcDNA3.1-ROBO1-FL vector, pcDNA3.1-ΔROBO1 vector or pcDNA3.1-SLIT2 vector were utilized for lentivirus package and transfection. The empty vector was also taken out for negative control.
All transfected cells were screened with puromycin at a concentration gradient of 1µg/ml to 10µg/ml for more than at least 10 days before the transfection efficiencies were evaluated.
Cell Viability Assay.
Cells were seeded into 96-well plates. The numbers of planted cells were as follow: for human cell lines: SW-1990: 3000/well; BxpC-3: 3000/well; PANC-1: 5000/well; CFPAC-1: 6000/well; CAPAN-1: 3000/cell, HPAC: 5000/well; for murine cell lines: Panc02: 3000/well. The measurement or treatment for these cells started after overnight incubation and recognized as day 0. The consistent measurements lasted from day 0 to day 5; for cell stress exertion, culture medium in absence of FBS were performed after day 2. For rSLIT2 treatment, the concentration was 30nM in culture medium. VX-702 treatment was performed at a concentration of 5µM for normal cell viability assay and a concentration gradient of 200nM, 1µM, 5µM, 25µM, 125µM for concentration dependence test. PH-797804 treatment was performed at a concentration of 50µM for normal cell viability assay and a concentration gradient of 80nM, 400nM, 2µM, 10µM, 50µM for concentration dependence test. sROBO was performed at a concentration of 5µM in culture medium. At indicated time point, diluted CCK-8 in culture medium at a concentration of 10% (v/v) was added 100µl in every well and incubated at 37℃ for 1 hour. Cell viability was monitored using Power Wave XS microplate reader (BIO-TEK) by measuring the absorbance at 450nm. Every group contained 5 repeated wells and every experience was performed three times.
Colony Formation Assay
Panc02, Kpc1199 and SW-1990 cell lines cultured at 70% confluence were utilized for colony formation assay to ensure them at phase of logarithmic growth. Cells were detached with 0.25% trypsin/0.01% EDTA and planted in 3mm dishes in complete medium with or without rSLIT2 treatment (10nM or 30nM) respectively for growth. The numbers of planted cells were as follow: SW-1990: 4000/dish; Panc02: 3000/dish; Kpc1199:3000/dish. The medium was changed every 3 days. All cells were then fixed in 4% paraformaldehyde for 30 mins and stained by crystal violet. The measurement of the results was performed by Image J via calculating the pixels of staining area.
Cell Apoptosis Assay
Cell apoptosis measured by Caspase-3/7 Activity Kit: SW-1990CTRL, SW-1990ΔROBO1 and SW-1990ROBO1−FL were planted at a concentration of 4000/well into 96-well plates. Serum starvation was performed for 48 hours after 3-day growth with or without 30nM rSLIT2 administration. Then the operation and measurement of the activity of Caspase -3/7 was performed strictly according to manufacturer’s guidance.
Cell apoptosis measured by Annexin V & propidium iodide (PI) staining: SW-1990CTRL, SW-1990ΔROBO1 and SW-1990ROBO1−FL were detached with 0.25% trypsin/0.01% EDTA in 1×PBS after treatment with or without rSLIT2 administration (10nM or 30nM). Then suspended cells were harvested in DMEM and centrifuged at 800rpm for 3 minutes. These cells were then stained with 3.5µl Annexin V and 3.5µl PI diluted in 100µl binding buffer after 1×PBS washing. Flow cytometry (BD) was performed to analyze after incubation of cells for 20 minutes at 25℃.
Cell Apoptosis measured by Terminal deoxynucleotidyl transferase (TdT) dUTP nick-end labeling (TUNEL) assay: all steps were strictly conducted in accordance with instructions.
Quantitative Real-time PCR. Total RNA extraction was performed using the Trizol reagent followed by reversely transcription to harvest the cDNA. 7500 Real-time PCR system (Applied Biosystems, USA) was used to performing the qPCR at recommended cycling settings. The conditions were 1 initial cycle at 95℃ for 2 min, 35 cycles of 5
sec at 95℃ and 31 sec at 60℃. 2−ΔCTmethod was utilized for evaluating and normalization to 18S mRNA levels when relative mRNA expressions were calculated.
The primers mentioned were listed in Table. 2.
Western Blotting. For cell protein extraction, cells were lysed in lysis buffer contained Cell Lysis Buffer for Western and IP (New Cell & Molecular Biotech; P70100) and Protease and Phosphatase Inhibitor Cocktail (New Cell & Molecular Biotech; P002) on ice for 10 min before centrifuged at 12,000×g for 15 min at 4℃. For tissue protein extraction, tissues were lysed in lysis buffer of volume at 10×weight of tissue(g) ml, which contained NCM RIPA Buffer (New Cell & Molecular Biotech; WB3100) and Protease and Phosphatase Inhibitor Cocktail on ice for 15 min before centrifuged at 13,500×g for 20 min at 4℃. The supernatants were collected, and the protein concentration was measured by BCA Protein Assay Kit (Pierce Biotechnology) followed by standardization. SDS-PAGE Sample Loading Buffer, 5× (Beyotime; P0015) was added before boiling water bath for 10 min. Especially, the cytoplasmic and nuclear protein extraction were performed using NE-PER™ Nuclear and Cytoplasmic Extraction Reagents (Thermo Fisher Scintific) and strictly followed the guidance of product. Protein lysates were separated by 8-12% SDS-PAGE gel electrophoresis followed by transferring onto NC membrane. For normal proteins, skimmed milk powder (Invitrogen) diluted into TBST (containing 1‰ Tween 20) at a concentration of 5% and for phosphorylated proteins, BSA (Sangon) powder diluted into TBST at a concentration of 5% were utilized to perform blockage for 1-2 hour at room temperature. Various primary antibodies were used as follow: ROBO1 (N-Terminal) (1:500), ROBO1 (C-Terminal) (1:1000), SLIT2 (1:1000), ROBO2 (1:1000), ROBO3 (1:500), P-MEK3(S189/T193)+P-MEK6(S207/T211) (1:500), MEK3+MEK6 (1:1000), p38α (1:1000), P-p38(T180+Y182) (1:1000), β-Actin (1:10000), GSK3α/β (1:1000), P-GSK3α/β(Y216/Y279) (1:1000), c-jun (1:1000), P-c-jun(S63) (1:1000), JNK(1:1000), P-JNK (T183/Y185), ERK1/2(1:1000), P-ERK1/2(T202/Y204). Membranes after overnight incubation with primary antibodies diluted into Universal Antibody Diluent (New Cell & Molecular Biotech; WB500D) were probed by secondary antibodies. Secondary antibodies were utilized as follow: HRP-conjugated anti-Goat (1:5000), HRP- conjugated anti-Rabbit (1:1000), HRP- conjugated anti-Mouse (1:1000), Alexa Fluor® 680-conjugated anti-Rabbit (1:15000), Alexa Fluor® 790-conjugated anti-mouse (1:15000). For HRP-conjugated secondary antibody incubated membranes, Lumi Q ECL reagent solution kit (Share-Bio) was performed to detected by ChemiDocTM XRS+ system (BIO-RAD). The exposure was from 1 s and 1 time per second. For Alexa Flour®-conjugated secondary antibody incubated membranes, bound secondary antibodies were detected by Odyssey imaging system (LI-COR Biosciences, Lincoln, NE).
Dynabead Immunoprecipitation
Primary antibodies or IgG were diluted in 200µl icy PBST (0.02% Tween 20) to the same concentration. 50µl protein G Dynabeads were precleaned and mixed with diluted antibodies or IgG to rotate at room temperature for 25 min. Various primary antibodies were used as follow: ROBO1 (N-Terminal) (1:50), ROBO1 (C-Terminal) (1:100), p38α (1:100), MEK3/6 (1:50).
Cells were lysed in lysis buffer contained Cell Lysis Buffer for Western and IP (New Cell & Molecular Biotech; P70100) and Protease and Phosphatase Inhibitor Cocktail (New Cell & Molecular Biotech; P002) on ice for 10 min before centrifuged at 12,000 rpm for 15 min at 4℃. Then lysates were mixed with antibody-beads at room temperature for 30-60 min followed by immunoblotting assessment.
Statistical Analysis
Software IBM SPSS statistics 19.0 and GraphPad 7.0 were used in this study. Data presented were mean ± S.E.M. Two-tailed Student’s t-test was used for evaluation of differences between two groups. For evaluations of cell viability or tumor growth, repeat measure ANOVA was performed.