Nickel-iron based layered double hydroxides (NiFe LDH) have attracted tremendous research and industrial interests for oxygen evolution reaction electrocatalysis (OER). However, methodologies on simultaneous multi-regulations remain scarce. Herein, we report a versatile polyoxometallic acids (POMs) etching approach for ingeniously designing NiFe LDH, including morphological nanolayers tailoring, reconfiguration of Fe3+ and α-Ni(OH)2 active species, creating multiple vacancies of Ni, Fe and O and manufacturing interlayered POM polyanionic clusters as surface kinetic accelerators. Our experimental and theoretical data reveal that the key influencing factors are simultaneously controlled, resulting in synergistical enhancement with electrocatalytic OER activity of η10 = 206 mV, stability (negligible change of η500 for 24 h), and turnover frequency value (TOFFe, mol) of 2.03 s− 1. To elucidate the evolution, we derive an empirical formula to quantitatively identifying the key performance-determining factors, coinciding with the work and most of literature data. The expression offers an opportunity for first and fast reliability on materials screening. Moreover, the electrocatalyst is further produced on a large scale with low cost and high performance, demonstrating its feasibility of promising configuration of NiFe LDH-PMo12(+) ‖ Ni@NiFe LDH(-) for practical anion-exchange membrane (AEM)-electrode-stack cells water electrolysis.
Article
Polyoxometallic chemistry towards all-in-one layered double hydroxides for boosting oxygen evolution electrocatalysis
https://doi.org/10.21203/rs.3.rs-763634/v1
This work is licensed under a CC BY 4.0 License
Version 1
posted
You are reading this latest preprint version
oxygen evolution electrocatalysis
layered double hydroxide
polyoxometallic chemistry
AEM stack electrolyzer cell
quantitative prediction
Oxygen evolution reaction (OER) plays a pivotal role in the anodic reaction of various electrochemical systems for renewable energies conversion and storage1-3. However, the complicated multiple proton/electron processes requires efficient electrocatalysts to accelerate the sluggish reaction kinetics 4, 5. In this regard, Ir or Ru based noble metal oxides are often employed as highly active electrocatalysts for OER, but their limited earth reserves and high cost hinder the large-scale application6, 7. Alternatively, the earth-abundant OER catalysts composed of 3d transition metal elements (such as Fe, Co, Ni, Mn, etc.) were extensively appraised in recent years8, 9. In particular, owing to the unique layered structure and tunable electronic structure, the NiFe layered double hydroxides (NiFe LDH) with increased activity and stability have been explored 9, 10.
So far, various strategies have been introduced to modulate the electrochemical OER performance of NiFe LDH by construction hierarchical nanostructures11-13, creation defects via chemical liquid etching, plasma or laser technologies14-16, regulation electron structure through host metal cations and intercalated counter-anions substitution17, and incorporating dopants18, 19. Taking the advantage of intrinsic alkaline property of NiFe LDH, there is a rising trend on fast aqueous chemical acid etching 20-23. Compared with traditional chemical exfoliation method, acid etching has the advantages of less time-consuming and lower toxicity 14. However, the etching of NiFe LDH with common inorganic acids mainly makes use of the acidity, and it is hard to modulate the valences of compositional elements, which are usually the catalytic sites. Moreover, the dominant or even the synergistic effect of multiple key factors on electrocatalytic properties remains elusive. Polyoxometallic acids (POMs), a vast class of well-defined transition metal-oxygen clusters with tunable redox properties and strong acidity, have been widely explored as molecular catalysts for various acid and oxidation reactions 24-26. It has been reported that in OER application, the nature of polyanionic clusters makes it easy to selectively incorporate the desired cations close to the active sites27, 28. However, there are still few studies on the comprehensive consideration of the influence of the acidity and oxidization properties of POMs on the active sites of the target catalyst. Therefore, an all-in-one strategy through effective acid etching is highly demanded for simultaneously re-constructing the morphology, active species ratio and electronic configuration of the electrocatalyst.
Herein, we report for the first time an all-in-one strategy of POMs etching to construct highly efficient NiFe LDH for oxygen evolution electrocatalysis. We found that the PMo12-eched NiFe LDH exhibited the highest catalytic activity and excellent stability. Combining theoretical and experimental approaches, deep understand on the intrinsic activity origin with POMs etching is established. Also, we derive a novel analytical expression based on a more advanced model which considers performance dependence on influencing factors of the content of Fe3+, α-Ni(OH)2 and oxygen vacancy. The universal empirical equation is useful for quickly predicting the performance, providing a first reliability test for experimental data. Towards practical AEM electrolyzer cell applications, a promising electrodes configuration of NiFe LDH-PMo12(+) ‖ Ni@NiFe LDH(-) were studied.
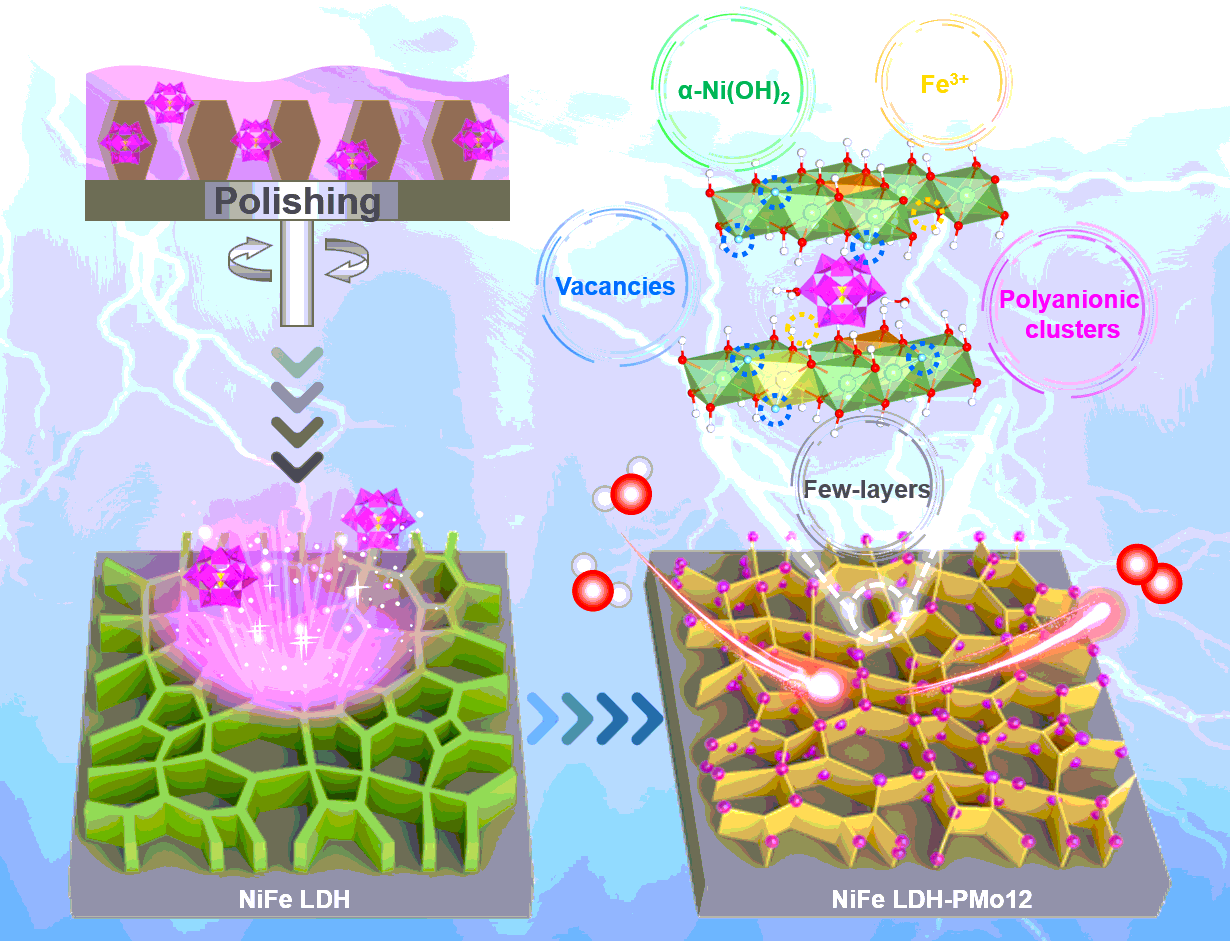
Materials synthesis and characterization. Schematical illustration for the preparation of NiFe LDH-POMs is shown in Fig. 1a. The NiFe LDH was firstly grown on nickel foam (NF) via a simple electrodeposition method as reported elsewhere,6, 29 followed by representative POMs etching. Three typical Keggin-structured POMs were chosed, which are phosphotungstic acid (pure PW12), tungstosilicic acid (pure SiW12) and phosphomolybdic acid (pure PMo12). Meanwhile, the control samples etched by common inorganic acids of sulfuric acid (pure H2SO4), hydrochloric acid (pure HCl) and nitric acid (pure HNO3) were also prepared, namely NiFe LDH-H2SO4, NiFe LDH-HCl and NiFe LDH-HNO3, respectively. The detailed preparation procedure is described in the Methods section and Supplementary Information.
The structure and morphology evolution of NiFe LDH-POMs are characterized by scanning electron microscope (SEM)/energy dispersive X-ray spectroscopy (EDX), transmission electron microscope (TEM), atomic force microscope (AFM) and the spherical aberration corrected TEM (ACTEM). The SEM images and EDX mapping analysis results (Supplementary Figs. 1 and 2) shows the cross-linked NiFe LDH nanosheets with layer thickness of < 5 nm are uniformly and vertically grown on NF, but accompanied by a large faction of surface NiFe LDH microspheres, which greatly detrimental for charge transfer capability and OER performance. And can be polished finely to a different extent after the etching treatment (Supplementary Fig. 1b-1g). Especially in NiFe LDH-PMo12, the nanosheet arrays with reduced thickness become sparse and providing plentiful mass transfer spaces (Supplementary Fig. 1d4 and d5). It is noteworthy that serious nanosheet arrays loss is observed in cases of H2SO4 and HNO3 etching (Supplementary Fig. 1e and 1g). Further TEM observations also reveal the effective chemical thinning function of PMo12, which is also evidenced by the atomic force microscope (AFM) (Fig. 1c and e, Supplementary Fig. 3e). The thickness of the NiFe LDH-PMo12 is significantly reduced in the range of 2.0 ~ 3.6 nm (2 ~ 4 atomic layers), with respect to pristine one (3.5 ~ 4.4 nm, 4 ~ 6 atomic layers) (Supplementary Fig. 3a and b). The high-resolution TEM (HRTEM) image in Fig. 1b and d and the corresponding selected-area electron diffraction (SAED) patterns (inset of Fig. 1b and d) show the formation of NiFe LDH phase. A blurred diffraction ring can be found from SAED pattern of NiFe LDH-PMo12, as compared to the NiFe LDH with the bright diffraction spots. This implies that PMo12 etching decreases the crystallinity of NiFe LDH, thus accelerating OER kinetics30. The EDX mapping shows the uniform distribution of Ni, Fe, Mo and P elements in NiFe LDH-PMo12 (Supplementary Fig. 3c), confirming the decoration of PMo12 polyanionic clusters into the nanosheet arrays. The detailed EDX elemental analysis (Supplementary Fig. 3d) shows that the P/Mo ratio of 1:1.4 which is far higher than the nominal ratio of 1:12 in pure PMo12. It may be inferred that the acid-base reaction between PMo12 and NiFe LDH leads to the partial disintegration of PMo12, and a good deal of n(PO4)3− structural building units are anchored. To further resolve the structural variation, we employed the atomic-resolution HAADF-STEM image using ACTEM. Figure 1f and g show the formation of metal (Ni or Fe) vacancies in the NiFe LDH as indicated by yellow dotted circle, which is also solidly proved by the integrated intensity distribution profile of the atoms in the yellow dashed box.
In agreement with the SAED results, X-ray diffraction (XRD) patterns of the as-synthesized samples (Supplementary Fig. 4a) reveal the reduced nanosheets both in size and crystallinity for NiFe LDH-PMo12, since the diffraction peaks of (01n) planes (JCPDS #51–0463) become lower and border. Moreover, a negative shift of ~ 0.4° for (006) peak is clearly observed in NiFe LDH-PMo12, which are also found in control powder-form samples. The resultant increase of inter-layer distance can be ascribed to the inter-layer anion exchange of PMo12 polyanionic clusters with inherent interlayered anions (e. g. NO3−, SO42−). The Fourier transform infrared spectroscopy (FTIR) spectra (Supplementary Fig. 4b and Supplementary Fig. 5a) and Raman spectra (Supplementary Fig. 4c and Supplementary Fig. 5b) of the as-synthesized samples also confirm the reduction of nanosheets thickness and existence of ion-exchanged PMo12 polyanionic clusters.
To gain insights into the chemical composition and oxidation states of Ni, Fe and O elements, the X-ray photoelectron spectroscopy (XPS) was carried out (Supplementary Fig. 6). Surprisingly, the amount of α-Ni(OH)2 is tremendously increased from only 8.6 % in NiFe LDH to 43.7% in NiFe LDH-PMo12. The same rising trend is also observed in other controlled samples (Supplementary Fig. 6a). Since α-Ni(OH)2 is easier to transform into γ-NiOOH than β-Ni(OH)2, more α-Ni(OH)2 would greatly contribute to prompt OER activity31, 32. The calculated ratios of α-Ni(OH)2 to β-Ni(OH)2 are shown in Fig. 2a, and the highest ratio is obtained in NiFe LDH-PMo12. After the PMo12 etching, a 0.6 eV shift of Fe 2p3/2 peak towards higher binding energy (Supplementary Fig. 6b) suggests the transformation of Fe2+ into Fe3+ accompanied by the formation of Fe vacancies for charge neutrality33, 34. Similarly, the phenomenon is also be observed in other controlled samples (Supplementary Fig. 6b), and the highest ratio of Fe3+ to Fe2+ has been found for NiFe LDH-SiW12 (Fig. 2a). As shown in Supplementary Fig. 7, all these POMs possess oxidation peaks but no reduction peaks, which prove their irreversible oxidation properties. The order of oxidation ability is in a sequence of pure PW12 (0.11 V vs. RHE) < pure PMo12 (0.13 V vs. RHE) < pure SiW12 (0.16 V vs. RHE), which is consistent with the change trend of Fe3+ content in Fig. 2a.
The Mo 3d spectrum of NiFe LDH-PMo12 have slight negative shifts of 0.3 eV as compared to that in pure PMo12 (Supplementary Fig. 4d). It indicates a strong influence of Mo ions on the electronic structure of NiFe LDH, that is, the electron transfer from Fe2+ to Mo6+. The peak located at 133.84 eV in P 2p spectrum (Supplementary Fig. 4e) shows the present of PO43− both in pure PMo12 and NiFe LDH-PMo12. The O 1s XPS peak with broad and asymmetrical shape can be deconvoluted into four peaks (Supplementary Fig. 6c), i.e., OI (529.68 eV) for oxygen-metal bonds (M-O) in the lattice, OII (531.26 eV) for metal-hydroxyl groups (M-OH), OIII (531.70 eV) for oxygen vacancies with low oxygen coordination, and OIV (532.98 eV) for the loosely bound oxygen species such as NO3−, SO42−, CO32− or surface-adsorbed H2O35. We note that, the OIII ratio in NiFe LDH-PMo12 (23.66%) is obviously higher than that in NiFe LDH (22.53%), implying the generation of surface oxygen vacancies (Fig. 2a)35, 36.
We further conducted the electron paramagnetic resonance (EPR) spectroscopy to verify the oxygen vacancy levels (Fig. 2b). The EPR signal intensities of the as-etched NiFe LDH samples at g = 2.004, corresponding to structural defects induced oxygen vacancies, are obviously higher than that of NiFe LDH. Specially, the peak intensity of oxygen vacancies is nearly twice higher in NiFe LDH-PMo12 while reach the highest value in NiFe LDH-HNO3 (Fig. 2b). This is consistent with the XPS results. The EPR signal at g = 2.16 and g = 4.32 can be ascribed to Fe3+ species (Supplementary Fig. 4f), since Fe2+ species cannot be detected by EPR. The oxidation state of Ni remains unchanged after POMs and common inorganic acids etching. The amount of Fe3+ is increased after PMo12 etching as evidenced by the increased EPR signal peak intensity. The presence of Fe vacancies is also determined by inductively coupled plasma optical emission spectroscopy (ICP-OES), showing that the Fe concentration is relatively lower in all of the as-etched samples than the pristine one (Supplementary Fig. 9a).
Electronic structure analysis. To make more clear the effects of multi-skilled POMs on the local atomic coordination and electronic structure of NiFe LDH-PMo12, the X-ray absorption spectroscopy (XAS) analysis (Fig. 2c-g and Supplementary Fig. 8) was performed to probe the local atomic structures around Mo, Ni and Fe atoms. Figure 2c shows the Mo K-edge X‐ray absorption near‐edge structure (XANES) spectra. The absorption edge for NiFe LDH-PMo12 shift to lower position as compared with that of MoO2 and pure PMo12, suggesting a partial reduction of the electron density of Mo atoms in NiFe LDH-PMo12. This indicates the existence of three species of Mo4+, Mo5+ and Mo6+, consistent with the XPS results. As observed in the Fourier transform (FT) Mo K-edge extended X-ray absorption fine structure (EXAFS) spectra (Fig. 2d) of NiFe LDH-PMo12 as well as commercial Mo foil, MoO3, pure PMo12, FeMoO4 and MoO2 samples, two different peaks located at ~ 1.79 Å and ~ 3.48 Å for NiFe LDH-PMo12 are assigned to the features of Mo-O and Mo-O-Mo bonds, respectively. And this corresponds with the structure of Mo in pure PMo12. In collaboration with above XRD, FTIR and Raman data, a fraction of Keggin structured PMo12 is confined between the LDH layers for NiFe LDH-PMo12, thus increasing the interlayer distance and form the α-Ni(OH)2 species. It is worth noting that the intensity of the Mo-O-Mo bond is significantly weaker than that of pure PMo12. This may be because the atomic weight of Fe is smaller than that of Mo, which is similar to the Mo-O-Fe bond in FeMoO4 (~ 3.27 Å). This also verified that the MoO42− clusters are chemisorbed on the NiFe LDH surface, which was consistent with the XPS results. Moreover, the results of the full-range wavelet transform representation of the EXAFS signal (Fig. 2e-g and Supplementary Fig. 8f-j) show that in the coordinate system composed of k space and R space, the Mo-O-Mo bond in pure PMo12 is located at ~(10.43, 3.71), and the Mo-O-Fe bond in FeMoO4 is located at ~(8.83, 3.39), and the Mo-O-Mo(Fe) bond in LDH-PMo12 is located at ~(9.66, 3.54), which further confirms that there are both Mo-O-Mo and Mo-O-Fe in NiFe LDH-PMo12. The k2‐weighted XAFS χ(k) versus reciprocal wave vector (Supplementary Fig. 8e) indicates good qualities of all the data.
The Ni K-edge X‐ray absorption near‐edge structure (XANES) spectra of NiFe LDH-PMo12 and NiFe LDH, as well as commercial Ni foil, NiO and Ni(OH)2 as reference are shown in Supplementary Fig. 8a. The overlapped XANES spectra of NiFe LDH-PMo12, NiFe LDH, NiO and Ni(OH)2 samples reveal that Ni2+ remains the dominant valence state of NiFe LDH-PMo12 and NiFe LDH. As observed with Ni K-edge EXAFS (Supplementary Fig. 8b), the first-shell peak at ~ 1.87 Å, representative of the Ni-O bond. The lower intensity in NiFe LDH-PMo12 and NiFe LDH samples than that of Ni(OH)2, suggesting a lower metal-oxygen coordination number and more oxygen vacancies37. Compared with NiFe LDH, the bond distance of second-shell peak at ~ 2.96 Å (Ni-O-Fe (Ni) bond) increases in NiFe LDH-PMo12 by ~ 0.02Å, indicating the formation of α-Ni(OH)2 in NiFe LDH-PMo1238. Supplementary Fig. 8c shows the Fe K‐edge XANES spectra of NiFe LDH-PMo12 and NiFe LDH, as well as commercial Fe foil, Fe2O3, FeO, and Fe(OH)3 samples, indicating the Fe of NiFe LDH-PMo12 and NiFe LDH are in Fe3+ oxidation stat. Two shell peaks at ~ 1.83 and ~ 2.97 Å represents of Fe-O and Fe-O-Ni are observed in Fe K-edge EXAFS (Supplementary Fig. 8d). Similar to Ni-O-Ni (Fe), slight positive shift is also found in Fe-O-Ni, which indicates the formation of more α-Ni(OH)2 species.
Electrocatalytic OER catalysis. Figure 3a shows OER cyclic voltammetry (CV) curves of the as-etched samples. The required overpotentials to deliver current densities of 10, 100 and 500 mA·cm− 2 are given in Fig. 3b. Besides the Ni2+/3+ redox peak at around 1.4 V vs. RHE, we can find that the OER performance of NiFe LDH-PMo12 is greatly enhanced, that is, the lowest overpotentials (η) of only 206 and 249 mV at the current densities of 10 and 100 mA cm− 2, respectively. In contrast, the η10 and η100 are observed at 213 and 258 mV for NiFe LDH, 286 and 353 mV for IrO2, respectively. More remarkably, only a very small overpotential of 305 mV can drive high current density of 500 mA cm− 2 for the NiFe LDH-PMo12, which is significantly superior to 339 mV (η500) for pristine NiFe LDH and most reported data in literature39–41. Similarly in the control samples, the powder-form NiFe LDH-PMo12 shows η10 and η100 decrease by 31 and 62 mV as comparison with the corresponding powder-form NiFe LDH, respectively, unveiling the fast and versatile POMs etching approach to tailor NiFe LDH based materials (Supplementary Fig. 10). Figure 3d and Supplementary Table 4 show that the NiFe LDH-PMo12 yields the lower Tafel slope of 47.5 mV·dec− 1, which is much smaller than the NiFe LDH (57.6 mV·dec− 1) and IrO2 (73.6 mV·dec− 1). The fastest OER kinetics is most favorable for the inherent OER activity of NiFe LDH-PMo12 and the rate-determining step (RDS) is the third electron transfer step9. To further deepen the understanding of the OER performance evolution, detailed comparison with the data recently reported in the literature is given in Fig. 3c and Supplementary Table 3. We can evidently conclude that the POMs etched catalysts affords an extraordinary OER performance, outperforming many state-of-the-art noble metal-free OER catalysts in alkaline. The stability test at a constant current density of 500 mA·cm− 2 confirms the robust electrochemical stability of the NiFe LDH-PMo12 for 24 h (Supplementary Fig. 9b). Interestingly, the OER activity increases from initial 1.666 V vs. RHE to 1.638 V vs. RHE after 24 h. After electrochemical OER tests, the same Raman peaks located at 475 and 552 cm− 1 can be attributed to the OER active phase of γ-NiOOH (Supplementary Fig. 5c) 42, 43. Next, the electrochemical impedance spectroscopy (EIS) is used to measure the OER catalytic charge transfer resistance (Rct) (Fig. 3e and Supplementary Table 4). An equivalent electrical circuit model is developed to fit the Nyquist plots (inset in Fig. 3e), which consists of featuring solution resistance (Rs), OER charge transfer resistance (Rct1) and Ni2+/3+ redox charge transfer resistance (Rct2). The NiFe LDH-PMo12 possesses smaller Rct1 (0.35 Ω) than that of pristine NiFe LDH (1.70 Ω). Such a significant decrease in Rct can infer to the fast electron transfer and favorable reaction kinetics, thus lead to a small Tafel slope.
The turnover frequency (TOFFe, mol) values are estimated, taking into account solely the intrinsic activity of Fe sites (Supplementary Note 1). Remarkably, the NiFe LDH-PMo12 catalyst displays high intrinsic activity with TOFFe, mol values up to 2.03 s− 1 at the overpotential of 350 mV (Fig. 3f), which is nearly 2 times higher than that for NiFe LDH (0.99 s− 1). The content of W elements in NiFe LDH-PW12, NiFe LDH-SiW12 and the content of Mo elements in NiFe LDH-PMo12 are < 0.005 mg·cm− 2, indicating that polyanionic clusters of PW12, SiW12 or PMo12 existed in trace amounts (Supplementary Table 1). The intercalation of PMo12 polyanionic clusters was further confirmed by ICP-OES measurements, showing that the atomic ratio of Ni/Fe and P/Mo are nearly equal to 1:7 and 1:6 in powder-form NiFe LDH-PMo12 (Supplementary Table 2). The P/Mo atomic ratio in TEM observation result (P/Mo ~ 1:1.4) is far higher than that of 1:12 in pure PMo12. It is reasonable that the residual P species are preserved with partial decomposition of PMo12, while a portion of stable PMo12 polyanionic clusters are between the nanosheet layers.
Furthermore, we demonstrated the feasibility of large-scale production of NiFeLDH-PMo12 electrodes for practical applications into scale-up anion exchange membrane (AEM) electrolyzer cells. Figure 5c shows the as-prepared NiFeLDH-PMo12 electrodes with different sizes between Ф50 to Ф180 mm in diameter and 30 × 30 mm in square, to adapt the different electrolyzer cells. By assembling NiFe LDH-PMo12 as anode and Ni@NiFe LDH from our earlier work44 as cathode (NiFe LDH-PMo12(+) ‖ Ni@NiFe LDH(-)), the cell voltages of only 1.57(6), 1.76(9) and 1.85(0) V are needed to achieve current densities of 10, 100 and 200 mA·cm− 2, respectively (Fig. 5d). Figure 5e shows the detailed configuration of our AEM electrolyzer in a sequence from left to right: cathode current collector, seal ring, titanium mesh gas diffusion layer (GDL), anion exchange membrane (AEM), NiFe LDH-PMo12 electrode, titanium mesh GDL and anode current collector.
Theoretical insights on OER activity improvement. Based on the above discussed electronic structure analysis and OER electrochemical analysis, to further understand the effect of PMo12 etching on the outstanding OER catalytic activities of the NiFe LDH-PMo12, density functional theory calculations with Hubbard-U approach (DFT + U) were conducted. Theoretically, the OER in an alkaline medium consists of four proton-transfer steps, and the adsorption energies of intermediates (*OH, *O, and *OOH) on the surface of the electrocatalyst are directly affected the OER activity. As illustrated in Fig. 4a and Supplementary Fig. 13, the first step of the OER process involves the phase transformation during which the detachment of H from the topmost surface of the regular LDH occur, NiFe LDH could be covered to γ-NiFeOOH, which has also been proved by previous works45, 46. All the simulation are carried out on the oxygen bridge between Ni and Fe atom. In order to study the influence of oxygen vacancies and MoO42− clusters on the OER activity, we established four calculation models, denoted as pristine LDH (NiFe LDH), LDH containing only oxygen vacancies (NiFe LDH + Vo), LDH containing only MoO42− clusters (NiFe LDH + Mo) and LDH containing both oxygen vacancies and MoO42− clusters (NiFe LDH-PMo12).
Based on the free energy diagram the calculated ΔGn on the four NiFe LDH (001) models is shown in Fig. 4a. The potential determining step (PDS) of NiFe LDH-PMo12 is the formation of OOH* from O* with an overpotential of 0.34 V, which consist with the RDS result from Tafel slope. In contrast, for the NiFe LDH, the overpotential increases up to 0.79 V and the PDS is OH* to O*. The decrease of overpotential after Vo and MoO42− creation on NiFe LDH implies that both Vo and MoO42− play a vital role in improving OER activity. To verify this assumption, we have performed separate calculations on the two models of NiFe LDH + Vo and NiFe LDH + MoO42−. The results show that the PDS of NiFe LDH + Vo is O* to OOH* with an overpotential of 0.68 V, and the PDS of NiFe LDH + MoO42− is the formation of O* from OH* with an overpotential of 0.51 V. In addition, a linear scaling relation between the free energies of OOH and OH on the (001) facet of NiFe LDH, NiFe LDH + Vo, NiFe LDH + MoO42− and NiFe LDH-PMo12, ΔGOOH = ΔGOH + 3.2 ± 0.2 (Fig. 4b) was found, which in good agreement with previous works47–49. Due to the competition between the free energies of the four elementary steps involved (Supplementary Table 4), the calculated overpotential η can be represented by a 2D volcano-type surface with respect to the free energy of the O and OH intermediates (Fig. 4c). As expected, too weak binding of adsorbate over the active site (higher ΔGOH and ΔGO - ΔGOH) impedes the adsorption of OH and increases the subsequent dehydrogenation barrier. On the other hand, too strong interaction (lower ΔGOH and ΔGO - ΔGOH) is detrimental for formation of the OOH intermediate and subsequent generation of O2. The best OER activity (η = 0.34 V) close to the peak of the 2D volcano plot was found on the NiFe LDH-PMo12 (001) surface (Fig. 4a). In contrast, (001) surface of NiFe LDH (Supplementary Fig. 13a), NiFe LDH + Vo (Supplementary Fig. 13b), NiFe LDH + MoO42− (Supplementary Fig. 13c) exhibit overpotentials of 0.79, 0.68 and 0.51 V, respectively, which are less active. Although the trend of the overpotentials (NiFe LDH > NiFe LDH + Vo > NiFe LDH + MoO42− > NiFe LDH-PMo12) reproduces the experimental results well, the difference between the calculated (0.34 V) and experimental (0.206 V at 10 mA·cm− 2) overpotentials for NiFe LDH-PMo12 remains, which might arise because of the simplified model used in the calculations. When comparing NiFe LDH with NiFe LDH + Vo, all of ΔGOH, ΔGO, and ΔGOOH have significant decrease, indicating stronger adsorption, which is brought by the electronic structure change arise from the Vo are introduced to the NiFe LDH (Supplementary Table 5). Moreover, compared with NiFe LDH, the ΔGO of NiFe LDH + MoO42− decreased significantly, and ΔGOH and ΔGOOH remained basically unchanged, indicating that the MoO42− group played a role in stabilizing the surface, and the electronic effect was the dominant effect and Hydrogen bond/Van der Waals weak interaction plays a role in assisting in enhancing OER activity. In addition, comparing NiFe LDH + Vo and NiFe LDH-PMo12, after adding MoO42− groups near the Vo, the changes of ΔGO and ΔGOH are limited, while GOOH are sharply decreased. This dramatic change is mainly caused by the Hydrogen bond/Van der Waals weak interaction between OOH adsorbent and MoO42− groups, with optimized ΔGOH and ΔGO - ΔGOH (Fig. 4c). At last, like the NiFe LDH and NiFe LDH + Vo case, NiFe LDH + MoO42− and NiFe LDH-PMo12, ΔGOH, ΔGO and ΔGOOH of NiFe LDH-PMo12 all have a significant decrease, mainly caused by the electronic structure change. Therefore, the theoretical results agree very well with the experiment that the OER kinetics on the electrode could be facilitated by Vo creation and MoO42− adsorption to improve the electronic conductivity along with the significantly enhanced electrocatalytic activity.
Structure-activity relationship and mechanism elucidation Fig. 5a illustrates the radar chart of the structure-activity relationship between a variety of OER dominant active species comprising Fe3+, α-Ni(OH)2 and Vo specials with OER activities. The increase in Fe3+ content is beneficial to OER, but the NiFe LDH-SiW12 with the most Fe3+ is not perform the best. NiFe LDH-PMo12 with proper Vo content and more α-Ni(OH)2 has the best OER activity. In addition, the samples etched by pure PW12, pure SiW12 and pure HNO3 have similar α-Ni(OH)2 content, Fe3+ and Vo content are different but η500 is similar. Similarly, the samples etched by pure HCl and pure H2SO4 have similar α-Ni(OH)2 content, Fe3+ and Vo content are different but η500 is similar. This may be affected by the synergistic effect of α-Ni(OH)2, Vo and Fe3+. Obviously, when the content of α-Ni(OH)2 is fixed, η decreases with the increase of Fe3+ content. If Fe3+ content is fixed, η will decrease with the increase of α-Ni(OH)2 content, but its influence is smaller than that of Fe3+. It seems that when Fe content is low (about < 30%), η and Fe content are close to linear relationship41, 50. Interestingly, however, η does not reflect a linear relationship with the total content of Fe3+ and α-Ni(OH)2 (Supplementary Fig. 11), and it is necessary to take Vo content into consideration. As listed in Supplementary Table 6 with the Vo content increasing, the η500 values first decrease and then increase. This is also validated by experimental results, showing that the NiFe LDH-HNO3 has the highest Vo content while its OER activity does not reach the maxima. It is probably due to the detrimental effect of excessive oxygen vacancies51. The Cdl values of all the as-etched samples are smaller than the pristine ones (Supplementary Fig. 12), showing the increased electrochemical active surface area (ECSA) which implies that the number of active sites reflected by has a weaker effect on OER activity than the intrinsic activity of active sites.
Toward understanding of these findings in a semi-quantitative approach, we fit η500 values with the Fe3+ (xFe) and α-Ni(OH)2 (xNi) content with a linear relationship, and the Vo content with a Gauss-like distribution relationship by using chemical descriptors and mathematical models. The comparison of η500 values obtained from the simulation and experimental are shown in the Fig. 5b. Trial-and-error verifications with other reported NiFe LDH based masterials (Supplementary Fig. 14 and Supplementary Table 8), proved that the Fe content in Fe-doped Ni(OH)2 is well-matched with the formula when the Fe content located between 0% ~ 25%52–56, except for few cases solely investigated on oxygen vacancy-dependent OER activity51. The developed formula denoted as “SICCAS equation” is as follows:

(where xFe, xNi and Vo are referred to percentage content, k, a, b, and c are defined as constants, in which c is the constant based on overpotential, Δη stands for the overpotential difference between the samples. Vo1 and Vo2 is equal to the optimum oxygen vacancy concentration multiplied by 100. Here, we take k =-0.6, a = 2, b = 1, c = 410, Δη = 50, Vo1 = 24.1 and Vo2 = 23.9. When Fe3+ is considered to be active sites, it can be equivalent to the variation of the total Fe content from 0% ~ 25%. It means that, the independent variable range of xFe range is 0% ~ 25%, xNi can vary from 0% ~ 75%, and Vo can vary from 22% ~ 26%. More mathematical details for the formula derivations are given in Supplementary Note 2 and Supplementary Table 7)
To our knowledge, this is the first time to formulate the inherent relationship between the respective content of dominant active sites (i.e., Fe3+, α-Ni(OH)2 and Vo) with η values. Accordingly, the nonlinear integral SICCAS equation will be helpful to design electrocatalysts better, pointing to an attractive computational and optimization route to NiFe LDH as well as other materials.
In summary, the work presents a multi-skilled polyoxometallic etching approach for ingeniously designing highly efficient NiFe LDH electrodes. The collective effects of morphological modification and electronic structure engineering through controlling the etching agents enable the NiFe LDH-PMo12 to emerge superior OER activities and excellent stabilities. It can be mainly attributed to the following aspects: firstly, the adjustment of the surface morphology and reduce the nanosheets thickness to ~ 2.6 nm and expose more active sites. The second is that the lattice of as-etched NiFe LDH become more disordered and more α-Ni(OH)2 phase are generated which can serve as OER active sites. Furthermore, PMo12 etching can produce proper and controllable oxygen and metal vacancies, which subtly modulates local coordination environments and electronic structures of iorn and nickel cations. Moreover, the surface-anchored PMo12 polyanionic clusters can tune the electronic configuration of NiFe LDH. Finally, the TOFFe, mol indicates the catalytic activity related with the concentration of Fe3+ sites facilitate the catalytic synergistic effect with Ni2+. Consistently, the theoretical calculation results verify the positive effects of both oxygen vacancies and PMo12 polyanionic clusters on the OER performance. The reconfiguration of OER dominant active species (α-Ni(OH)2, Fe3+ sites and oxygen vacancies) and creation of surface kinetic accelerators of PMo12 polyanionic clusters are responsible for the benchmark OER catalytic activity and duration of NiFe LDH-PMo12. Considering its low cost and ease of fabrication, the study demonstrates a promising configuration route of NiFe LDH-PMo12(+) ‖ Ni@NiFe LDH(-) towards practical AEM electrolyzer cell applications.
Acknowledgements
This work was supported by Shanghai Academic/Technology Research Leader Program (19XD1422900) and the Foundation of Shanghai Institute of Ceramics, Chinese Academy of Sciences (E11YB515). We are greatly grateful to University of Science and Technology of China for High-performance Computing, and the Shanghai Synchrotron Radiation Facility (SSRF) and Beijing Synchrotron Radiation Facility (BSRF) for X-ray absorption spectroscopy characterization.
Author contributions
P. Wang, Z. Y. Cai and X. Y. Wang conceived and designed the experiments. Z. Y. Cai, P. Wang and Y. Ya carried out the synthesis of catalysts, morphological and structural characterizations, and electrochemical measurements. J. W. Zhang conceived and performed the ex-situ XAS measurements at Advanced Photon Source and analyzed the corresponding data, and wrote part of the manuscript. P. Wang and Z. Y. Cai wrote the manuscript. All the authors checked and revised the full manuscript.
Additional information
The authors declare no competing financial interest.
Synthesis of NiFe LDH-PMo12 In a typical experiment, NiFe LDH was electrodeposited on NF in the electrolyte containing Ni(NO3)2·6H2O (0.15 M) and FeSO4·7H2O (0.15 M) with a Pt counter electrode under periodic voltage of - 0.86 and -1.1 V vs. RHE for 50 s. The obtained electrodes were followed by etching treatment with different types of etchants at pH ~ 2.5. The loading amount of NiFe LDH-PMo12 on NF was ~ 2 mg·cm−2. For the comparative study, the control electrodes were also fabricated with similar methods as described above. Further details, including the preparation of powder-form NiFe LDH and NiFe LDH-PMo12, and IrO2 electrodes are available in the Supplementary Information.
Materials characterization
The morphology and structure of the as-synthesized samples were detected with scanning electron microscopy (SEM, LEO 1530VP), transmission electron microscope (TEM, FEI Tecnai G2 F20 S-TWIN) coupled with energy dispersive X-ray spectroscopy (EDX), HAADF-STEM analyses (JEOL JEM-ARM200F S/TEM with a spherical aberration corrector) and Atomic Force Microscopy (AFM, Asylum Research Cypher ES). The phase composition and chemical bonding nature in the samples was characterized by Raman spectra (Horiba-Jobin-Yvon T64000 instrument) and Fourier Transform infrared spectroscopy (FTIR, Thermo Nicolet NEXUS 470). Surface chemical compositions of the samples were characterized by an X-ray photoelectron spectroscopy (XPS, AXIS ultra DLD, Shimazu) in a vacuum of 10-7 Pa with an Al Kα monochrome anode. The X-band Electron paramagnetic resonance (EPR) spectra were recorded on Bruker A300 spectrometers at the temperature of 100 K. The Fe contents were analyzed by Inductively Coupled Plasma-Optical Emission Spectrometry (ICP-OES, PerkinElmer Optima 2100DV).
Theoretical calculations
Vienna Ab Initio Package (VASP) to perform all the spin-polarized density functional theory (DFT) calculations within the generalized gradient approximation (GGA) using the PBE formulation. The computational details are in the Supporting Information.
X-ray absorption spectroscopy
The X-ray absorption find structure spectra (XAFS) Mo K-edge were collected at BL14W1 beamline of Shanghai Synchrotron Radiation Facility (SSRF) while Ni, Fe K-edge were collected at 1W1B beamline of Beijing Synchrotron Radiation Facility (BSRF). The data were collected in transmission mode or fluorescence mode using a Lytle detector while the corresponding reference sample were collected in transmission mode. The sample were grinded and uniformly daubed on the special adhesive tape. The details are in the Supporting Information.
Electrochemical measurements
Electrochemical measurements were carried out on an electrochemical station (Ivium Technologies, Vertex.1A, The Netherlands) in a standard three-electrode system equipped with the as-prepared samples as the working electrode, a Φ6 mm carbon rod as the counter electrode, and a standard Hg/HgO electrode as the reference electrode. The OER activities were evaluated using cyclic voltammetry (CV) methods in 1 M KOH aqueous solution. To determine the double-layer capacitance values (Cdl), the CV measurements were carried out at different scan rates (from 10 to 100 mV·s-1) in a potential range from 0.927 V to 1.027 V vs. RHE. The OER stability tests were performed by chronopotentiometry method at a constant current density of 500 mA·cm-2 in 1 M KOH aqueous solution for 24 h. Electrochemical impedance spectra (EIS) were measured at an overpotential of 1.48 V vs. RHE from 0.1 Hz to 100 kHz with an amplitude of 10 mV. Notably, all the measured potentials vs. Hg/HgO were converted to RHE by the Nernst equation (ERHE = EHg/HgO + 0.0592 pH + 0.098) and except where otherwise stated, an iR compensation of 90 % was applied to all the CV curves.
- Dionigi F., et al. In-situ structure and catalytic mechanism of NiFe and CoFe layered double hydroxides during oxygen evolution. Nat. Commun. 11, 1–10 (2020).
- Roger I., Shipman M. A., Symes M. D. Earth-abundant catalysts for electrochemical and photoelectrochemical water splitting. Nat. Rev. Chem. 1, 0003 (2017).
- Seh Z. W., Kibsgaard J., Dickens C. F., Chorkendorff I. B., Norskov J. K., Jaramillo T. F. Combining theory and experiment in electrocatalysis: Insights into materials design. Science 355, eaad4998 (2017).
- Mirzakulova E., et al. Electrode-assisted catalytic water oxidation by a flavin derivative. Nat. Chem. 4, 794–801 (2012).
- Li J., et al. Breathing-Mimicking Electrocatalysis for Oxygen Evolution and Reduction. Joule 3, 557–569 (2019).
- Ng J. W. D., et al. Gold-supported cerium-doped NiOx catalysts for water oxidation. Nat. Energy 1, 16053 (2016).
- Walter M. G., et al. Solar Water Splitting Cells. Chem. Rev. 110, 6446–6473 (2010).
- Liu K., et al. The Role of Active Oxide Species for Electrochemical Water Oxidation on the Surface of 3d-Metal Phosphides. Adv. Energy Mater. 8, 1703290 (2018).
- Suen N. T., Hung S. F., Quan Q., Zhang N., Xu Y. J., Chen H. M. Electrocatalysis for the oxygen evolution reaction: recent development and future perspectives. Chem. Soc. Rev. 46, 337–365 (2017).
- Cai Z., Bu X., Wang P., Ho J. C., Yang J., Wang X. Recent advances in layered double hydroxide electrocatalysts for the oxygen evolution reaction. J. Mater. Chem. A 7, 5069–5089 (2019).
- Huang Y., Zhang S. L., Lu X. F., Wu Z. P., Luan D., Lou X. W. Trimetallic Spinel NiCo2-xFexO4 Nanoboxes for Highly Efficient Electrocatalytic Oxygen Evolution. Angew. Chem. Int. Ed. 60, 11841–11846 (2021).
- Zhang J., Yu L., Chen Y., Lu X. F., Gao S., Lou X. W. Designed Formation of Double-Shelled Ni-Fe Layered-Double-Hydroxide Nanocages for Efficient Oxygen Evolution Reaction. Adv. Mater. 32, 1906432 (2020).
- Zhu D., et al. A 2D metal-organic framework/Ni(OH)2 heterostructure for an enhanced oxygen evolution reaction. Nanoscale 11, 3599–3605 (2019).
- Hui L., et al. Overall water splitting by graphdiyne-exfoliated and -sandwiched layered double-hydroxide nanosheet arrays. Nat. Commun. 9, 5309 (2018).
- Liu R., Wang Y., Liu D., Zou Y., Wang S. Water-Plasma-Enabled Exfoliation of Ultrathin Layered Double Hydroxide Nanosheets with Multivacancies for Water Oxidation. Adv. Mater. 29, 1701546 (2017).
- Duan Y., et al. Anodic Oxidation Enabled Cation Leaching for Promoting Surface Reconstruction in Water Oxidation. Angew. Chem. Int. Ed. 60, 7418–7425 (2021).
- Li Z., Niu W., Zhou L., Yang Y. Phosphorus and Aluminum Codoped Porous NiO Nanosheets as Highly Efficient Electrocatalysts for Overall Water Splitting. ACS Energy Letters 3, 892–898 (2018).
- Chen W., et al. In Situ Electrochemically Derived Nanoporous Oxides from Transition Metal Dichalcogenides for Active Oxygen Evolution Catalysts. Nano Lett. 16, 7588–7596 (2016).
- Wang X., et al. Amorphous Multi-elements Electrocatalysts with Tunable Bifunctionality toward Overall Water Splitting. ACS Catal. 8, 9926–9935 (2018).
- Wang Y., et al. Anion Etching for Accessing Rapid and Deep Self-Reconstruction of Precatalysts for Water Oxidation. Matter 3, 2124–2137 (2020).
- Yang H., et al. Preparation of nickel-iron hydroxides by microorganism corrosion for efficient oxygen evolution. Nat. Commun. 11, 5075 (2020).
- Wang Y., Qiao M., Li Y., Wang S. Tuning Surface Electronic Configuration of NiFe LDHs Nanosheets by Introducing Cation Vacancies (Fe or Ni) as Highly Efficient Electrocatalysts for Oxygen Evolution Reaction. Small 14, 1800136 (2018).
- Zhou P., et al. Acid-etched layered double hydroxides with rich defects for enhancing the oxygen evolution reaction. Chem. Commun. 53, 11778–11781 (2017).
- Lee G. Y., et al. Spontaneous linker-free binding of polyoxometalates on nitrogen-doped carbon nanotubes for efficient water oxidation. J. Mater. Chem. A 5, 1941–1947 (2017).
- Liu R., et al. Enhanced proton and electron reservoir abilities of polyoxometalate grafted on graphene for high-performance hydrogen evolution. Energy Environ. Sci. 9, 1012–1023 (2016).
- Luo W., Hu J., Diao H., Schwarz B., Streb C., Song Y. F. Robust Polyoxometalate/Nickel Foam Composite Electrodes for Sustained Electrochemical Oxygen Evolution at High pH. Angew. Chem. Int. Ed. 56, 4941–4944 (2017).
- Blasco-Ahicart M., Soriano-López J., Carbó J. J., Poblet J. M., Galan-Mascaros J. R. Polyoxometalate electrocatalysts based on earth-abundant metals for efficient water oxidation in acidic media. Nat. Chem. 10, 24–30 (2018).
- Mukhopadhyay S., Debgupta J., Singh C., Kar A., Das S. K. A Keggin Polyoxometalate Shows Water Oxidation Activity at Neutral pH: POM@ ZIF-8, an Efficient and Robust Electrocatalyst. Angew. Chem. 130, 1936–1941 (2018).
- Yan Z., et al. Anion insertion enhanced electrodeposition of robust metal hydroxide/oxide electrodes for oxygen evolution. Nat. Commun. 9, 2373 (2018).
- Lu X., Zhao C. Electrodeposition of hierarchically structured three-dimensional nickel-iron electrodes for efficient oxygen evolution at high current densities. Nat. Commun. 6, 6616 (2015).
- Gao M., et al. Efficient Water Oxidation Using Nanostructured α-Nickel-Hydroxide as an Electrocatalyst. J. Am. Chem. Soc. 136, 7077–7084 (2014).
- Trotochaud L., Young S. L., Ranney J. K., Boettcher S. W. Nickel-Iron Oxyhydroxide Oxygen-Evolution Electrocatalysts: The Role of Intentional and Incidental Iron Incorporation. J. Am. Chem. Soc. 136, 6744–6753 (2014).
- Friebel D., et al. Identification of Highly Active Fe Sites in (Ni,Fe)OOH for Electrocatalytic Water Splitting. J. Am. Chem. Soc. 137, 1305–1313 (2015).
- Wang Y., et al. Layered Double Hydroxide Nanosheets with Multiple Vacancies Obtained by Dry Exfoliation as Highly Efficient Oxygen Evolution Electrocatalysts. Angew. Chem. Int. Ed. 56, 5867–5871 (2017).
- Liu B., et al. Iron Vacancies Induced Bifunctionality in Ultrathin Feroxyhyte Nanosheets for Overall Water Splitting. Adv. Mater. 30, 1803144 (2018).
- Asnavandi M., Yin Y., Li Y., Sun C., Zhao C. Promoting Oxygen Evolution Reactions through Introduction of Oxygen Vacancies to Benchmark NiFe-OOH Catalysts. ACS Energy Letters 3, 1515–1520 (2018).
- Wu T., et al. Iron-facilitated dynamic active-site generation on spinel CoAl2O4 with self-termination of surface reconstruction for water oxidation. Nat. Catalysis 2, 763–772 (2019).
- Mansour A. N., Melendres C. A. Analysis of X-ray Absorption Spectra of Some Nickel Oxycompounds Using Theoretical Standards. J. Phys. Chem. A 102, 65–81 (1998).
- Liu Y., et al. Corrosion engineering towards efficient oxygen evolution electrodes with stable catalytic activity for over 6000 hours. Nat. Commun. 9, 2609 (2018).
- Yu L., et al. Non-noble metal-nitride based electrocatalysts for high-performance alkaline seawater electrolysis. Nat. Commun. 10, 5106 (2019).
- Zhang B., et al. High-valence metals improve oxygen evolution reaction performance by modulating 3d metal oxidation cycle energetics. Nat. Catalysis 3, 985–992 (2020).
- Huang Z. F., et al. Chemical and structural origin of lattice oxygen oxidation in Co-Zn oxyhydroxide oxygen evolution electrocatalysts. Nat. Energy 4, 329–338 (2019).
- Qiu Z., Tai C. W., Niklasson G. A., Edvinsson T. Direct observation of active catalyst surface phases and the effect of dynamic self-optimization in NiFe-layered double hydroxides for alkaline water splitting. Energy Environ. Sci. 12, 572–581 (2019).
- Cai Z., et al. Simple and cost effective fabrication of 3D porous core-shell Ni nanochains@NiFe layered double hydroxide nanosheet bifunctional electrocatalysts for overall water splitting. J. Mater. Chem. A 7, 21722–21729 (2019).
- Friebel D., et al. Identification of highly active Fe sites in (Ni, Fe) OOH for electrocatalytic water splitting. J. Am. Chem. Soc. 137, 1305–1313 (2015).
- Zhang J., et al. Single-Atom Au/NiFe Layered Double Hydroxide Electrocatalyst: Probing the Origin of Activity for Oxygen Evolution Reaction. J. Am. Chem. Soc. 140, 3876–3879 (2018).
- Seitz L. C., et al. A highly active and stable IrOx/SrIrO3 catalyst for the oxygen evolution reaction. Science 353, 1011–1014 (2016).
- Yao Y., et al. Engineering the electronic structure of single atom Ru sites via compressive strain boosts acidic water oxidation electrocatalysis. Nat. Catalysis 2, 304–313 (2019).
- Zhang B., et al. Homogeneously dispersed multimetal oxygen-evolving catalysts. Science 352, 333–337 (2016).
- Chung D. Y., et al. Dynamic stability of active sites in hydr(oxy)oxides for the oxygen evolution reaction. Nat. Energy 5, 222–230 (2020).
- Miao X., et al. The role of oxygen vacancies in water oxidation for perovskite cobalt oxide electrocatalysts: are more better? Chem. Commun. 55, 1442–1445 (2019).
- Hung S. F., et al. Unraveling Geometrical Site Confinement in Highly Efficient Iron-Doped Electrocatalysts toward Oxygen Evolution Reaction. Adv. Energy Mater. 8, 1701686 (2018).
- Swierk J. R., Klaus S., Trotochaud L., Bell A. T., Tilley T. D. Electrochemical Study of the Energetics of the Oxygen Evolution Reaction at Nickel Iron (Oxy)Hydroxide Catalysts. J. Phys. Chem. C 119, 19022–19029 (2015).
- Zhao D., Jiang K., Pi Y., Huang X. Superior Electrochemical Oxygen Evolution Enabled by Three-Dimensional Layered Double Hydroxide Nanosheet Superstructures. Chemcatchem 9, 84–88 (2017).
- Zhou Q., et al. Active-Site-Enriched Iron-Doped Nickel/Cobalt Hydroxide Nanosheets for Enhanced Oxygen Evolution Reaction. ACS Catal. 8, 5382–5390 (2018).
- Zhu K., et al. Atomic-scale topochemical preparation of crystalline Fe3+-doped β-Ni(OH)2 for an ultrahigh-rate oxygen evolution reaction. J. Mater. Chem. A 5, 7753–7758 (2017).
There is NO Competing Interest.
- ESI.docx
- Onlinefloatimage7.png
TOC: Multi-skilled polyoxometallic acid (POMs) etching approach to ingeniously designing NiFe LDH as a promising electrode polishing technique towards industrial AEM electrolyzer applications.