Preparation and cultivation of monocytes
Monocytes were isolated from buffy coats of anonymous healthy erythrocyte donors (Transfusionsmedizin, Suhl, Germany) by density gradient centrifugation and adhesion to polystyrene cell culture dishes in Dulbecco’s modified minimal essential medium (DMEM, Pierce biotechnology, Rockford, USA) without serum. Lymphocytes were removed by thorough washing with 4°C Dulbecco’s modified phosphate buffered saline (PBS). Cultures only included monocytes of a single donor. All experiments were replicated with the indicated number of donors (biological replicates). Monocytes were then cultivated at 37°C and 5% CO2 in RPMI medium (Promocell, Heidelberg, Germany) containing 10% fetal calf serum (FCS, Biochrome, Berlin, Germany) and differentiated into macrophages by adding 40 ng/ml GM-CSF (Immunotools, Friesoythe, Germany). 50% of the medium was exchanged after four days. To avoid interference of endogenous Aβ peptides with those contained in FCS, the medium was changed to serum-free AIM-V medium (Thermo scientific, Dreieich, Germany) at the 7th day in vitro (div).
An inflammatory reaction was induced either by adding 1 µm polystyrene particles (7/cell) (Polysciences, Hirschberg, Germany) or 10 ng/ml lipopolysaccharide (LPS, Sigma-Aldrich, Munich, Germany) to the cell culture medium at the 9th div, 24 h before measuring cytokine secretion or phagocytotic activity.
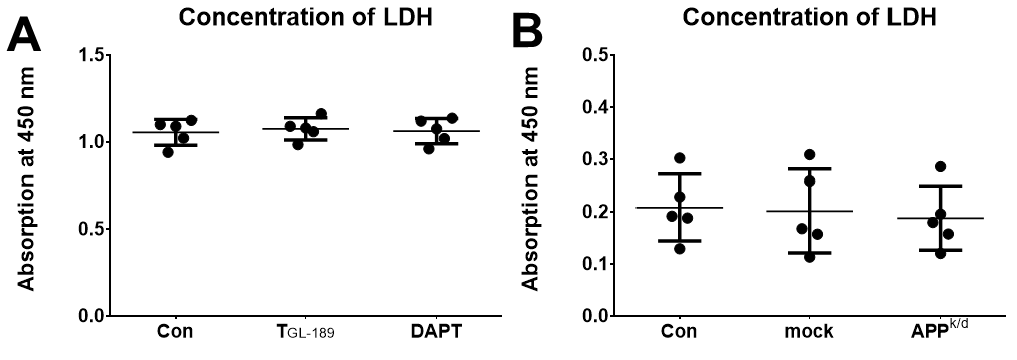
All cell culture experiments were carried out in duplicates and the viability of the cells was assessed with the Cytotox96 non-radioactive assay (Promega, Mannheim, Germany) (Additional figure 1) as well as the MTT-test according to the manufacturer’s instructions (Sigma-Aldrich, Munich, Germany).
Inhibition of APP processing
APP processing was pharmacologically inhibited by adding 10 µM of the γ-secretase inhibitor N-[N-(3,5-Difluorophenacetyl)-L-alanyl]-S-phenylglycine-t-butyl-ester (DAPT, Sigma-Aldrich, Munich, Germany) or 500 nM of the tripartite β-secretase inhibitor TGL-189 (provided by Prof. Knoelker, Dresden Germany) when exchanging the medium on the 7th div. (Figure 1) (31, 32) The applied concentration of the secretase inhibitors did not reduce the viability of the cells.
Transfection of macrophages
Macrophages were transfected with validated silencer® select siRNA directed towards APP (ID s1500, Thermo Scientific, Dreieich, Germany) using the viromere blue transfection system (Lipocalyx, Halle, Germany) according to the manufacurer’s instructions. On the 7th div. the medium was exchanged with serum free AIM-V medium. APP siRNA was diluted to 2.8 µM with buffer BLUE. Viromer® BLUE was mixed with buffer BLUE at a ratio of 1:90 and added to the siRNA dilution. After 15 minutes of incubation, 100 µl of the siRNA mix was added to 1 ml of cell culture medium resulting in a final siRNA concentration of 0.14 µM. Non-silencing silencer® select negative control No. 1 siRNA (Thermo Scientific, Dreieich, Germany) served as control (mock). All experiments were carried out in duplicates.
Phagocytosis-Assay - Flow Cytometry
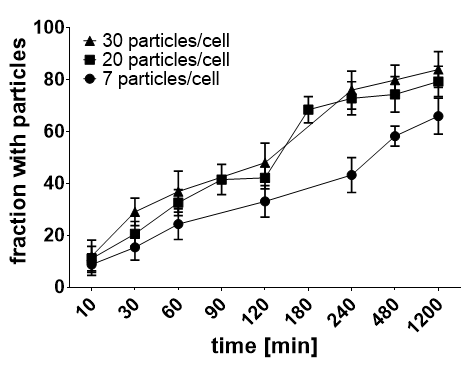
To assess the phagocytotic activity of macrophages, fluorescent 1 µm polysterene particles were added in a previously optimized concentration of 20 particles/cell (Additional figure 2). At several timepoints between 10 and 1200 minutes, cells were detached with accutase (PAA laboratories, Cölbe, Germany) and the mean fluorescent initensity per macrophage was measured with the CyFlow space flow cytometer (Partec, Goerlitz, Germany) equipped with flow max 2.8 software (Partec, Goerlitz, Germany) and evaluated with the Kaluza 2.0 software (Beckman & Coulter, Krefeld, Germany).
ELISA of TNFα, IL-6, IL-10
The concentrations of TNFα, IL-6 and IL-10 in the conditioned macrophage media were quantified 48 h after transfecting the macrophages with APP siRNA or adding the secretase inhibitors by commercially available antibody sets (Catalog numbers: IL-6: 31670069, IL-10: 31670109, TNFα: 31673019; all Immunotools, Friesoythe, Germany). Optimized working concentrations of the respective antibodies were established before the experiments. All measurements were run in duplicates. The samples were diluted to be measured within the detection range of the assays and the coefficient of variation of all measurements was below 20%.
Immunoprecipitation, SDS-page and immunoblot
The concentrations of APP and Aβ peptides in macrophage cultures were assessed with SDS-PAGE followed by immunoblotting.
For the measurement of APP, cells were lysed with the RIPA-buffer (50 mM HEPES, 150 mM NaCl, 1%(v/v) Igepal, 0.5%(w/v) Na-DOC, 0.1% SDS and 1 tablet Complete Mini protease inhibitor cocktail (Roche, Germany)). The protein content of cell lysates was assessed with the BCA-assay (Pierce Biotechnology, Rockford, USA) and a standardized amount of protein was boiled with sample buffer and loaded on 7,5 % SDS-pages according to Laemmli et al. (33). The consecutive immunoblot on PVDF membranes was performed according to the method described by Towbin et al. (34). The immunolabeling was carried out with the anti-APP antibody 22C11 (Merck-Millipore, Darmstadt, Germany) followed by incubation with the horseradish peroxidase labeled goat anti mouse antibody (Merck-Millipore, Darmstadt, Germany). Membranes were developed with ECL® advance (GE-Healthcare, Freiburg, Germany) and recorded with the Amersham Imager 600 (GE-Healthcare, Freiburg, Germany). A quantification of the blots was performed on the bases of band intensity normalized to the density of the GAPDH band with the quantity one software (Bio-Rad, Munich, Germany).
The concentrations of Aβ peptides in cell culture medium were evaluated according to Wiltfang et al.. Aβ peptides were immunoprecipitated with the n-terminal anti Aβ peptide antibody 1E8 and separated on Tris/Bicine SDS-Pages containing 8 M urea (35). Peptides were transferred to PVDF membranes using a semi-dry westernblot with a discontinuous buffer-system (35). Immunolabeling was performed with the anti-Aβ antibody clone 1E8 and the signal was enhanced by a two-step labeling with a biotinylated goat-anti-mouse antibody and streptavidine conjugated horseradish peroxidase. Finally, membranes were developed with ECL® advance (GE-Healthcare, Freiburg, Germany) and recorded with the Amersham Imager 600 (GE-Healthcare, Freiburg, Germany). Quantification of the blots was carried out with the quantity one software (Bio-Rad, Munich, Germany).
Statistical analysis
Statistical analysis was carried out using Prism 6.0 (GraphPad Software Inc., La Jolla, CA, USA). As each experiment was carried out with cells from the same donor, pairwise comparisons were calculated with the ratio paired t-test. Results are presented as mean with standard deviations and were considered to be significant at a p-value < 0.05.