II.1. Green synthesis and characterization of silver nanoparticles (bio-AgNPs) using algal free culture.
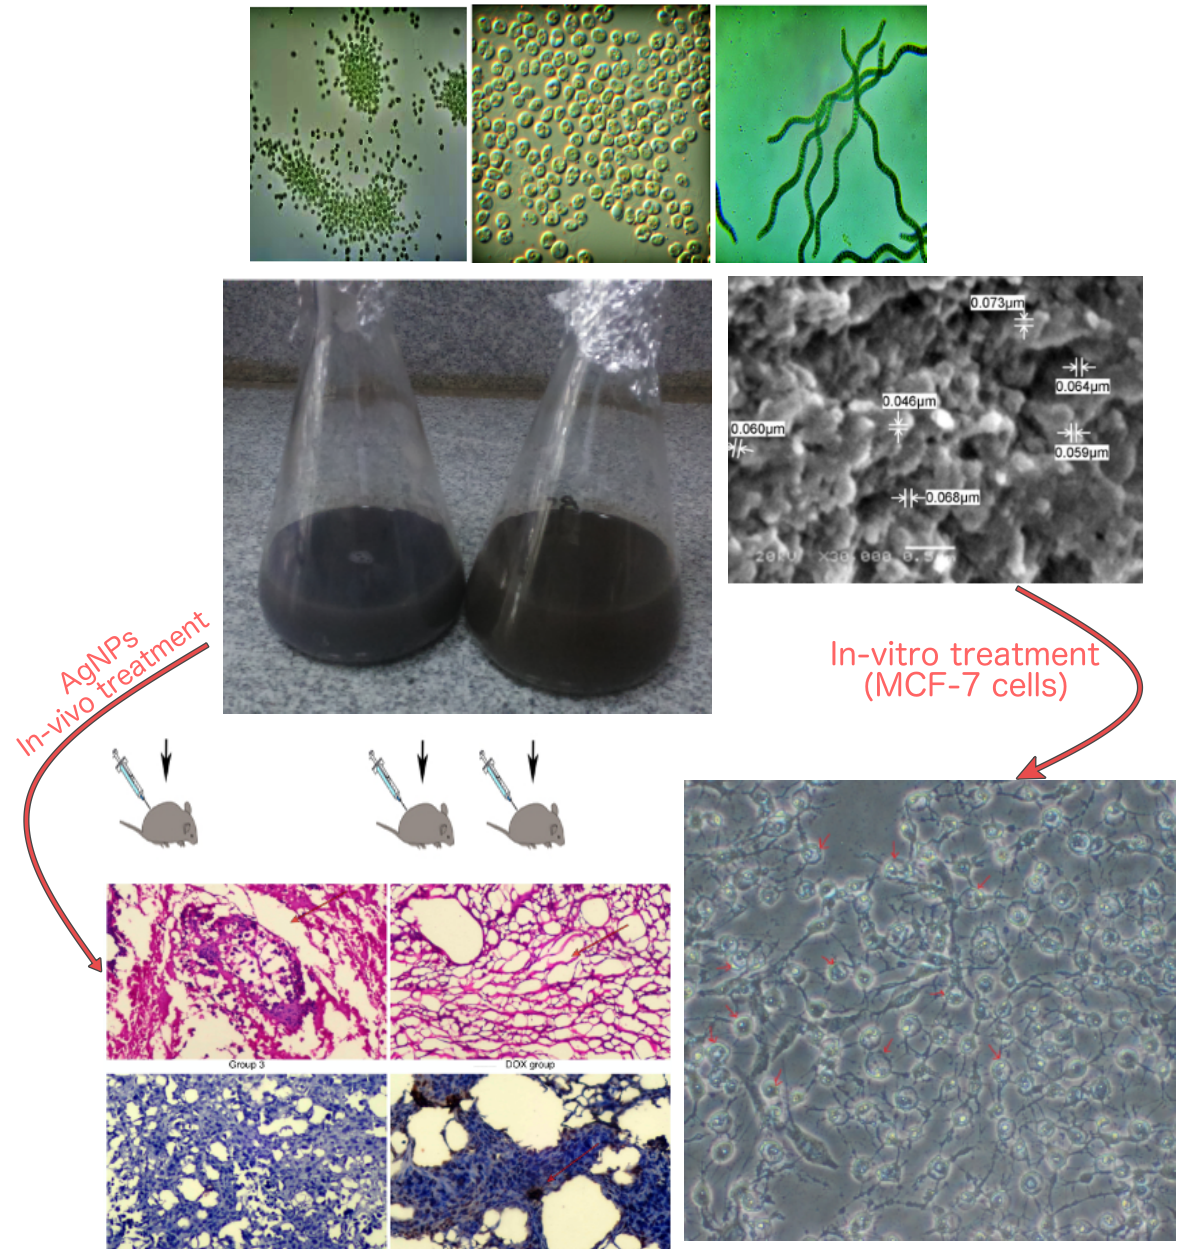
Chlorella vulgaris was cultured on Kuhl's medium for 20 days at 25 ± 2 ºC and 200 LUX, Arthrospira platensis was cultured on modified Zarrouk medium for 16 days at about 27 ± 2ºC and 2500 while Microcystis aeruginosa was cultured on BG11 for 16 days at about 27 ± 2ºC and 2500 LUX, algal cultures shacked twice per day.
Fifty ml of AgNO3 (1Mm) were drop wisely added to 50 ml of each culture filtrate of A. platensis (PH = 11), M. aeruginosa (PH = 6) and C. vulgaris (PH = 6.6). Each preparation was shacked for 1 hour (220 rpm) at room temperature. The formed pellets were collected by centrifugation at 10000 rpm for 10 min and then washed 3 times with distilled water before drying and storing at room temperature till use.
Scanning Electron Microscopy (SEM).
The microstructures and morphology of the bio-AgNPs particles were observed using a Joel 6360LA scanning electron microscope (JEOL Ltd., Tokyo, Japan)at an accelerated voltage of 15 kV. The samples were mounted on the specimen holder with double sided adhesive tape, after gold coating using a JFC- 1100E sputter (JOEL Ltd., Tokyo, Japan), the images were captured using an accelerating voltage of 15 kV.
Transmission Electron Microscopy (TEM).
The collected bio-AgNPs pellets were dispersed in distilled water and their microstructures were studied with a Joel 6360LA transmission electron microscope (JEOL Ltd., Tokyo, Japan), by double sided adhesive tape. A thin film of sample was prepared by placed 5 µl of the collected bio-AgNPs on a carbon coated 3-mm copper grid that dried at room temperature. ImageJ software was used for examination and poly dispersity index was calculated according to the following equation:
$$\text{P}\text{o}\text{l}\text{y} \text{D}\text{i}\text{s}\text{p}\text{e}\text{r}\text{s}\text{i}\text{t}\text{y} \text{I}\text{n}\text{d}\text{e}\text{x} \left(\text{P}\text{D}\text{I}\right)={\left(\frac{\text{S}\text{t}\text{a}\text{n}\text{d}\text{a}\text{r}\text{d} \text{D}\text{e}\text{v}\text{i}\text{a}\text{t}\text{i}\text{o}\text{n}}{\text{M}\text{e}\text{a}\text{n} \text{D}\text{i}\text{a}\text{m}\text{e}\text{t}\text{e}\text{r}}\right)}^{2}$$
II.2. In-vitro safety assay and anticancer effects of bio-AgNPs.
For the determination of Chlorella vulgaris (C-bio-AgNPs), Microcystis aeruginosa (M-bio-AgNPs) and Arthrospira platensis (A-bio-AgNPs) non-toxic dose which does not display toxic effects on PBMC cells, the cytotoxicity assay was accomplished using MTS assay. 100µl of PBMCs suspension (6×10⁴ cell/ml) was seeded in 96-well plates. The seeded plates were incubated at 37oC in humidified 5% CO2 for 24 hr. After incubation, the exhausted old medium was replaced with either 100 µl of treatment concentrations (prepared in culture medium) or medium (negative control). The plates were incubated at the same growth conditions for 3 days after that, the cytotoxic effects were quantified using MTS assay Kit according to the instruction protocol.
The anticancer activities of C-bio-AgNPs, M-bio-AgNPs and A-bio-AgNPs were quantified against HepG-2, CaCO-2 and MCF-7 cell lineswere using MTS assay as described above.
The selectivityindex of the recovered bio-AgNPs to cancer cells was quantified according toKoch et al.[14] protocol with a minor modification, where; SI = IC50nc /IC50cc, where IC50nc refers to the IC50 value of the tested compound on normal cells while; IC50cc refers to the IC50 of the tested compound on cancer cell line.
II.3. The mode of anticancer action of the bio- AgNPs.
The total induced intracellular ROS by C-bio-AgNPs, M-bio-AgNPsand A-bio-AgNPs were detected in PBMC using 2`, 7`-dichloro dihydrofluorescein diacetate (H2DCF-DA) and flowcytometry. DFCH-DA enters cells and further oxidized by ROS forming fluorescent product 2',7'-dichlorofluorescein (DCF). Briefly, PBMC cells were grown in 96 well plates for 24 hrs, 100 µl of bio-AgNPs non-toxic doses were added to cells and incubated for 24 hrs. After that, cells were incubated with H2DCF-DA at a final concentration of 50 µM for 30 min. In the positive control group, ROS was induced by loading cells with E. coli LPS (lipopolysaccharide 100 ng/ml) in RPMI. After 1 h incubation, the stimulants were discarded and cells were washed three times with pre warmed PBS, all samples were analyzed using a BD FACSC calibur flow cytometer with Cell Quest software. For quantification of DCF fluorescence, at least 10,000 events were used for each measurement [4].
The alterations of HepG-2, CaCO-2 and MCF-7cell cycle pattern upon A-bio-AgNPs treatment were determined using flow cytometry (Léonce et al. 2001) in which PI was used as cellular stain that discriminate living cells from dead cell. After treatment, cell suspensions were stained with 0.5 mL of warm PI solution (7 ml of PI solution consists of 0.35 ml of PI solution (1 mg/ml), 0.7 ml RNase A solution (1 mg/ml), and 6 ml of PBS). All samples were kept on ice until flow cytometric analysis.
Acridine orange/ethidium bromide (AO/EB) assay was used to differentiate between Apoptosis and necrosis cellular status.
Acridine orange could stain both live and dead cells while; ethidium bromide stain only cells that have lost membrane integrity. After A-bio-AgNP streatment, MCF-7 cell suspension (0.5 × 10⁶ cells/ml) was incubated with 1 µl of AO/EB solution and aliquot of cell suspension was examined using a fluorescence microscope [15].
The molecular anticancer action of A-bio-AgNPs was explained by studying their effects in controlling the expressions of p53, Bcl2, MMp7 (metalloproteinase-7), TGFα (Transforming growth factor) and Survivin genes in MCF-7 treated cells. After 24 hrs cellular treatment with sub-IC50 concentrations, RNA was extracted using the Qiagen RNA Kit. cDNA was synthesized using r First Strand cDNA Synthesis Kit (Roche) and Real-time qPCR was conducted using primer sets listed in Table (S1) and SYBR Green Master Mix (Applied Biosystems). The gene expression levels were calculated and normalized using b-actin and expressed as a fold change compared with control. The obtained results were analyzed using a CFX-96 (Bio-Rad).
II.4. Safety assay and anticancer effects of A-bio-AgNPs, In-vivo.
Based on the In-vitro studies, A-bio-AgNPs was selected to complete the all in-vivo experiments due to its anticancer efficacy.
BALB/c mice (35–45 gm) were purchased from VACSERA, Cairo, Egypt. After one week adaptation, the experimental animals were divided into three groups, each one contained 5male albino mice (35–45 gm).
The in-vivo protocols were reviewed and approved by Medical Research Institute, Alexandria, Egypt, Animal Care and Use Committee.
In the first group, mice were intraperitoneally injected (IP) with A-bio-AgNPs (0.3mg/ml, 7µg/g body weight). IN the second group mice; mice were IP injected with 0.15mg/ml A-bio-AgNPs (3.5µg/g body weight). The last group was represented the untreated control one which injected with 9% saline. After 2 weeks and upon scarifying, serum samples were collected and the the blood biochemical tests were performed. Serum alanine aminotransferase,Aspartate aminotransferase, Alkaline phosphatase (ALP) activities, total protein, albumin concentration, Urea and creatinine concentrations were determined using Bio diagnostic kit, Egypt according to its manual instruction.
Mice were subcutaneously injected with 2 X10⁵ of Ehrlich Ascites Carcinoma cells (Ehrlich cells, EAC) in the right flank of BALB/C. After 5 days of tumor induction, the tumor burdens were measured by Vernier caliper. Mice were then grouped based on measurements into four groups, each group was adjusted to contain the same average of tumor burden mice and each one contained 5 female mice (22–28 gm).
After 7 days of tumor induction, In the first group: 5 tumor bearing female mice were IP injected with 0.15 mg/ml of A-AgNPs (3.5gm/Kg body weight). In the second group, another 5 tumor bearing mice were injected locally (intertumoral injections) with 0.15mg/ml A-AgNPs (3.5gm/Kg body weight). In the positive control group, 5 tumor bearing mice were IP injected with Doxorubicin (0.15mg/ml; 3.5gm/Kg body weight). Also, 5 tumor bearing (female) mice were IP injected with 9% saline (negative control group). All mice bearing Ehrlich Ascites Carcinoma were treated 3 times on day 7, 10 and 17. The tumor measurements were performed every 2 days and calculated as tumor volume = (width2 × length)/2 as reported [16]. Animals were checked until they reached the killing criteria (tumor burden reached 10% of body weight, the presence of tumor ulceration or mice became dying).
The study lasted for 1 month before scarifying under diethyl ether anesthesia, serum samples, tumors tissue and different organs were collected for blood biochemical assays and histopathological examinations.
After mice scarifying, one longitudinal half of each organ was fixed at 10% formalin for the histopathological analysis. The obtained sections were stained with hematoxylin and eosin (H&E), microscopically examined for the presence edema, erosion and necrosis.For immunohistochemical analysis, 3 µm sample sections were deparaffinized with xylene and ethanol, the intrinsic peroxides activity in tissue sections was blocked with Peroxidase. After protein blockage, the prepared sections were incubated with anti-Ki 67 and anti-Caspase 3 antibodies [17] for 30 minutes then, washed for 5 minutes two times in PBS. Mayer’s hematoxylin was used to counter stain the slides. The stained sections were examined under a light microscope (Olympus BX53, Tokyo, Japan).
II.5. Statistical analysis.
All results are presented as mean ± SD (standard deviation) of three replicates and the statistical analyses were carried out using SAS program. Data obtained were analyzed statistically to determine the degree of significance between treatments using one- and two-way analysis of variance (ANOVA) at P ≤ 0.005 (SAS program 1989–1996). IC50 values and the statistical analysis of cytotoxicity and safety assay experiments were carried out using GraphPad prism 8.