Patients
This study was approved by the Institutional Ethics Committee of Xinhua Hospital affiliated to Shanghai Jiao Tong University School of Medicine (No. XHEC-D-2020-090). The informed consent requirement was waived for this retrospective study using de-identified data. Clinical and non-contrast chest CT data of consecutive 115 patients with COVID-19 confirmed by RT-PCR from Bengbu City, Anhui Province (center I) as well as 1205 patients with respiratory symptoms from Xinhua Hospital (center II) were reviewed during the COVID-19 outbreak from December 20, 2019 to February 15, 2020. Patients with common pathogen confirmation and disease improvement on follow-up CT after treatment were grouped as non-COVID-19 pneumonia patients. The exclusion criteria were as follows: (a) lack of complete clinical records (blood test or pathogen confirmation); (b) normal or without acute pneumonia on CT images; (c) lack of follow-up CT images; (d) insufficient image quality due to the severe artifacts affecting the image assessment. Consequently, 95 COVID-19 and 415 non-COVID-19 pneumonia patients were recruited and semi-randomly allocated to the training and internal validation cohorts according to the recruitment time. Another 40 patients with viral pneumonia between February 16, 2020 and March 20, 2020 who met the inclusion and exclusion criteria as an independent and new cohort were included to further test the constructed models. Finally, 115 COVID-19 and 435 non-COVID-19 pneumonia patients were enrolled in this study. The workflow of this study was displayed in Fig. 1. Among the non-COVID-19 patients, 128 were confirmed viral infections, 195 mycoplasma infections, 5 chlamydia infections, 3 fungus infections, and 104 co-infections.
CT imaging acquisition and interpretation
All the patients underwent non-enhanced chest CT examinations for detecting pneumonia in the supine position during end-inspiration. The CT scans were performed with a 64-section multi-detector CT scanner (uCT780, United imaging or Somatom Definition Flash, Siemens Healthineers, or Light Speed VCT, GE Healthcare, or Acuilion, Toshiba Healthcare). The detailed imaging parameters for different scanners were demonstrated in Appendix E1.
Initial CT images before any treatment were performed by three experienced radiologists in consensus (HZ, LH and JL, with 9, 11 and 10 years of experience in thoracic imaging, respectively). The disputes between the radiologists were resolved by consulting another experienced radiologist (DW or ZX, with more than 20 years of experience in thoracic imaging, respectively). All of them were blinded to the results of laboratory tests.
The lesion number, distribution, density, extent, and other features were assessed. Lesion number included single or multiple lesions. Distribution included unilateral or bilateral lungs, peripheral or central or both of the peripheral and central sites. Density included pure GGO, GGO with consolidation, and pure consolidation. Other features consisted of reticulation (intralobular/interlobular septal thickening), air bronchogram, lymphadenopathy within the mediastinum or hilus, and pleural effusion. Lymphadenopathy was defined as the size of lymph node more than 10 mm in short-axis diameter.
The extent of pulmonary involvement was estimated using a semi-quantitative scoring system. Each of the 5 lung lobe involvements was scored from 0 to 5 as follows: 0 (0%), 1(< 5%), 2 (5%-25%), 3 (26%-49%), 4 (50%-75%), and 5 (> 75%) [17]. The total CT score was obtained by summing the scores of the five lobes ranging from 0 to 25.
Image segmentation and radiomics feature extraction
Three-dimensional (3D) segmentation of the entire volume of interest (VOI) of the pneumonia lesions were performed manually and independently by two experienced radiologists (radiologist 1 [HR] and radiologist 2 [RC], with 5 and 6 years of experience in thoracic imaging, respectively) via a free and widely used open-source software package (itk-SNAP, version 3.4.0, www.itksnap.org). The outline of the lesions was delineated along the border on thick-section images with lung window and excluded the intralesional vessels, bronchi, necrosis, and cavitation (Fig. 2). Both of them were blinded to theresults of laboratory tests.VOIs with a volume less than 125 mm3 were excluded.
The interobserver and intraobserver reproducibility evaluation of radiomics feature extraction was performed using intraclass correlation coefficients (ICC). Totally 15 VOIs from each group in the training cohort were randomly chosen. The intraobserver ICC was calculated by comparing two segmentations of radiologist 1 (repeated 7-day interval). The interobserver ICC was calculated by comparing segmentation of radiologist 1 (first time) and radiologist 2. An ICC of 0.81 to 1.00 showed almost perfect agreement, 0.61 to 0.80 as substantial agreement, and 0.41 to 0.60 as moderate agreement [14].
Radiomics features were extracted from VOIs by using pyradiomics 3.0.0 version [18] (http://www.radiomics.io/pyradiomics.html). Images were preprocessed and processed using the proposed default setting. Six classes of radiomics features were extracted: 18 first order statistics features, 14 shape-based features (3D), 22 gray level cooccurrence matrix (GLCM) features, 16 gray level run length matrix (GLRLM) features, 16 gray level size zone matrix (GLSZM) features, and 14 gray level dependence matrix (GLDM) features. The radiomics feature details were shown in the pyradiomics documentation (https://pyradiomics.readthedocs.io/en/latest/ features. html). In addition, two image filters of wavelet and Laplacian of Gaussian were applied to the original image, respectively. Finally, 14 different image types were used for extracting radiomics features.
Development of clinical and clinico-radiomics combined models
For clinical model, univariate and multivariate logistic regression analysis were applied to select the independent predictors of clinical and radiological features for identifying COVID-19 pneumonia in the training cohort.
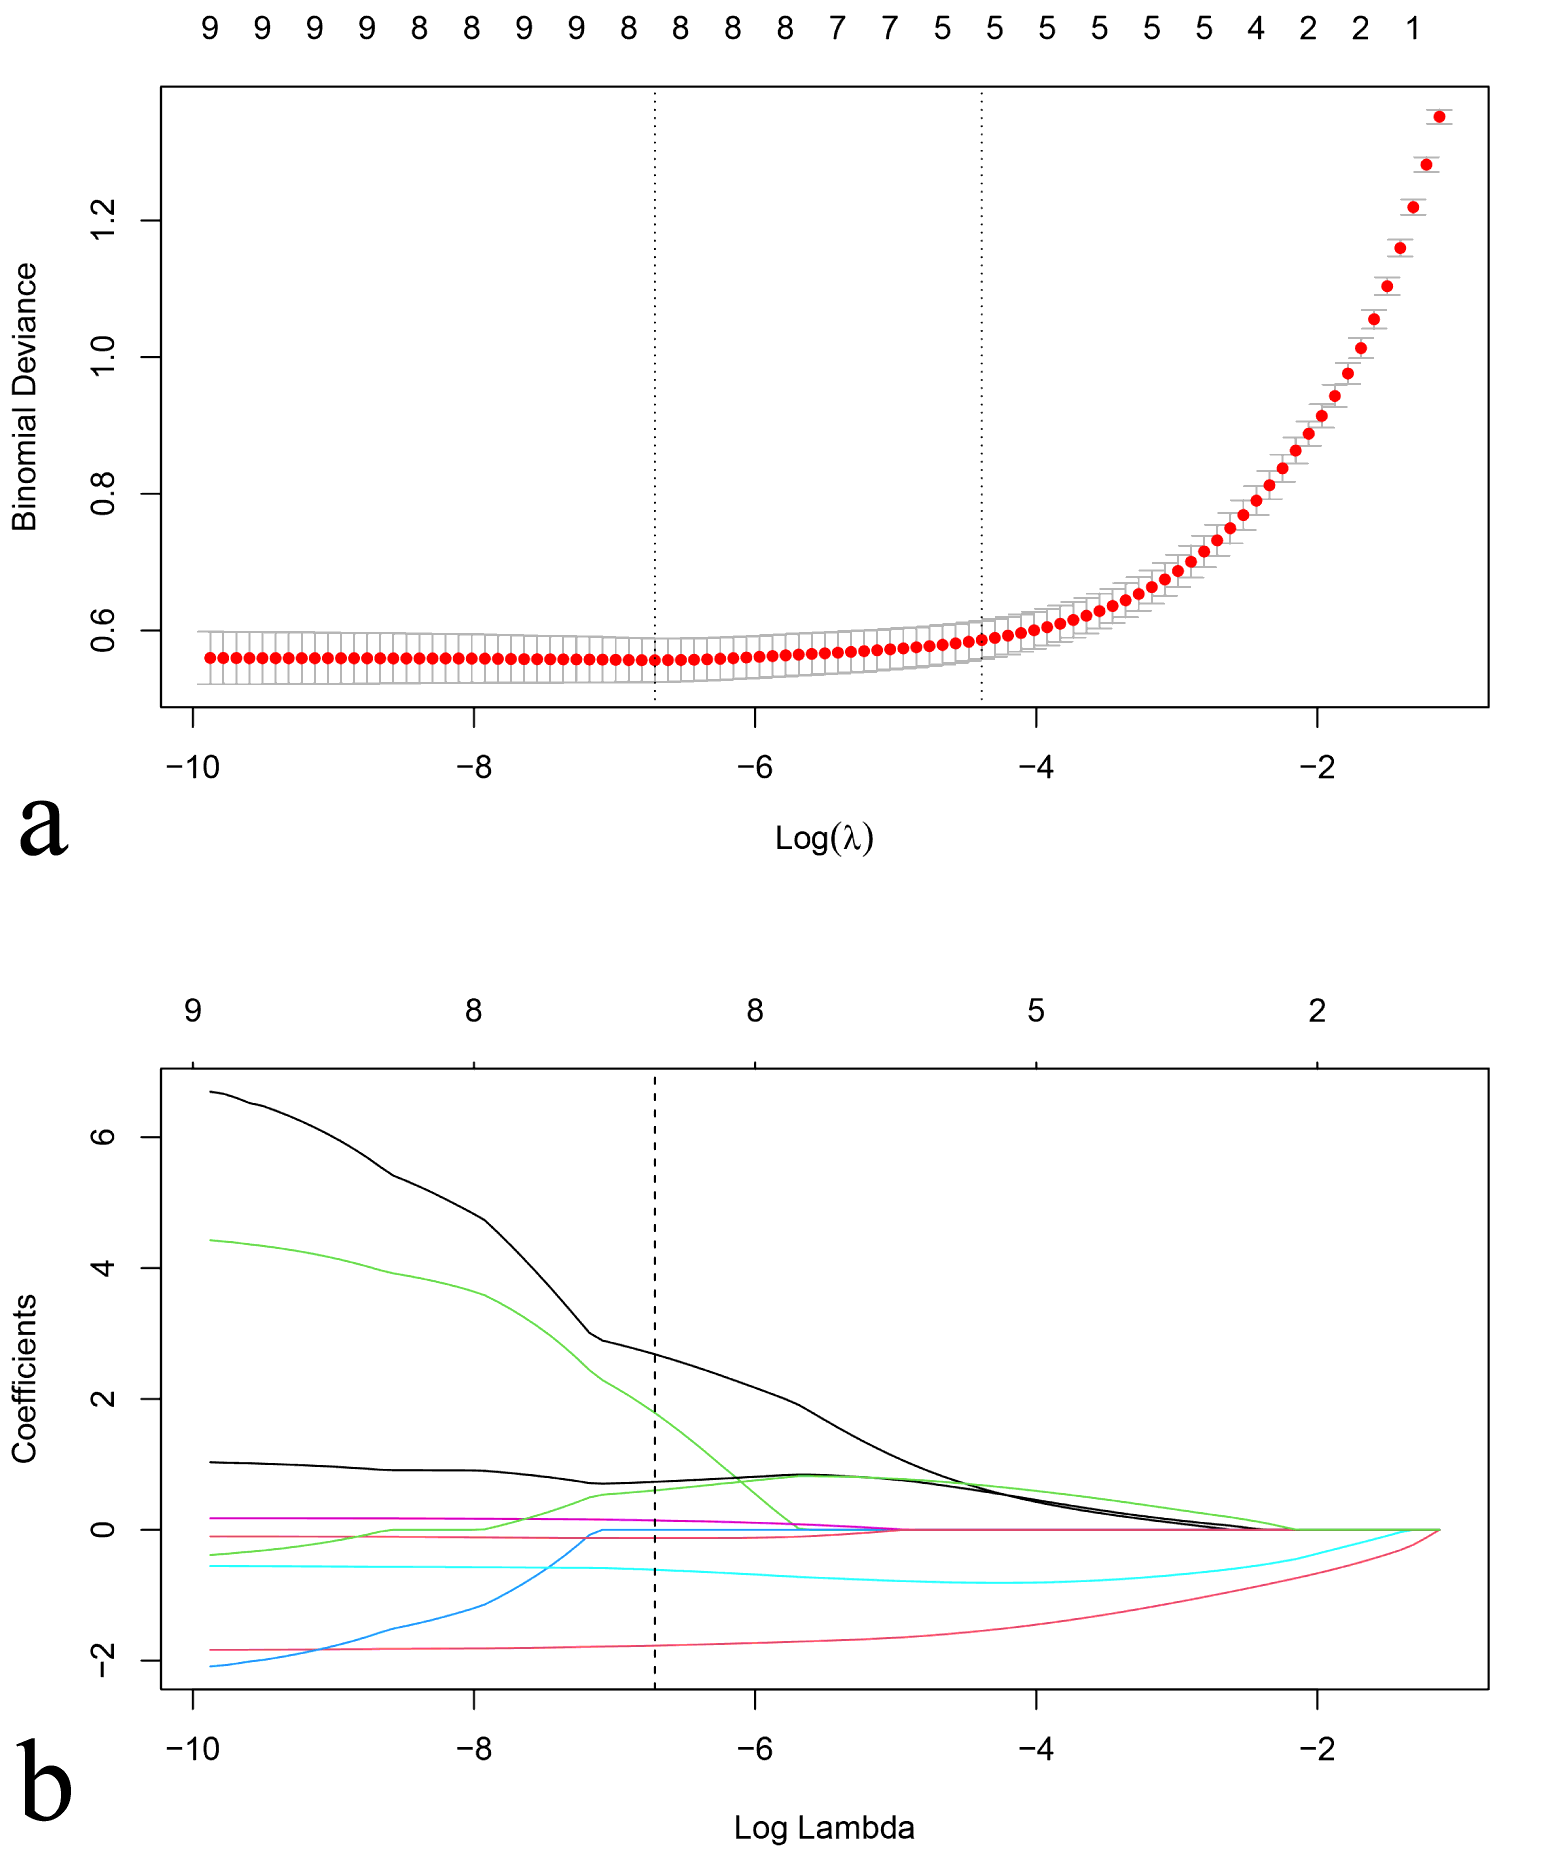
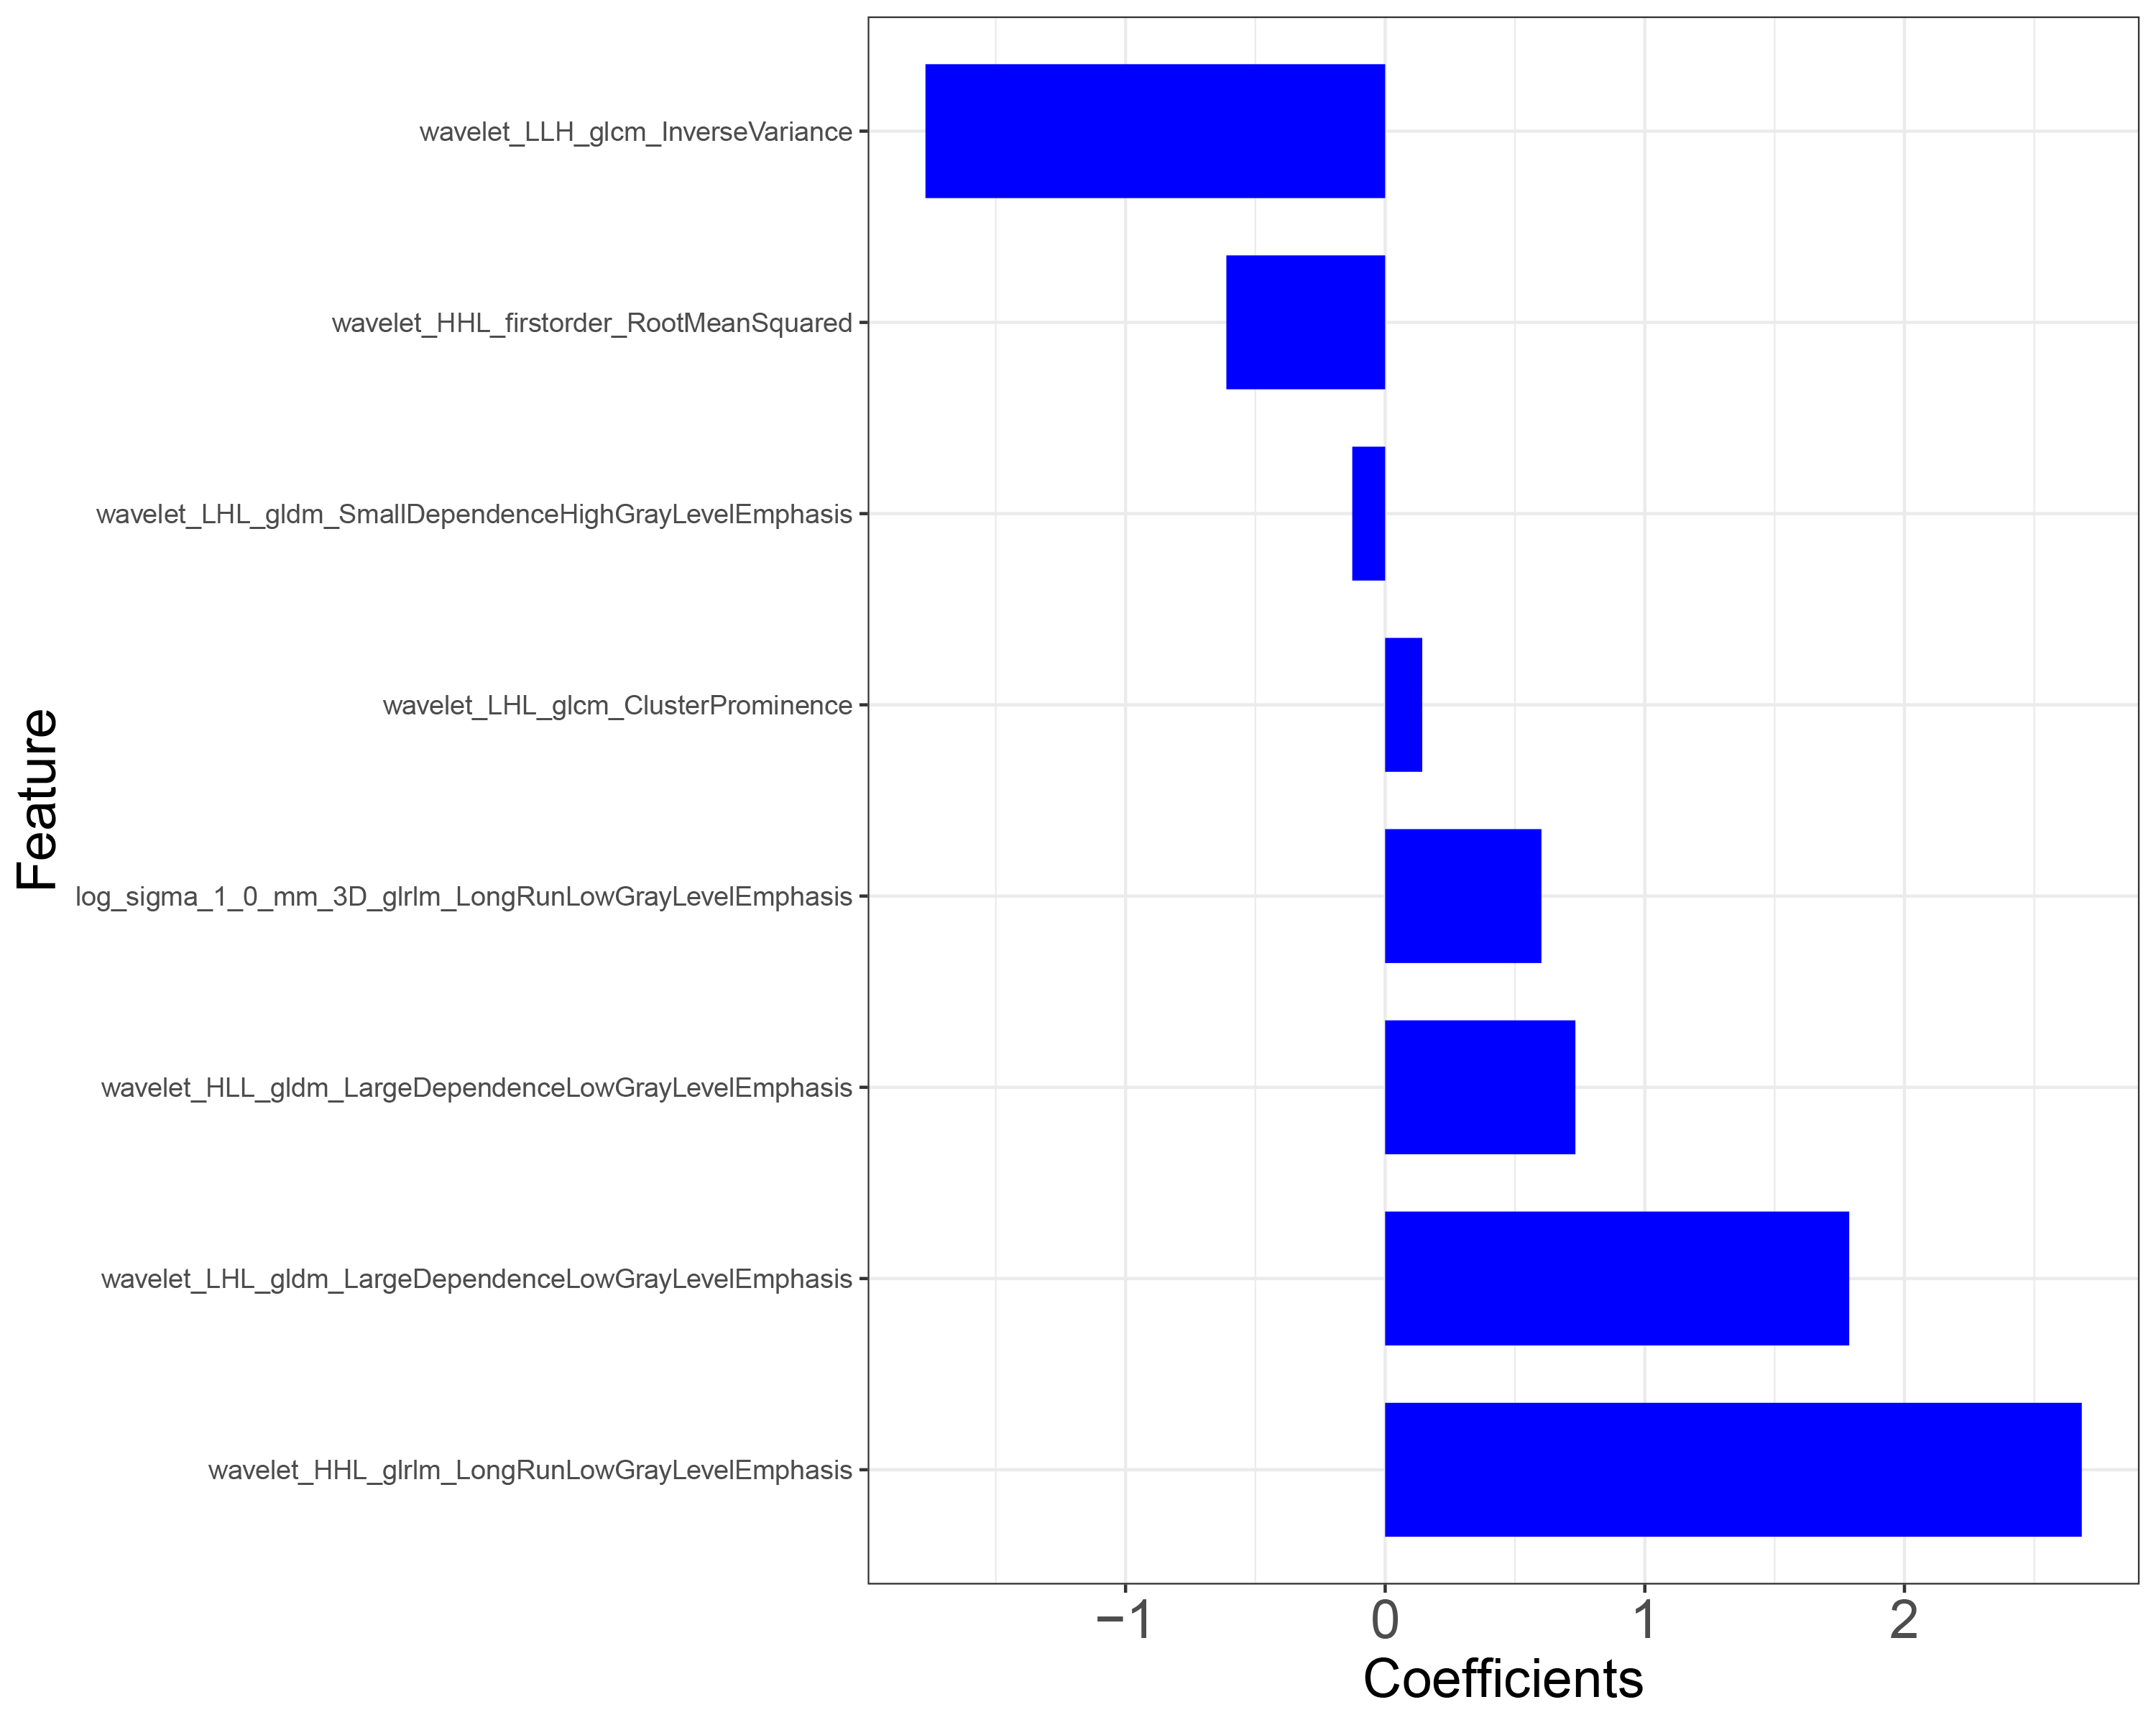
For clinico-radiomics model, minimum redundancy and maximum relevance (mRMR), and the least absolute shrinkage and selection operator (LASSO) logistic regression algorithm were used to select the best performed radiomics features in the training cohort. Then, Radscore was calculated for each lesion by using a linear combination of selected radiomics features and their weight coefficients. The mean Radscore (mRadscore) of lesions for each patient was used for predicting COVID-19 pneumonia. A clinico-radiomics combined nomogram was developed with the selected clinical variables and mRadscore by using multivariate logistic regression analysis.
Internal validation and clinical utility of clinical and combined radiomics models
The diagnostic performance of clinical and combined models was assessed by using the receiver operating characteristic curve (ROC) analysis, in which the areas under the curve (AUCs), accuracies, sensitivities, and specificities were established. Then, the diagnostic performance of the models was validated in the validation cohort. Calibration curves, obtained by plotting the actual COVID-19 pneumonia probability against developed model-predicted probability of COVID-19 pneumonia, were performed to assess the goodness-of-fit of the clinical and combined models.
Decision curve analysis (DCA) was implemented to evaluate the net benefits of the prediction models at different threshold probabilities in the validation cohort.
Predictive performance of combined radiomics model in distinguishing COVID-19 from other viral pneumonia compared with clinical model and CO-RADS
Another independent testing cohort including 20 patients with COVID-19 pneumonia and 20 patients with other viral pneumonia was used to test the discriminatory power for the clinical model, clinico-radiomics combined model, and CO-RADS category approach. The CO-RADS included 6 levels of suspicion for pulmonary involvement of COVID-19 besides CO-RADS 0, not interpretable (scan technically insufficient for assigning a score) as follows [11]: CO-RADS 1, very low (normal or non-infectious); CO-RADS 2, low (typical for other infection but not COVID-19); CO-RADS 3, equivocal/unsure (features compatible with COVID-19, but also other diseases); CO-RADS 4, high (suspicious for COVID-19); CO-RADS 5, very high (typical for COVID-19); CO-RADS 6, proven (RT-PCR positive for SARS-CoV-2). The detailed information for each level was demonstrated in Appendix E2.
The CO-RADS categories for the 40 patients were independently performed by twoexperienced radiologists who were familiar with the CO-RADS categories and blinded to laboratory results (HZ and JL, with 9 and 10 years of experience in thoracic imaging, respectively). The interobserveragreement was assessed by using Cohen kappa test, where 0-0.2 was slight agreement, 0.21-0.40 fair agreement, 0.41-0.60 moderate agreement, 0.61-0.80 substantial agreement, and 0.81-1.00 almost perfect agreement [19]. The discriminatory power for the three methods was compared.
Statistical analysis
Quantitative variables were described as mean ± standard deviation or median (inter-quartile range,IQR). The categorical data were expressed as the frequency (percentage). Comparisons of patient characteristics between COVID-19 and non- COVID-19 pneumonia groups were performed by independent two-sample t test, Mann-Whitney U test, and chi-squared test or Fisher’s exact test via SPSS 23.0 (IBM). Other statistical analyses were performed with R software (version 3.6.1, http://www.Rproject.org). Youden’s index was used to determine the optimal threshold that would maximize the sum of sensitivity and specificity for ROC analysis. The AUCs were compared by DeLong test [20]. A two-sided P<0.05 indicated a statistically significant difference.