Chemicals
Salicylaldehyde, aniline, 2,2-Diphenyl-1-picrylhydrazyl radical (DPPH), ferrous sulphate, Ascorbic acid, ethylenediaminetetraacetic acid (EDTA), Tris HCl buffer, ferric chloride, O-phenenthroline, sulfuric acid, ammonium molybdate, Potassium phosphate (mono phosphate and diphosphate), Hydrogen peroxide, ethanol, Salmon fish DNA of analytical grade were purchased from Sigma Aldrich.
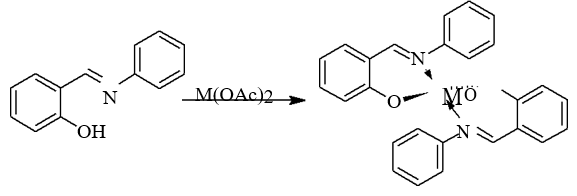
Synthesis of 2-[(E)-(phenylimino)methyl]phenol (H-Pimp)
The Schiff base ligand H-pimp was synthesized by reacting the methanolic solution of 5mmol of aniline with 5mmol salicyladehyde. Yellowish product was produced instantaneously upon mixing. Crude product was filtered and recrystallized from concentrated metahanolic solution.
Yield: 63%, M.Pt: 48° C, Elemental analysis (C13H11NO): Calc. C(79.16%), H(5.62%), N(7.10%), Exp. C(80.63%), H(5.12%), N(7.01%), IR analysis (cm-1): 3200 (w), 1569 (s), 1483(s), 1407(s), 1363(s), 1282(s), 1156(s), 1110(s), 987(s), 912(s), 857(s), 756(s), 688(s), 1H NMR (300.13 MHz, CDCl3, 303k) δ = 6.8 (d, 3JHH = 7.03 Hz, 1H, H13), 6.91 (d, 3JHH = 7.03 Hz, 2H, H12 & H14), 6.94 (d, 3JHH = 7.01 Hz, 2H, H4 & H5), 7.02 (d, 3JHH = 7.2 Hz, 1H, H3), 7.11 (d, 3JHH = 7.31 Hz, 2H, H11 and H15), 7.3 (d, 3JHH = 6.9 Hz, 1H, H6), 8.53 (s, Ar HC N), 10.0 (s, OH), 13C{1H}-NMR (75.47 MHz, CDCl3, 303k), 110 (CH, C13), 112 (CH, C12 & C14), 112.1 (CH, C4 & C5), 113 (CH, C3), 126 (CH, C11 and C15), 133 (CH, C6), 133 (C, C2), 148 (C, C1), 153 (C, C10), 159 (CH, Ar HC-N).
Synthesis of transition metal complexes with H-pimp Schiff base ligand
The transition metal complexes of the H-pimp Schiff base ligand were synthesized by following the same procedure as reported [8]. The metal salts were initially dehydrated by keeping the acetate salts of Co(II), Ni(II), Cu(II) and Zn(II) in an oven for 3-4 h at 110° C. Methanolic solution of H-pimp (5mmol) was added to the methanolic solution of metal acetate (2mmol) and stirred for 3h. The product was either instantly soon after the reaction or obtained through concentration using rotary evaporator.
Bis(2-[(E)-(phenylimino)methyl]phenolate)cobalt(II) (Co-pimp)
Yield; 43%, elemental analysis, C26H20CoN2O2, Calc. C(69.18%) H(4.47%) Co (13.06%) N(6.21%) Found C(69.88%) H(5.11%) Co(13.02%) N(6.12%) IR analysis: 1536(s), 1482(s), 1465(s), 1450(s), 1328(s), 1180(s), 1148(s), 1122(s), 1086(s), 1010(s), 976(s), 929(s), 858(s), 837(s), 758(s), 698(s) cm−1, λmax = 860 nm (ε = 17.6 M−1 cm−1, 2A2g →2B1g).
Bis(2-[(E)-(phenylimino)methyl]phenolate)nickel(II) (Ni-pimp)
Yield; 55%, elemental analysis, C26H20N2NiO2, Calc. C(69.22%) H(4.47%) N(6.21%) Ni(13.01%) Found. C(69.28%) H(4.90%) N(6.29%) Ni(12.11%), IR analysis: 1533(s), 1464(s), 1443(s),1416(s), 1343(s), 1260(s), 1224(s), 1181(s), 1147(s), 1123(s), 1033(w), 981(s), 946(s), 871(w), 821(s), 810(s), 761(s), 751(s), 728(s), 689(s), 671(s) cm−1, λmax = 690 nm (ε = 28.3 M−1 cm−1, 1A1g →1A2g).
Bis(2-[(E)-(phenylimino)methyl]phenolate)copper(II) (Cu-pimp)
Yield; 68%, elemental analysis, C26H20CuN2O2, Calc. C (68.48%) H (4.42%) Cu (13.94%) N (6.14%) Found. C (69.33%) H (4.92%) Cu (13.01%) N(7.44%) IR analysis: 1555(s), 1523(s), 1478(s), 1441(s), 1388(s), 1351(s), 1323(s), 1255(s), 1205(w), 1175(s), 1151(s), 1133(s), 1098(s), 1031(s), 1009(s), 987(s), 937(s), 834(s), 767(s), 699(s), 623(s) cm−1, λmax = 660 nm (ε = 188.6 M−1 cm−1, dz2 → dx2−y2 ).
Bis(2-[(E)-(phenylimino)methyl]phenolate)zinc(II) (Zn-pimp)
Yield; 55%, elemental analysis, C26H20N2O2Zn, Calc. C (68.20%) H (4.40%) N (6.12%) Zn (14.29%) Found. C (70.01%) H(4.78%) N (6.89%) Zn (14.95%), IR analysis: 1581(s), 1531(s), 1459(s), 1441(s), 1389(s), 1351(s), 1326(s), 1253(s), 1169(s), 1151(s), 1096(s), 1032(s), 1008(s), 927(s), 829(s), 789(s), 762(s), 688(s), 596(s) cm−1.
Determination of In-Vitro antioxidant studies
DPPH radical scavenging assay
The antioxidant activity of the newly synthesized compounds were assessed using the stable DPPH free radical according to Ibrahim et al.2017 [7]. Various concentrations (50, 100, 200 and 400µM) of compounds were mixed with ethanolic solution containing 85µM DPPH radical. The decrease in absorbance was measured at 518 nm using a UV-Visible Spectrophotometer. Ascorbic acid was used as positive control to determine the maximal decrease in DPPH absorbance. The values are expressed in percentage of inhibition of DPPH absorbance in relation to the control values without the compounds (ascorbic acid maximal inhibition was considered 100% of inhibition).
Ferrous ion-chelating assay
The ferrous ion chelating activity of newly synthesized compounds were analyzed by a standard method Puntel et al., 2005[8]. Various concentrations (50µM, 100 µM, 200 µM, and
400 µM) of compounds were mixed with 0.2 ml of 3.6 mM ferrous sulphate, 0.3ml of 100 mM Tris-HCl (pH=7.4), 0.1 ml of 9 mM O-Phenanthroline and diluted up to 3.0 ml with ultra-pure distal water. The reaction mixture was shaken vigorously, incubated for 10 minutes and the decrease in absorbance was determined at 510 nm. EDTA (ethylenediaminetetraacetic acid) at the same concentrations utilized as a reference standard and without Schiff bases complexes .
Ferric Reducing / Antioxidant Power Assay
The ferric reducing power of the newly synthesized compounds were determined according to (Kumar et al., 2012) [9]. Different concentrations (50, 100, 200, 100 and 200 µM) of compounds, 0.2 ml of 3.6 mM ferric chloride, 0.3ml of 100 mM tris buffer (pH=7.4), 0.1 ml of 9 mM O-phenanthroline and diluted up to 3.0 ml with ultra-pure distal water. It was shaken for 10 min vigorously and left to stand at room temperature. The increase in absorbance of the sample solution was measured at 510 nm using a UV-Visible Spectrophotometer. Ascorbic acid at the same concentrations was utilized as a reference standard and without compounds sample mixture as control.
Total antioxidant activity (Phosphomolybdenum assay)
The total antioxidant capacity of newly synthesized compounds were evaluated by phosphomolybdenum assay (Sahaa et al., 2008)[10]. Reagent solution containing various concentrations (50, 100, 200 and 400 µM) of compounds aliquot in ethanol, 0.7 ml of 0.6 M sulphuric acid, 1.0 mM ammonium molybdate, 1.0 ml of 28 Mm pottasium pasphate and ultra pure distal water was incubated at 95°C for 90 min. After cooling, at room temperature the increase in absorbance of the mixture is measured at 695 nm using an V-730 UV-Visible/NIR Spectrophotometer. Ascorbic acid was utilized as reference standard and without compounds sample mixture as control.
Hydroxyl radical scavenging activity
The scavenging activity of all the synthesized complexes for hydroxyl radicals were measured with Fenton reaction by (Li et al., 2011)[11]. Reaction mixture of various concentrations (50, 100, 200 and 400 µM) of Ni(II), Co(II), Cu(II) and Zn(II) metal complexes, 0.1mL of 7.5 mM O-phenanthroline, 0.5 ml of 0.2 M phosphate buffer ( pH 6.6), 0.1 mL of 7.5 mM ferrous sulfate and 0.1 mL of H2O2 (0.1%) and diluted up to 3 mL with distilled water. The reaction mixture incubated at room temperature for 30 min and the absorbance was measured at 510 nm using a UV-Visible Spectrophotometer. The reaction mixture without Schiff base complexes has been used as control and without Schiff base complexes and H2O2 as a blank.
DNA Absorption spectroscopic studies
The interaction between metal complexes and DNA were studied using electronic absorption method. Solution of Salman fish DNA in the buffer 50 mM NaCl/ 5 mM Tris–HCl (pH 7.2) in water gave a ratio 1.9 of UV absorbance at 260 and 280 nm, indicating that the DNA was sufficiently free from protein [12]. The concentration of DNA was measured using its extinction coefficient at 260 nm (6600M-1 cm-1) after 1:100 dilution. Concentrated stock solutions of the complexes were prepared by dissolving the complexes in ethanol and diluting suitably with the corresponding buffer to the required concentration for all of the experiments. The data were then fitted to the Equation 6 to obtain the kb values for interaction of the complexes with DNA.
[DNA] / (Ɛa-Ɛf) =DNA/ (Ɛa-Ɛf) + 1/ [kb (Ɛb-Ɛf)]
Where Ɛa, Ɛf, and Ɛb are the apparent, free and bound metal complex extinction coefficients, respectively. A plot of [DNA]/ (Ɛb-Ɛf) versus [DNA], gave a slope of 1/ (Ɛb-Ɛf) and a Y-intercept equal to [kb/(Ɛb-Ɛf)]-1; kb is the ratio of the slope to the Y-intercept.
Statistical analysis
Linear regression analysis was used to calculate IC50±SEM values from data and graphs by using Graph pad prism 6® (Motulsky and Neubig, 2001). Significant differences among the means of data were tested by the one-way ANOVA followed by the student´s t-test with significance level (P<0.05). All the tests were conducted in triplicate
Molecular docking methodology
The chemical structure of the Schiff base ligand and its complexes with Co(II), Ni(II), Cu(II) and Zn(II) were sketched and optimized on MOE2017 window using MOE molecular builder and were entered into MOE database. 3-D structure of DNA with PDB ID-1D66, resolution of 2.7 and sequence of CCGGAGGACTGTCCTCCGG was obtained from the RCSB protein Data Bank [13]. For the purpose of docking simulation PDB internal coordinates of DNA were optimized using molecular dynamic AMBER force field and semi-empirical PM3 approaches to attain minimum energy and stable conformation. Water molecules were removed from DNA structures by sequence editor of MOE to exclude effect of water on interaction of DNA with the ligand and its metal complexes. Structures was protonated with their standard geometry followed by their energy optimization tool using MOPAC 7.0. The resulting structures were subjected to systematic conformational search at default parameters with RMS gradient of 0.01 kcal/mol using Site Finder to find out active sites of DNA molecule. Finally a number of docking runs were carried out to get a final binding pose from scoring function. The best conformation was selected on the basis of energetic ground and the minimum Final Docking Energy (∆G) [14-15].
 1A1g→1B1g and 1A1g→Eg were considered enfolded within the broad 2A2g →2B1g transition [