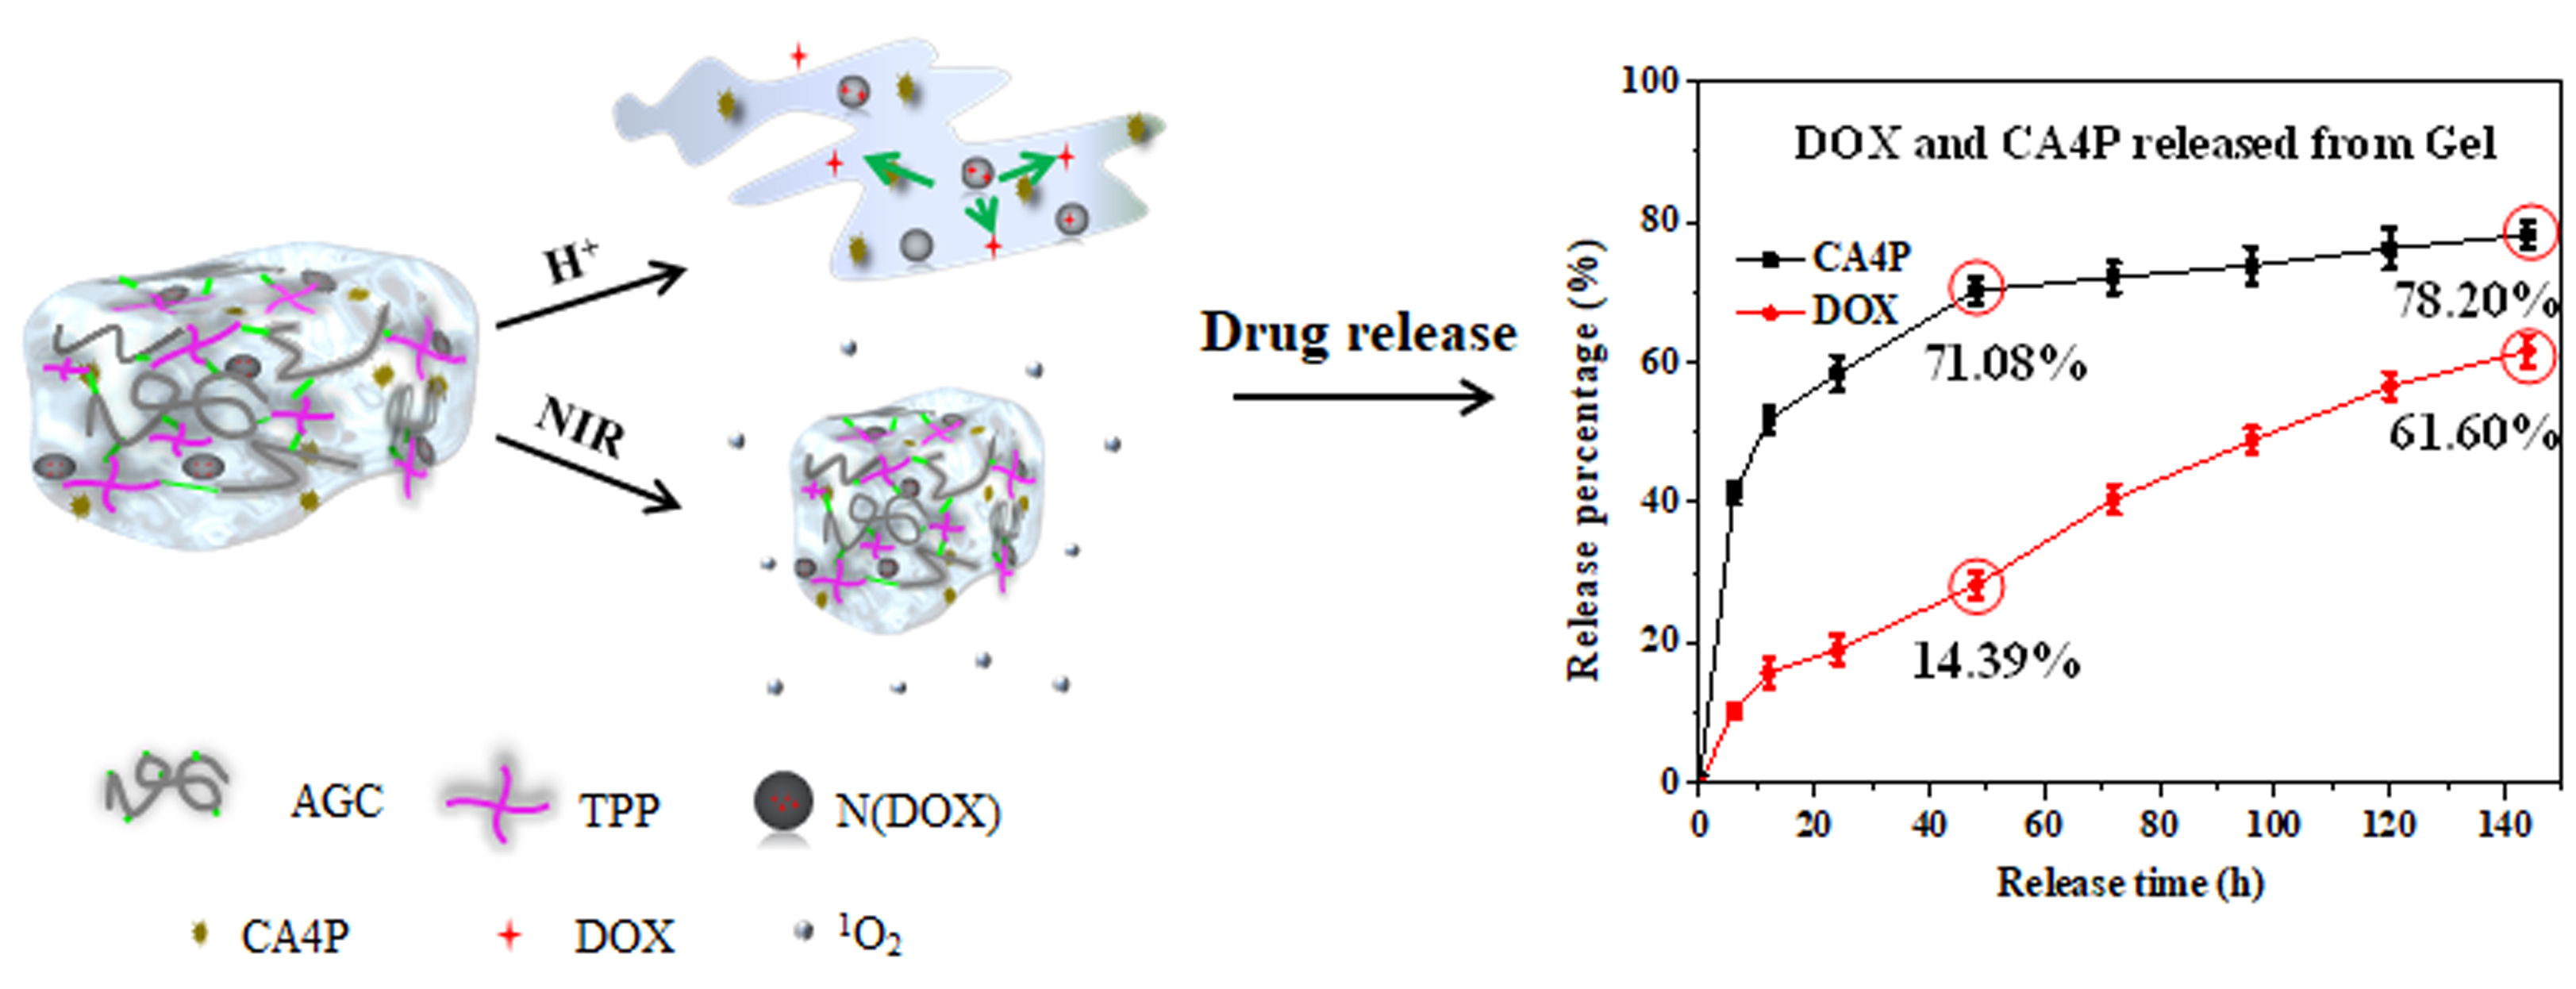
With hollow mesoporous silica (hMSN) and injectable macroporous hydrogel (Gel) used as the internal and external drug-loading material respectively, a sequential drug delivery system DOX-CA4P@Gel was constructed, in which combretastatin A4 phosphate (CA4P) and doxorubicin (DOX) were both loaded. The anti-angiogenic drug, CA4P was initially released due to the degradation of Gel, followed by the anti-cell proliferative drug, DOX, released from hMSN in tumor microenvironment. Results showed that CA4P was mainly released at the early stage. At 48 h, CA4P release reached 71.08%, while DOX was only 14.39%. At 144 h, CA4P was 78.20%, while DOX release significantly increased to 61.60%, showing an obvious sequential release behavior. Photodynamic properties of porphyrin endow hydrogel (φΔ(Gel)=0.91) with enhanced tumor therapy effect. In vitro and in vivo experiments showed that dual drugs treated groups have better tumor inhibition than solo drug under near infrared laser irradiation, indicating the effectivity of combined photodynamic-chemotherapy.
Research
Sequential Drug Delivery By Injectable Macroporous Hydrogels For Combined Photodynamic-Chemotherapy
https://doi.org/10.21203/rs.3.rs-779103/v1
This work is licensed under a CC BY 4.0 License
You are reading this latest preprint version
sequential drug delivery
combretastatin A4 phosphate
doxorubicin
photodynamic therapy
combined photodynamic-chemotherapy
Cancer is still one of the significant threats to human health. Current cancer therapies, such as chemotherapy [1], phototherapy [2], hyperthermia [3] and radiotherapy [4], are widely applied but they have their own limited properties or unavoidable side effects. For example, patients always suffer from serious side effects by intrinsic off-target toxicity of chemotherapy drugs, also endure the possible low effective treatment for the limited relatively short resident time in tumor cells [5]. Phototherapy and hyperthermia against deep tumors may greatly limited by insufficient luminous flux [6]. Radiotherapy can also damage nearby healthy cells beside killing cancer cells [7]. Especially for chemotherapy, the drug’s resident time in tumor cells is relatively short, which limited the theragnostic effect. Therefore, it’s necessary to develop local sequential delivery of multiple drugs for optimal efficacy, potency, and safety. The co-administration of dual drugs with different physicochemical properties and specific administration sequence is very important to overcome drug resistance and reduce side effects in tumor therapy. Anti-cell proliferative drugs, such as doxorubicin (DOX) and paclitaxel (PTX), can kill cancer cells from different proliferation stages. However, due to the support of peripheral blood vessels, the survived tumor cells could still obtain nutrition supply and continue to proliferate [8]. Anti-angiogenic drugs can specifically target vascular growth factors to inhibit the establishment of peri-tumoral blood vessels [9]. CA4P is one of novel angiogenesis inhibitors, which can induce apoptosis by binding tubulin dimers and preventing microtubule polymerization. It’s reported that CA4P has the potential to sensitize drug-resistant MCF-7/ADR cells to DOX due to the inhibition of angiogenesis [10]. Anti-angiogenesis combined with anti-cell proliferation has become a novel tumor therapy strategy, which was referred as "A + strategy" [11]. When both drugs were applied to the tumor site at the right time, they could maximize the therapeutic effect. We hoped to design a system that anti-angiogenic drugs could be released firstly to inhibit the growth of new tumor vasculatures, while anti-cell proliferative drugs could be slowly released and accumulated in the tumor site to effectively kill tumor cells.
Hydrogel is composed of a large amount of water and cross-linked polymers. The abundant water content (70–99%) in hydrogels resembles biological tissues, and they usually have good biocompatibility and loading hydrophilic drugs capacity [12]. Smart hydrogels (temperature responsive [13], pH responsive [14], light responsive [15], or NO responsive [16]) were frequently used in controlled drug release studies due to their unique properties. For example, Kim et al. [17] prepared a hydrogel/microsphere composite, which could sequentially release doxorubicin (DOX) and fluorouracil (Fu) in tumors. Fu was directly encapsulated in the hydrogel, and DOX was loaded in microspheres. Results showed that 80% Fu was released at 72 h, while the release of DOX only reached about 40%, proving that the smart composite hydrogel with nano-sized microspheres could be used as a carrier for the sequential release of different drugs.
To further enhance the therapeutic effect of drugs, photodynamic therapy (PDT) has been used in combination with chemotherapy, magnetic therapy or immunity therapy because of its significant advantages such as causing less trauma, low toxicity, and palliative treatment [18]. Belali et al. [19] used amino-modified 5,10,15,20-tetraphenylporphyrin (TPP) to prepare pH-sensitive hydrogels which could achieve efficient photodynamic therapy effects. Gonzalez-Delgado et al. [20] found that hydrogels enhanced singlet oxygen generation efficiency of porphyrin derivatives when they were encapsulated in hydrogels.
Herein, we designed and prepared a novel injectable macroporous hydrogel for therapy of 4T1 breast cancer, which could load dual distinct tumor drugs (CA4P and DOX) offering a sequentially delivery profile. Furthermore, porphyrin derivatives in hydrogel trigger the formation of reactive oxygen species (ROS), achieving synergistic anticancer effects in photodynamic-chemotherapy combination therapy. The therapeutic efficacy from this combinational photodynamic/sequential chemotherapy was evaluated in vitro and in vivo.
2.1 Chemical and reagents
Tetraethyl silicate (TEOS), triethanolamine (TEA), 5,10,15,20-tetraphenylporphyrin (TPP), (5,10,15,20)-tetra(4-aminophenyl)porphyrin (NH2-TPP), dextran and doxorubicin hydrochloride (DOX·HCl) were all purchased from Shanghai Aladdin Biochemical Technology Co., Ltd. 3-Aminopropyltrimethoxysilane (APS) was purchased from Braunwell Chemical Technology Co., Ltd. CA4P was acquired from Solarbio Science & Technology Co., Ltd. Cetyltrimethylammonium chloride (CTAC) was purchased from Sigma-Aldrich Co., Ltd. Dulbecco's modified Eagle's medium (DMEM), memorial institute medium (RPMI)-1640, 3-(4,5-dimethylthiazol-2-yl)-2,5-diphenyltetrazolium bromide (MTT), 4',6-diamidino-2-phenylindole (DAPI), 1,3-diphenylisobenzofuran (DPBF), 2',7'-dichlorodihydrofluorescein diacetate (DCFH-DA), live/dead cell viability/toxicity kit, and Annexin V-FITC/PI staining kit were all purchased from Vicmed (Xuzhou, China). Caspase 3 polyclonal antibody (caspase 3 PAb) was purchased from Proteintech Co. (USA). PV-6001 rabbit polymer detection system was purchased from Zhongshan Jinqiao Co., Ltd. Trypsin and dimethyl sulfoxide (DMSO) were purchased from Nanjing Key Gen Biotechnology Inc. Dextran (W = 70 kD), chitosan with medium viscosity (200–400 mPa·s), and sodium periodate were purchased from Macklin Biochemical Technology Co., Ltd. Other reagents were all purchased from Sinopharm Group Chemical Reagent Co., Ltd.
2.2 Synthesis of DOX-CA4P@Gel
Hollow mesoporous silica nanoparticle (hMSN) was prepared according to our previous work [21]. Briefly, anhydrous ethanol, double distilled water and 25% ammonia (V:V:V = 180:25:4) were mixed and stirred for 10 min, followed by adding TEOS to acquire silica nanoparticles (dSiO2). After washing with water, dSiO2 was added into the mixed solution of CTAC and TEA, followed by drop-wise adding TEOS and the reaction was carried out at 80°C for 1 h to synthesize dSiO2@SiO2. Na2CO3 powder was then added to it to allow etching dSiO2@SiO2 at 50°C for 30 min. After washing with NaCl:methanol (1%), hMSN was achieved. Finally, hMSN was modified with amino groups on the surface via hydrolyzing APS in absolute ethanol.
Hydrogel OD/TPP was synthesized through a Schiff base reaction between the aldehyde groups from oxidized dextran (OD) and amino groups of porphyrins with the molar ratio of 1:10. Firstly, the adjacent diol groups were oxidized to aldehyde groups by sodium periodate to prepare aldehydated oxidized dextran [22]. Secondly, 10 mg oxidized dextran (dissolved in 1 mL PBS) was mixed with 1 mg NH2-TPP (dissolved in 1 mL DMF) to form OD/TPP. 100 mg chitosan (dissolved in 1% acetic acid) was applied to adjust the gelation level of OD/TPP. hMSN was loaded in OD/TPP by simply mixing during the gelation of OD/TPP. The OD/TPP loaded hMSN was referred as ‘Gel’.
DOX and CA4P was loaded into Gel in different methods to synthesize the composite system DOX-CA4P@Gel. Briefly, DOX·HCl aqueous solution was adjusted to pH 8.0, followed by mixing with hMSN at a mass ratio of 1:1. The mixture was stirred for 24 h at room temperature and the excess DOX was removed to acquire drug-loaded microspheres DOX@hMSN [23]. DOX@hMSN and NH2-TPP were mixed at a mass ratio of 1:5 to acquired system ‘A’, and CA4P was mixed with aldehydated oxidized dextran at a ratio of 1:1 to prepare system ‘B’. DOX-CA4P@Gel was synthesized through a Schiff base reaction between A and B.
2.3 Characterization
The gelation time and the degradation behavior of the hydrogel under different acidic conditions were detected by a MCR 302 rheometer. Transmission electron microscopy (TEM) images were taken on a G2T12 transmission electron microscope (FEI, USA). The morphology of the hydrogel was recorded on a Q25 scanning electron microscope (FEI, USA). The hydrodynamic size and zeta potentials were measured by dynamic light scattering (DLS) (380 ZLS, NICOMP, USA). The chemical compositions were determined by X-ray photoelectron spectroscopy (XPS) (PHI Quantera SXM). All XPS spectra were calibrated by the C 1s peak at 284.6 eV. Infrared absorption spectrum (IR) was recorded on a FTIR 8400 spectrophotometer. UV-Vis and fluorescence spectra were recorded on Hitachi U-3010 and F-4600 spectrophotometer, respectively.
2.4 Drug release measurement
Drug release behavior was evaluated at 37°C by respectively incubating DOX-CA4P@Gel in PBS solution with pH of 5.0, 6.4, and 7.2. CA4P release was measured by high performance liquid chromatograph (HPLC), where chromatographic separation was carried out on an Agilent Zorbax Eclipse Plus C18 column with particles size of 5.0 µm (250 × 4.6 mm) using methanol (0.01% acetic acid)-water (60:40) as the mobile phase at 1 mL/min [24]. The detection wavelength was 305 nm. DOX release was calculated by determining unbound DOX in the solution with UV-vis spectrometry [25].
2.5 Evaluation of singlet oxygen generation efficiency
The optical property of DPBF was sensitively affected by 1O2 [26]. With DPBF as the 1O2 capture agent, the 1O2 generation efficiency of TPP in Gel can be calculated from the slopes of DPBF absorbance variation (410 nm) in the presence of photosensizers. The laser irradiation was 808 nm (0.5 W/cm2), with TPP in DMSO as the control, the 1O2 yield (φ∆) was calculated as follows [3]:

Where φ∆(Gel) represents the singlet oxygen yield of Gel, φ∆(TPP was 0.52. tTPP and tGel is the time for the decrease in absorption of DPBF in the presence of TPP and Gel, respectively.
2.6 Cell culture and animal model
4T1 breast cancer cells and L929 fibroblasts cells were maintained in RPMI 1640 and DMEM medium supplemented with 10% fetal bovine serum and proper antibiotics at 37°C with the supply of 5% CO2. Cells were used when they reached ~ 80% confluence.
All animal procedures were performed in accordance with the National Academy of Sciences' Guidelines on the Care and Use of Laboratory Animals [27], and were approved by the Animal Ethics Committee of Xuzhou Medical University (L20210226103). Tumors were established by subcutaneous injection of 1 × 10⁶ of 4T1 cells suspended in 50 µL of PBS into female Balb/c mice (5-week-old, 18–20 g). Mice were used for therapy study when the tumor diameter reached 5–8 mm, monitored every other day by a caliper measurement.
2.7 Fluorescence microscopy and flow cytometry
MTT assays were carried to evaluate the biocompatibility (without laser irradiation) and the therapeutic efficacy (with laser irradiation) of DOX-CA4P@Gel. DOX-CA4P@Gel at the concentration of 0.01–0.20 mg/mL were respectively incubated with 4T1 and L929 cells for 24, 48, and 72 h. MTT measurement was subsequently carried out to evaluate the cellular toxicity of DOX-CA4P@Gel [28]. To assist the study of the release behavior for CA4P and DOX, MTT assay was used to detect 4T1 cells viability under different incubation conditions, including different media with pH values of 5.0, 6.4 and 7.2, with/without laser irradiation (808 nm, 0.5 W/cm2, and 5 min). All experiments were performed at least three times. Five groups including CA4P@Gel, DOX@Gel, DOX-CA4P@Gel, DOX and CA4P were compared in this work.
The fluorescence microscopy was used to observe the production efficiency of 1O2 and cytotoxic effect of DOX-CA4P@Gel in 4T1 cells. 4T1 cells were cultured at a 24-well plate with concentration of 5×10⁴ cells/mL. After incubation with Gel extracted solution for 24 h with laser irradiation (808 nm, 0.5 W/cm2, and 5 min), the cells were stained with DCFH-DA and DAPI [29]. Cells were analyzed using fluorescence microscopy. Furthermore, the cells were also stained with live/dead staining kits to visually examine the killing effect of DOX-CA4P@Gel under laser irradiation [30].
MACSQuant 10 flow cytometry (Miltenyi Biotec, GER) was also used to study the drug release behavior of CA4P and DOX from DOX-CA4P@Gel. 4T1 cells were dispersed with a final concentration of 1×10⁵/well. CA4P@Gel, DOX@Gel, DOX-CA4P@Gel extracts at different concentrations were incubated with 4T1 cells for 24 h with or without laser irradiation (808 nm, 0.5 W/cm2, and 5 min). Flow cytometry assay was carried out after Annexin V-FITC 5 µL and PI 5 µL staining for 10 min.
2.8 In vivo therapeutic evaluation
The mice bearing 4T1 tumor nodules were randomly divided into 10 groups (n = 8) including PBS (Control), mixture of DOX (0.4 mg) and CA4P (1 mg), Gel, CA4P@Gel, DOX@Gel, DOX-CA4P@Gel, Gel + NIR (near infrared laser), CA4P@Gel + NIR, DOX@Gel + NIR, and DOX-CA4P@Gel + NIR. In this work, an 808 nm laser with 0.5 W/cm2 power intensity was used as the near-irradiation source. During therapy, the body weight and tumor volume (V = L×W2/2) were monitored every other day, where L (mm) and W (mm) are the long and short axes of tumor size, respectively. The tumor inhibition rate (TIR) was calculated using the equation of TIR = (Vc-Vt)/Vc×100%, where Vt and Vc represent the tumor volumes in the treatment group and control group, respectively. After treatment, major organs including heart, liver, spleen, lung and kidney were harvested for the hematoxylin and eosin (H&E) analysis. The 4T1 tumors harvested on day 0, 3, 7, and 14 were also frozen for histological analysis.
2.9 Histology
Major organs were fixed in 4% neutral buffered formalin, transferred routinely into paraffin, sectioned into 6 µm thick slices, stained with H&E and examined by a microscopy with a magnitude of 200×. Tumors were cut into frozen slices of 6 µm thickness. After being fixed with cold acetone for 10 min, the tumor slides were stained with caspase 3 PAb (catalog number: 19677-1-AP) for 1 h, followed by detecting by PV-6001 rabbit kit. The caspase 3 expression was by a confocal microscope at a magnitude of 200×.
3.1 Preparation and characterization of Gel conjugation
As shown in Fig. 1a, hydrogel was obtained by a one-step reaction among OD, chitosan and NH2-TPP, in which the OD-to-NH2-TPP ratio was 1:10, and chitosan (W%=10%) was to adjust the elasticity. As shown in Fig. 1b, the disappearance of characteristic IR absorbance peaks from oxidized dextran (at ~ 1712 cm− 1 for CO-H) and porphyrin derivative (~ 1510 cm− 1 for N-H), and presence of characteristic IR peak from Gel (~ 1650 cm− 1 for C = N) confirm the successful reaction between OD and TPP. The gel-forming behavior under physiological conditions was also evaluated by measuring the storage modulus (G') and loss modulus (G''), where the sol-gel conversion condition could be determined. As shown in Fig. 1c and Fig. 1d, the conversation occurred at ~ 36.5°C for Gel, and ~ 36.8°C for DOX-CA4P@Gel, which indicated that loading of CA4P and DOX did not change the gelation process of TPP, chitosan, and OD. Gel could form within 8.8 min, and DOX-CA4P@Gel formed within 8.5 min. Results showed that the hydrogel can be synthesized quickly at a temperature close to physiological temperature, indicating its injectability in vivo.
As shown in Fig. 2a, DOX was loaded into hMSN to form DOX@hMSN, and then DOX@hMSN was enveloped by OD/TPP together with CA4P to form dual drugs loaded DOX-CA4P@Gel. The morphology and size distribution histogram of hMSN was shown in Fig. 2b. The average diameter of hMSN was 120 nm from TEM assay, smaller than that measured from DLS for hydration effects. Figure 2c and Fig. 2d was SEM images of the lyophilized cross-section of the hydrogel. Results showed that the hydrogel possessed a three-dimensional network structure with a uniform pore size of about 5 µm. Figure 2e-g showed the three-dimensional network structure of the freeze-dried cross-section of hydrogel. The results showed that DOX@hMSN did not affect the morphology of the hydrogel network structure, and the bulges in the three-dimensional structure indicated the locations of hMSN. The surface chemical compositions of the hydrogel layers from XPS also confirmed it. Comparing the X-ray photoelectron spectrum of Gel with that of DOX-CA4P@Gel (Figure S1), the peaks seen at 154.1 eV and 102.5 eV indicate that there were additional Si elements on the surface of Gel, which were resourced from hMSN. According to the absorbance of DOX at 510 nm, the drug loading capacity of DOX in hMSN was 633 mg/g, and 52 mg/g for DOX in hydrogel. The drug loading of CA4P in hydrogel was 12.6 mg/g calculating from HPLC measuring.
Drug sequential release from DOX-CA4P@Gel
DOX-CA4P@Gel was dispersed in phosphate buffer solution (PBS) solution with different pH values, and the elastic modulus of hydrogel was measured using a rheometer. As shown in Fig. 3a, Fig. 3b and Fig. 3c, the energy storage modulus (G'=34,000) of hydrogels at pH of 5.0 was significantly higher than that in pH7.2 (G'=17,000), which proved that the hardness of hydrogels under acidic conditions was more than that in neutral condition, and the hydrogels were more prone to fracture under the same shear force. This result was consistent with the corresponding crushing time (tpH5.0=5.0 min, tpH6.4=5.2 min, tpH7.2=6.4 min). DOX-CA4P@Gel was dispersed in PBS with different pH values, and the degradation of hydrogels was evaluated by measuring the content of decomposed TPP in solution. Results in Fig. 3d showed that the degradation rate of hydrogels was very slow in neutral condition (about 20% at 144 h), while that was significantly increased in weakly acid condition, reaching 65% at 144 h in pH of 6.4. Degradation of hydrogel at pH 5.0 was faster and more than 90% TPP was detected at 144 h. This result testified that pH sensitive degradation of DOX-CA4P@Gel, indicating the application poetical as a tumor-selective drug delivery. The images before and after hydrogel degradation were shown in Fig. 3e and Fig. 3f.
CA4P and DOX exhibited pH sensitive and the release profiles were also observed, where faster release rates were shown at acidic condition (pH 5.0) compared with that in neutral condition (Fig. 3h and Fig. 3i). CA4P and DOX have different release behavior. As shown in Fig. 3j, CA4P was rapidly released at the early stage and relatively stable after 48 h, while DOX released slowly firstly and then go fast after 48 h. 59.13% of CA4P was released from Gel at pH of 6.4 for 48 h, and reached to 63.44% at 144 h (only 5.31% higher than that of 48 h). DOX was intrinsically pH-sensitive. As shown in Fig. 3g, 68.32% of DOX was release at pH of 5.0 for 144 h but only 16.02% released in a buffer with pH 7.4. This significant release characteristics of CA4P and DOX form Gel were shown in Fig. 3j. In the early stage, the release of CA4P was rapid, reaching 71.08% at 48 h, and slowed down in the later stage, reaching only 78.20% at 144 h. As a contrast, DOX released only 14.39% at 48 h, and increased to 61.60% at 144 h.
Photodynamic performance of Gel
In order to prove that the photosensitivity of porphyrin was not changed significantly after the incorporation into the Gel, DPBF was used as the reagent to quantitatively detect the production of singlet oxygen (1O2) in solution. The results of the irradiation of the samples in the presence of DPBF (absorption monitored at 410 nm) with time are shown in Fig. 4a, where the decrease in DPBF absorption over time for Gel compared to TPP, and the decrease was positively correlated with the Gel concentrations (as shown in Fig. 4b). With TPP (φ∆(TPP) = 0.52) as the control [31], the 1O2 yield of TPP@Gel (808 nm, 0.5 W/cm2) was 0.91. After Gel coating, the 1O2 yield of TPP was significantly increased, which may be due to the high viscosity of hydrogel limiting the rotation of porphyrin molecules and avoiding the optical quenching induced by the collision between porphyrin molecules. DCFH-DA was an intracellular singlet oxygen capture agent, and its green fluorescence intensity of cells was directly proportional to the production of 1O2. After incubation of Gel with cells, 1O2 detection was conducted. As shown in Fig. 4c, Gel showed significant green fluorescence, and there was no significant difference in fluorescence intensity between TPP and Gel.
The extracts of blank Gel with different concentrations (0.05, 0.1, 0.15 and 0.2 mg/mL) were incubated with L929 and 4T1 cells for 24, 48 and 72 h, respectively. As shown in Fig. 5a and Fig. 5b, the cellular viabilities of L929 and 4T1 cells were above 85%, indicating that the Gel had no obvious toxicity to cells without laser irradiation. However, the cellular viability significantly decreased after laser treatment (NIR = 808 nm, 0.5 W/cm2, t = 5 min). This result shown in Fig. 5c was particularly significant change at high concentration, that is, at 0.2 mg/ml, the cell viability of the Gel group without laser assistance was 92.43%, while that of with laser group was reduced to 65.31%, with a significant difference (p < 0.05), suggesting that hydrogel has an obvious photodynamic killing effect on 4T1 cells. In order to further intuitively demonstrate the PDT effect of Gel on cancer cells, the live/dead cells staining with calcein AM and PI was carried out. The fluorescence imaging results in Fig. 5d indicated that the proportion of dead cells increased significantly with the elevated concentrations of the Gel extract. Moreover, with the increase of irradiation time (showed in Figure S2), the proportion of dead cells also increased significantly, indicating that the photodynamic treatment effect of hydrogel was obvious concentration and time dependent.
In vitro chemo-photodynamic therapy effect of DOX-CA4P@Gel
Gel, DOX@Gel, CA4P@Gel, and DOX-CA4P@Gel (0.1 mg/ml) were respectively incubated with 4T1 cells for 48 h, and the cell viabilities were measured with or without laser irradiation (808 nm, 0.5 W/cm2, 5 min). PBS was used as the control. As showed in Figure S3, the cell viability of both Gel and DOX@Gel groups were above 90%, indicating that no obvious DOX was released during this period. In contrast, the cell viability of both CA4P@Gel and DOX-CA4P@Gel groups were lower than 70%. Furthermore, cell viability in CA4P@Gel significantly decreased with time lasting to 48 h, indicating that CA4P could be continuously released within 48 h. With laser irradiation, all the groups including Gel + NIR, DOX@Gel + NIR, CA4P@Gel + NIR and DOX-CA4P@Gel + NIR, exhibited enhanced cell killing effect. Especially, the cell activity of DOX-CA4P@Gel + NIR group was lower than 40%, which verified that DOX-CA4P@Gel has significant combinational effect of photodynamic/sequential chemotherapy.
This result was also verified in a flow cytometry assay. As shown in Fig. 6, without laser irradiation, the cell viability (95.5%) of DOX@Gel was not significantly different from that of Gel (95.8%), while CA4P@Gel and DOX-CA4P@Gel decreased to 79.5% and 66.6%, respectively. This is due to DOX-CA4P@Gel mainly showed the release of CA4P within 24 h, while DOX did not show obvious tumor killing effect because of its late release. Furthermore, after the same sample treatment, the cell viability with laser irradiation was significantly lower than that of the non-irradiated group, especially the cell viability of DOX-CA4P@Gel + NIR group decreased from 66.6–53.3%, reflecting obvious combined treatment effect.
Comparing the cell viability of groups (longitudinal groups) without laser assistance, results showed that after 24 h of co-incubation with 4T1 cells, only CA4P@Gel (79.5%) and DOX-CA4P@Gel (66.6%) was significantly lower than that of control group (95.3%), while DOX@Gel group was not significantly different from the control group, which proved that early release of CAP4P from DOX-CA4P@Gel was the major reason for cell toxicity before 24 h. Comparing the Gel groups (lateral groups), it was found that the cell viability with laser assistance was significantly lower than that of the without laser assistance group, especially DOX-CA4P@Gel + NIR was only 50%.
Combinational therapy of DOX-CA4P@Gel
The 4T1 tumor-bearing mice were respectively treated by a single intratumor injection administration of PBS, Free DOX/CA4P (mixture of 0.4 mg DOX and 1 mg CA4P), Gel, CA4P@Gel, DOX@Gel, DOX-CA4P@Gel, Gel + NIR, CA4P@Gel + NIR, DOX@Gel + NIR, DOX-CA4P@Gel + NIR, where NIR was illuminated for 5 min every other day. The body weight, tumor volume and weight of the mice were recorded every day, and the tumor inhibition rate was calculated with PBS as the control group. As can be seen from Fig. 7a, 7b, and 7c, the tumor in the CA4P@Gel group grew slowly in the first 6 days and then accelerated, while the tumor in the DOX@Gel group grew rapidly in the first 6 days but slowed down significantly within 6–12 days, which may be explained by the sequential release of CA4P and DOX. With the assistance of laser, the comparison of treatment results between the DOX-CA4P@Gel + NIR group and other groups showed that the tumors in the DOX-CA4P@Gel + NIR group were the smallest and significantly different from those in other groups (p < 0.01), indicating that sequential delivery therapy combined with photodynamic therapy had a significant impact on tumor growth. It should be noted that after 18 days of treatment, tumor growth was accelerated in the DOX/CA4P group, with tumor volume greater than that of CA4P-DOX@Gel, which may be due to the fact that CA4P stimulated the formation of tumor vascular collateral after a single dose, thus accelerating tumor growth. In the DOX-CA4P@Gel system, CA4P plays its role first, followed by DOX and PDT. Sequential drug release combined with photodynamic therapy can effectively inhibit tumor growth to a certain extent. The therapeutic effect of each group was also evaluated by measuring tumor weight, and the results were shown in Fig. 7d. The results showed that the tumor weight of the DOX-CA4P@Gel + NIR group was the lowest, which was consistent with that of tumor volume growth curves. As showed in Fig. 7e, the calculated tumor inhibition rate was about 70% for DOX-CA4P@Gel + NIR group, which was significantly different from other groups (p < 0.01).
The expression of caspase 3 and DOX fluorescence intensity were used to characterize the location of CA4P and DOX. CA4P can specifically bind to vascular growth factor and prevent its interaction with the receptor, thereby causing apoptosis. The activity of caspase 3 reflects the apoptotic status of tumor cells. At different time points, the caspase 3 activity (apoptotic inducing factor) in the tumors of the DOX-CA4P@Gel group was detected by immunohistochemistry. Results in Fig. 8 showed that compared with that in control group, the caspase 3 expression was significantly up-regulated, reaching the peak on the 3rd day, and gradually went down in the subsequent treatment period. DOX release and accumulation in tumor sections of the DOX-CA4P@Gel group at different time points (3, 6, 10, 14 days) were measured by the fluorescence properties of DOX. The results showed that DOX fluorescence in tumor tissues was extremely weak at the initial stage of treatment (within 2 days), suggesting DOX-CA4P@Gel accumulating in the tumor. With the extension of time (at the 6th days), it retained in tumor for more than 14 d.
In vivo safety evaluation
To evaluate the possible systemic toxicity, body weigh variation and H&E staining was carried out. Figure S4 showed that there was no significant statistical difference in the body weight of mice between the control group and each treatment group, indicating that the therapeutic agent had no significant toxicity in vivo. H&E staining of the representative tissue sections, including heart, liver, spleen, lung and kidney was carried out for the mice treated with PBS and different Gel conjugates at day 21. As shown in Figure S5, no observable systemic toxicity was noted in all the organs of the tumor-bearing mice treated with the drug-loaded hydrogel groups.
With biocompatible dextran oxide, chitosan, porphyrin and hMSN as the starting materials, a dual drug carrying system DOX-CA4P@Gel was constructed, which could be injected in tumor and play therapeutic roles in situ. Good biocompatibility DOX-CA4P@Gel was verified by cell tests and H&E staining. Studies on the properties of the materials show that Gel can be degraded slowly under tumor microenvironment, and DOX and CA4P released sequentially for tumor therapy at different time. Animal model experiments showed that DOX-CA4P@Gel + NIR could effectively enhance therapy effect due to the sequential drugs release and photodynamic performance. The DOX-CA4P@Gel constructed in this work is simultaneously injectable, biodegradable, sequentially releasable and photodynamic, providing a feasible route to reduce drug resistance and improve cancer therapy efficiency.
Acknowledgements
Some structural performances were characterized by Dr. Ma from Beijing University of Chemical Technology, and we would like to thank her for his help.
Authors’ contributions
Yuanyuan performed the data analyses and wrote the manuscript. Yuanyuan, Li and Zhenghao performed the experiment. Shian and Yunsu contributed significantly to analysis and manuscript preparation. Hao helped perform the analysis with constructive discussions. DY contributed to the conception of the study. All authors read and approved the final manuscript.
Funding
National Natural Science Foundation of China (61901405), Natural Science Foundation of Jiangsu Province, China (BK20201156), Xuzhou Natural Science Foundation, China (KC18108 and KC19066) and Excellent Talents Scientific Research Project (D2019026), and Founded by China Postdoctoral Science Foundation (2020M671608).
Availability of data and materials
All data analyzed during this study are included in this published article.
Ethics approval and consent to participate
Not applicable.
Consent for publication
All authors of this work consent to the publication of the paper.
Competing interests
The authors declare that they have no known competing financial interests or personal relationships that could have appeared to influence the work reported in this paper.
- Wu X, Wu Y, Ye H, Yu S, He C, Chen X. Interleukin-15 and cisplatin co-encapsulated thermosensitive polypeptide hydrogels for combined immuno-chemotherapy. J Control Release. 2017;255:81–93.
- Dong X, Chen H, Qin J, Wei C, Liang J, Liu T, Kong D, Lv F. Thermosensitive porphyrin-incorporated hydrogel with four-arm PEG-PCL copolymer (II): doxorubicin loaded hydrogel as a dual fluorescent drug delivery system for simultaneous imaging tracking in vivo. Drug Deliv. 2017;24:641–50.
- Belali S, Savoie H, O'Brien JM, Cafolla AA, O'Connell B, Karimi AR, Boyle RW, Senge MO. Synthesis and characterization of temperature-sensitive and chemically cross-linked poly(N–isopropylacrylamide)/photosensitizer hydrogels for applications in photodynamic therapy. Biomacromol. 2018;19:1592–601.
- Burt LM, Ying J, Poppe MM, Suneja G, Gaffney DK. Risk of secondary malignancies after radiation therapy for breast cancer: Comprehensive results. Breast. 2017;35:122–9.
- Chen H, Zhao Y. Applications of light-responsive systems for cancer theranostics. ACS Appl Mater Interfaces. 2018;10:21021–34.
- Zhang Q, Li L. Photodynamic combinational therapy in cancer treatment. J Buon. 2018;23:561–7.
- Lieshout HF, Bots CP. The effect of radiotherapy on dental hard tissue-a systematic review. Clin Oral Investig. 2014;18:17–24.
- Jiang J, Shen N, Song WT, Yu HY, Sakurai K, Tang ZH, Li G. Combretastatin A4 nanodrug combined plerixafor for inhibiting tumor growth and metastasis simultaneously. Biomater Sci. 2019;7:5283–91.
- Brown AW, Holmes T, Fisher M, Tozer GM, Harrity JPA, Kanthou C. Evaluation of sydnone-based analogues of combretastatin A-4 phosphate (CA4P) as vascular disrupting agents for use in cancer therapy. ChemMedChem. 2018;13:2618–26.
- Zhu JF, Hu MY, Qiu LY. Drug resistance reversal by combretastatin-A4 phosphate loaded with doxorubicin in polymersomes independent of angiogenesis effect. J Pharm Pharmacol. 2017;69:844–55.
- Zhu JF, Xu XP, Hu MY, Qiu LY. Co-Encapsulation of combretastatin-A4 phosphate and doxorubicin in polymersomes for synergistic therapy of nasopharyngeal epidermal carcinoma. J Biomed Nanotechnol. 2015;11:997–1006.
- Bardajee GR, Hosseini SS, Ghavami S. Embedded of nanogel into multi-responsive hydrogel nanocomposite for anticancer drug delivery. J Inorg Organomet P. 2018;28:2196–205.
- Niu H, Li XF, Li HC, Fan ZB, Ma JJ, Guan JJ. Thermosensitive, fast gelling, photoluminescent, highly flexible, and degradable hydrogels for stem cell delivery. Acta Biomater. 2019;83:96–108.
- Zhao LL, Zhu LJ, Liu FY, Liu CY, Shan-Dan, Wang Q, Zhang CL, Li JL, Liu JG, Qu XZ, Yang ZZ. pH triggered injectable amphiphilic hydrogel containing doxorubicin and paclitaxel. Int J Pharmaceut. 2011;410:83–91.
- Gao G, Jiang YW, Jia HR, Wu FG. Near-infrared light-controllable on-demand antibiotics release using thermo-sensitive hydrogel-based drug reservoir for combating bacterial infection. Biomaterials. 2019;188:83–95.
- Park J, Pramanick S, Park D, Yeo J, Lee J, Lee H, Kim WJ. Therapeutic-gas-responsive hydrogel. Adv Mater. 2017;29:1702859.
- Kim DY, Kwon DY, Kwon JS, Park JH, Park SH, Oh HJ, Kim JH, Min BH, Park K, Kim MS. Synergistic anti-tumor activity through combinational intratumoral injection of an in-situ injectable drug depot. Biomaterials. 2016;85:232–45.
- Bera K, Maiti S, Maity M, Mandal C, Maiti NC. Porphyrin-gold nanomaterial for efficient drug delivery to cancerous cells. ACS Omega. 2018;3:4602–19.
- Belali S, Karimi AR, Hadizadeh M. Cell-specific and pH-sensitive nanostructure hydrogel based on chitosan as a photosensitizer carrier for selective photodynamic therapy. Int J Biol Macromol. 2018;110:437–48.
- Gonzalez-Delgado JA, Castro PM, Machado A, Araujo F, Rodrigues F, Korsak B, Ferreira M, Tome JPC, Sarmento B. Hydrogels containing porphyrin-loaded nanoparticles for topical photodynamic applications. Int J Pharmaceut. 2016;510:221–31.
- Dong JJ, Yao XY, Sun SA, Zhong YY, Qian CT, Yang DZ. In vivo targeting of breast cancer with a vasculature-specific GQDs/hMSN nanoplatform. RSC Adv. 2019;9:11576–84.
- Zhao X, Li P, Guo BL, Ma PX. Antibacterial and conductive injectable hydrogels based on quaternized chitosan-graft-polyaniline/oxidized dextran for tissue engineering. Acta Biomater. 2015;26:236–48.
- Yang DZ, Yao XY, Dong JJ, Wang N, Du Y, Sun SA, Gao LP, Zhong YY, Qian CT, Hong H. Design and investigation of core/shell GQDs/hMSN nanoparticles as an enhanced drug delivery platform in triple-negative breast cancer. Bioconjugate Chem. 2018;29:2776–85.
- Venegas B, Zhu WW, Haloupek NB, Lee J, Zellhart E, Sugar IP, Kiani MF, Chong PLG. Cholesterol superlattice modulates CA4P release from liposomes and CA4P cytotoxicity on mammary cancer cells. Biophys J. 2012;102:2086–94.
- Jin S, Wan JX, Meng LZ, Huang XX, Guo J, Liu L, Wang CC. Biodegradation and toxicity of protease/redox/pH stimuli-responsive peglated pmaa nanohydrogels for targeting drug delivery. ACS Appl Mater Interfaces. 2015;7:19843–52.
- De Baroid AT, McCoy CP, Craig RA, Carson L, Andrews GP, Jones DS, Gorman SP. Optimization of singlet oxygen production from photosensitizer-incorporated, medically relevant hydrogels. J Biomed Mater Res B. 2017;105:320–6.
- National Research Council. Guide for the care and use of laboratory animals. 8th ed. Washington DC: The National Academies Press; 2011.
- Dai TJ, Wang CP, Wang YQ, Xu W, Hu JJ, Cheng YY. A nanocomposite hydrogel with potent and broad-spectrum antibacterial activity. ACS Appl Mater Interfaces. 2018;10:15163–73.
- Xia LY, Zhang XD, Cao M, Chen Z, Wu FG. Enhanced fluorescence emission and singlet oxygen generation of photosensitizers embedded in injectable hydrogels for imaging-guided photodynamic cancer therapy. Biomacromol. 2017;18:3073–81.
- Wang JP, Liu L, You Q, Song YL, Sun Q, Wang YD, Cheng Y, Tan FP, Li N. All-in-one theranostic nanoplatform based on hollow mosx for photothermally-maneuvered oxygen self-enriched photodynamic therapy. Theranostics. 2018;8:955–71.
- Korínek M, Dědic R, Molnár A, Svoboda A, Hála J. A comparison of photosensitizing properties of meso-tetraphenylporphin in acetone and in dimethyl sulfoxide. J Mol Struct. 2005;744:727–31.