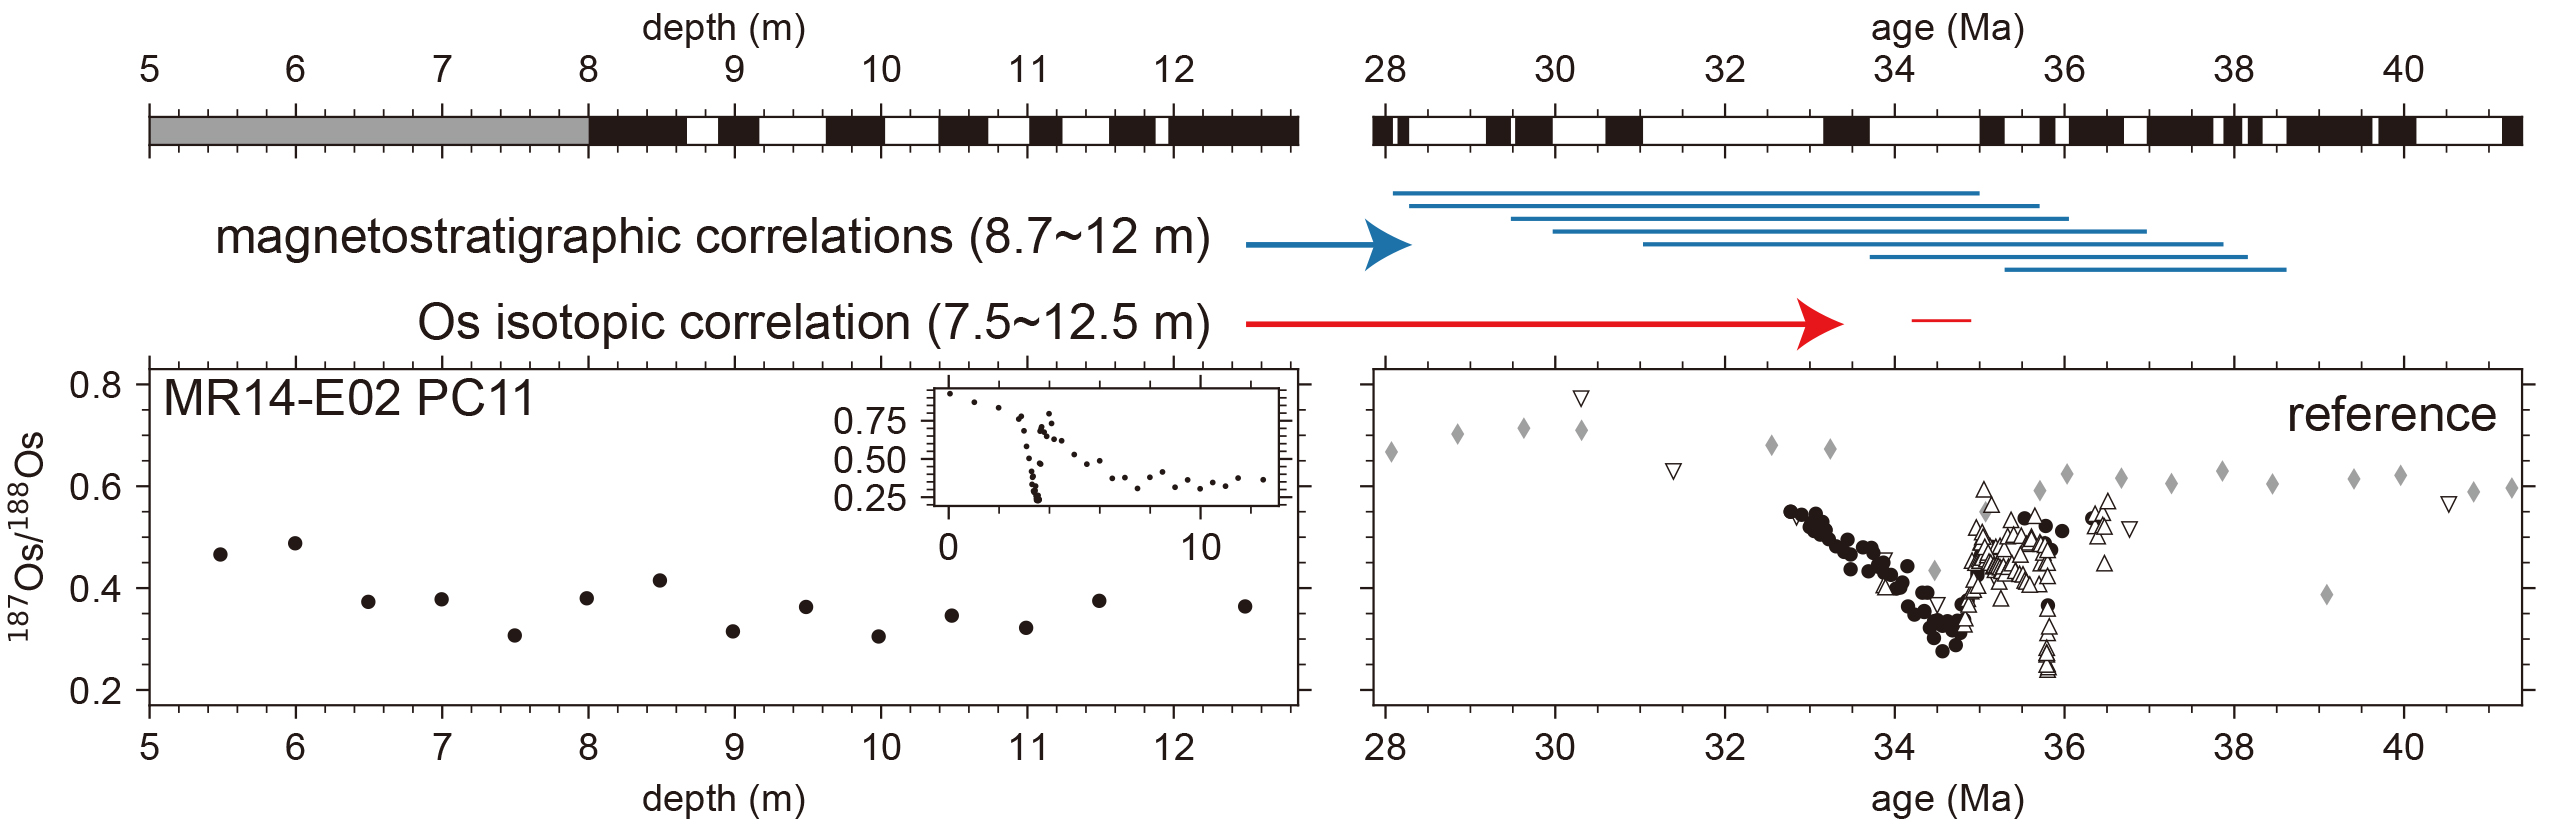
Paleomagnetic data show that there are at least 12 polarity zones in 8–12 m (Fig. 1). 187Os/188Os were as low as 0.3 in 7–12 m (Fig. 3), and previous interpretations correlated them to the late Eocene excursion (Nozaki et al., 2019; Fig. 3). However, this interpretation would put 7–12 m into a single chron of C13r. Rock magnetic properties change smoothly in this interval (Fig. 1), so these polarity zones are likely to reflect the geomagnetic reversals rather than short scale variations in overprint.
Because there are only ichthyoliths stratigraphy constraints suggesting late Eocene – early Oligocene ages for the corresponding 1st REY peak in KR13-02 PC05 (Ohta et al., 2020), we cannot correlate the observed polarity zones with GPTS uniquely. Nonetheless, based on the ichthyoliths data and the low 187Os/188Os, we infer that the late Eocene 187Os/188Os excursion (~ 34.5 Ma) is somewhere in 7–12 m. With this inference, we can list possible correlations with GPTS (Table 1). The deepest polarity transition (11.96 m), which coincide with the beginning of the 1st REY peak, would be between 34.999 to 38.615 Ma, and the shallowest polarity transition (8.67 m), which is deeper than the end of the 1st REY peak (7 m), would be between 28.087 to 35.294 Ma. All of these magnetostratigraphic correlations indicate that the deposition of the 1st REY peak took much longer (3.3–7.4 Myr) than the 187Os/188Os ages (< 1 Myr; Nozaki et al., 2019; Ohta et al., 2020).
Inconsistency between the magnetostratigraphy and 187Os/188Os ages can be compared in terms of the eolian flux. The chemical digestion results (Fig. 2) show that quartz and feldspars account for ~ 10–20 wt.% of the dry sediment of the 1st REY peak. 187Os/188Os suggest the sedimentation rate of ~ 3.3 m/Myr for the 1st REY peak of MR14-E02 PC12 (Nozaki et al., 2019). Using a typical dry bulk density of 500 kg/m3 (Ohta et al., 2020), these numbers are converted to a quartz and feldspars flux of ~ 165–330 kg/m2/Myr. Typically, quartz and feldspars account for 10–20 wt.% of eolian dust (Blank et al. 1985; Leinen et al. 1994; Usui et al. 2018), which is broadly consistent with our estimate of ~ 20–30 wt.% of the silicate. These numbers indicate > 500 kg/m2/Myr of eolian flux. This is comparable to the current flux to the Pacific at ~ 16 ºN (Rea, 1994), where Minamitorishima Island was at ~ 35 Ma. However, multiple records from the North Pacific indicated that the eolian flux has increased by more than tenfold since 25 Ma (e.g., Zhang et al. 2016). Only a few estimates exist for flux before 30 Ma, but it may be even smaller between 35–45 Ma (Janecek and Rea 1983; Janecek 1985). Thus, the flux estimates based on the 187Os/188Os seem too large. In contrast, magnetostratigraphy suggests sedimentation rates of 0.44–0.99 m/Myr in the 1st REY peak (Table 1). They are converted to eolian flux estimates of ~ 70–500 kg/m2/Myr. The lower end of the range is consistent with the evolution of the eolian flux in the North Pacific. Therefore, we argue that the 187Os/188Os ages overestimate the sedimentation rate of the 1st REY peak. We further consider that GPTS correlations which give slower sedimentation rates (< 0.5 m/Myr) are more plausible, implying that the deposition of 1st REY took more than 6.5 Myr and completed more recently than 31 Ma (Table 1).
The proposed revision of the chronology for the 1st REY peak affects the estimates of fish debris accumulation rates and the origin of the REY peaks. On the basis of the 187Os/188Os ages, Ohta et al. (2020) estimated high fish debris accumulation rates of > 300 kg/m2/Myr for the 1st REY peak in KR13-02 PC05. Our paleomagnetic data indicate that the deposition of the 1st REY peak may have taken 10–30 times longer; the eolian flux estimates prefer the larger end of the range. Therefore, we suggest that the maximum fish debris accumulation rate in the 1st REY peak was on the order of 10 kg/m2/Myr. Indeed, assuming a fish debris content of 20 wt.%, the maximum fish debris accumulation rate for MR14-E02 PC11 can be estimated as 44–99 kg/m2/Myr. The fact that the REY content shows sharp maxima even within the 1st REY peak indicates significant temporal variation of the fish debris accumulation. Cenozoic fish debris accumulation rate in the central North Pacific can be estimated using data from the core LL44-GPC3 (Kyte et al. 1993). Assuming that P2O5 is exclusively in fish debris at ~ 30 wt.% (Kon et al. 2014; Takaya et al. 2018), the estimated rate was mostly below 10 kg/m2/Myr except for a peak at ~ 66 Ma and another, smaller peak at ~ 58 Ma (see Additional file 1). Thus, the formation of the 1st REY peak around Minamitorishima Island still requires an explanation.
Ohta et al. (2020) suggested that the enhanced fish debris accumulation is related to the bottom water upwelling during the brief ice volume expansion at ~ 34.15 Ma (Katz et al., 2008). While upwelling is still a viable hypothesis, the paleomagnetic chronology indicates that the 1st REY peak reflects longer-term changes in ocean circulations. The present paleomagnetic chronology cannot place unique ages (Table 1); a better chronology is needed to test the connections to specific paleoenvironmental events for the beginning and end of the 1st REY peak.
187Os/188Os in the 1st REY peak are all close to the minimum values reported for the late Eocene excursion (Fig. 3). The magnetostratigraphy requires homogenization of 187Os/188Os. Complete mechanical mixing by processes such as bioturbation over ~ 5 m interval is unlikely, and they would also destroy the polarity records. So, we suspect chemical remobilization of Fe-Mn oxyhydroxides as a cause of the homogeneous 187Os/188Os. The 1st REY peak represents enhanced flux of fish debris, which may have brought oxic-anoxic transition zone to shallow depths, promoting diagenetic movement of Mn (Mewes et al. 2014; Wegorzewski and Kuhn 2014).
A simple averaging of the seawater 187Os/188Os curve does not yield long-term lows as observed in the core (Fig. 3). We note three factors that help to resolve this inconsistency. First, Os influx to sediment may be variable, so homogenization involves taking weighted averages. If the original Os deposition was sufficiently larger during the isotopic excursion than other period, then the 187Os/188Os after homogenization would be low, and Os content would be high. This is qualitatively consistent with the elevated Os content in the 1st REY peak of KR13-02 PC05 (Ohta et al., 2020); however, the Os content of MR14-E02 PC11 does not show a similar pattern (Nozaki et al., 2019), so the contribution of this factor may be limited. Second, 187Os/188Os may not be globally uniform, so the comparison of the absolute values may not be appropriate (e.g., Peucker-Ehrenbrink and Ravizza 2012). Finally, the 187Os/188Os of pelagic sediments may be contaminated by unradiogenic extraterrestrial components to yield lower values (e.g., Peucker-Ehrenbrink and Ravizza 2000). The 187Os/188Os in the Minamitorishima samples were analyzed using the Carius tube methods with reverse aqua regia (Shirey and Walker 1995). Some argued that more diluted leaching solution (0.15% H2O2) should be used to minimize the effect of extraterrestrial components (Turekian and Pegram 1997). These factors may affect the 187Os/188Os dating outside the 1st REY peak as well.