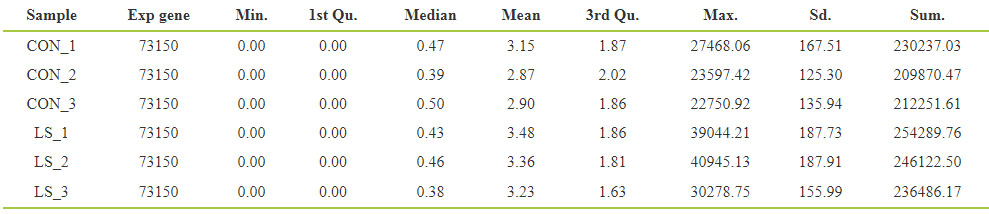
mRNA expression profile of VLS patients mRNA
Sequencing was performed in three samples of vulva lichen scleroid tissue and three samples of normal tissue. Through the analysis, 262,922 transcripts were identified, corresponding to 73,150 genes. FPKM (Fragments Per Kilobase of exon model Per Million mapped reads) was used to measure the abundance of gene expression, and the expression abundance of known genes in different samples was counted by FPKM. FPKM denotes the number of sequence fragments per thousand transcriptome per million sequence bases, and FPKM value denotes the gene expression level. The results are shown in Table 1. The expression values in the above table were distributed statistically, and the expression levels of VLS genes were understood from the overall level by using the FPKM box chart of the samples, and the reproducibility of the designed samples was preliminarily judged (Fig. 1A). The respective expression levels of different samples were processed to compare the changes of mRNA expression trends among different samples. The difference expression of mRNA was displayed with density distribution diagram (Fig. 1B). According to the length distribution of the ORF region of mRNA, the statistical histogram was performed (Fig. 1C).
The mRNA expression was differentially expressed in VLS patients
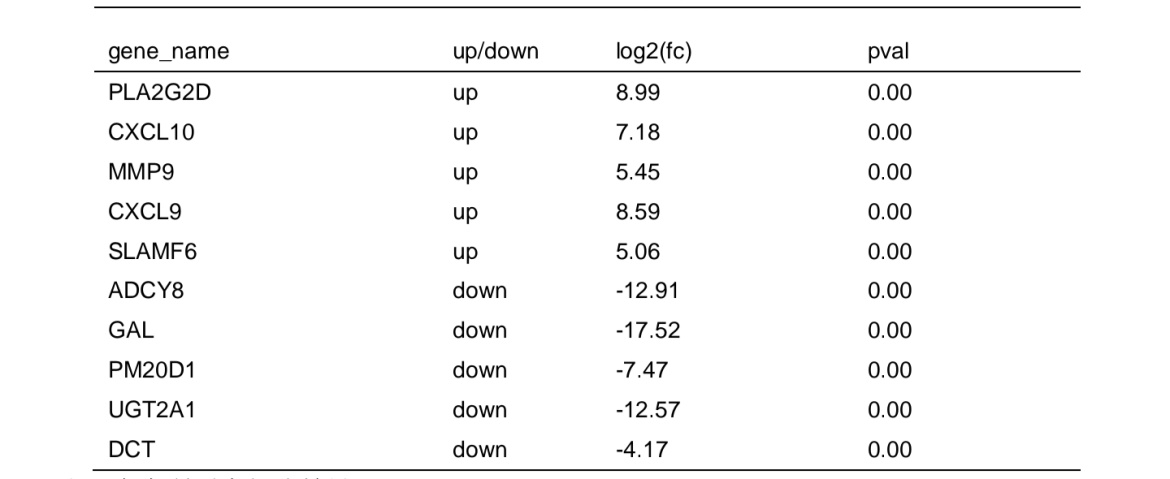
Based on screening threshold, the figure in the volcano identified a total of 1545 differentially expressed mRNA, LOGFC | > 1, P values < 0.05, of which 1541 were raised, lowered 1004 (Fig. 2A). Table 2 listed the ten mRNAs with the largest expression differences (up-regulated and down-regulated). It showed a statistical histogram based on the down-regulation frequency of significantly differentially expressed genes in Fig. 2B. Cluster analysis was performed in the VLS chain specific library. In order to better intuitively reflect the clustering expression pattern, we used Log10 (FPKM+1) to process the gene expression(Fig.2C).
Pathway enrichment analysis of differentially expressed genes
The GO function enrichment analysis and KEGG pathway enrichment analysis of mRNA host genes showed significant difference (P<0.05). A total of 902 GO BPs (biological processes), 109GO CC (cellular components), 235 GO MF (molecular functions), 1246 functional and KEGG pathways were enriched. Differentially expressed mRNAs were involved in signal transduction and protein binding in the plasma membrane (Fig. 3A). The GO enrichment analysis results were statistically analyzed by GGplot2, and the results were presented in the form of scatter plots (Fig. 3B). 'Cytokine-cytokine receptor interactions' and' chemokine signaling pathways' are significant pathways (Fig. 3C).
Expression profile of lncRNA in VLS patients
We removed known mRNAs and transcripts less than 200bp, and then used CPC (Coding Potential Calculator) and CNCI (Coding non-coding Index) software to predict the remaining transcripts by lncRNA. If these remaining transcripts had the potential to encode proteins, we classified them as NOVEL mRNAs and then defined them as mRNA and filtered them. The CPC and CNCI scores of lncRNAs in each sample were statistically analyzed, and the results were expressed in box diagram (Fig. 4A and B) for genomic visualization of lncRNA levels in different samples (Fig. 4C). We made statistics on the percentages of different class codes of lncRNAs in each sample, and the results were shown in a pie chart (Fig. 4D).
Differential expression of lncRNA in VLS patients
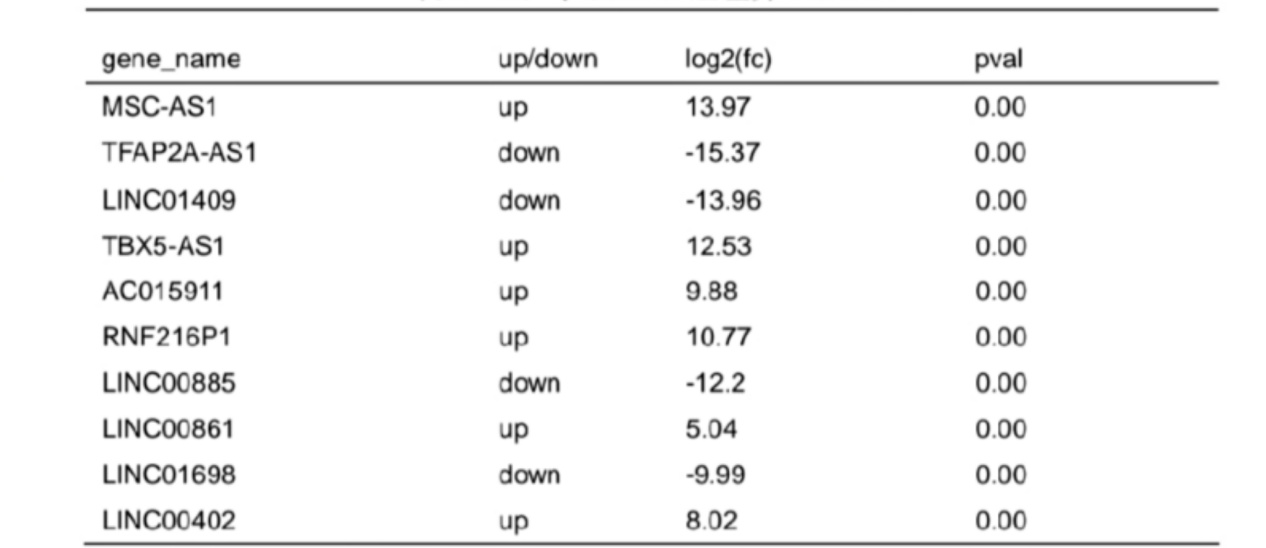
Based on screening threshold, the figure in the volcano identified a total of 1453 differentially expressed LncRNA, LOGFC | > 1, P values < 0.05, of which 812 were raised, lowered 641 (figure 2 a). Table 3 lists ten lncRNAs with the largest expression differences (up-regulated and down-regulated). Fig. 2B shows a statistical histogram based on the down-regulation frequency of significantly differentially expressed genes. Cluster analysis was performed in the VLS chain specific library. In order to better intuitively reflect the clustering expression pattern, we used Log10 (FPKM+1) to process the gene expression (Fig. 2C).
circRNA expression profile in VLS patients
The FPKM box chart of the samples was used to understand the gene expression level of VLS from the overall level and preliminarily judge the repeatability of the designed samples (Fig. 1A). The respective expression levels of different samples were processed to compare the changes in the expression trend of circRNA among different samples. We had analyzed the expression distribution in circRNAs, and the results were displayed with a density distribution diagram (Fig. 1B). The pie chart analysis was performed according to the number distribution of circRNA types (Fig. 1c).
CircRNA was differentially expressed in VLS patients
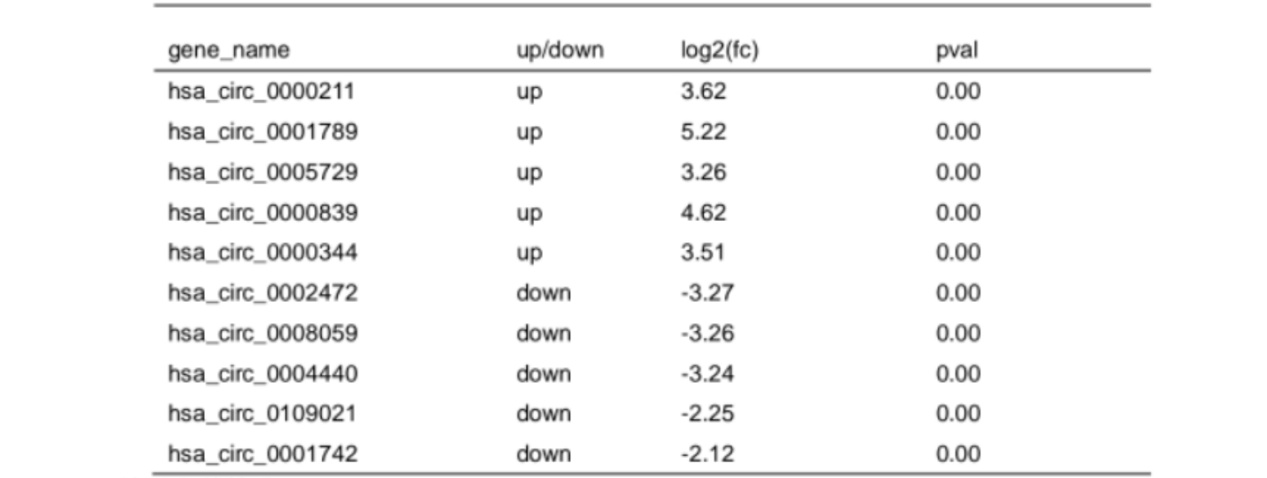
Based on screening threshold, the figure in the volcano identified a total of 79 differentially expressed circRNA, LOGFC | > 1, P values < 0.05, of which 54 were raised, lowered 25 (FIG. 7 a).We summarized the 10 circRNAs with the most significant expression differences (5 up-regulated and 5 down-regulated) in Table 4. Fig. 7B shows a statistical histogram based on the down-regulation frequency of significantly differentially expressed genes. Cluster analysis was performed in the VLS chain specific library. In order to better intuitively reflect the clustering expression pattern, we used Log10 (FPKM+1) to process the gene expression (Fig. 7C).
Pathway enrichment analysis of differentially expressed genes
The enrichment analysis between GO function and KEGG pathway of circRNAs host genes showed significant differences (P<0.05). After research, we found that the differentially expressed circRNAs in VLS enriched a total of 229 GO-BPs, 22 GO-CCs and 22 GO-MFs. In addition, we also found that 273 functions were related to the KEGG pathway. The differentially expression of circRNAs were associated with negative regulation of DNA transcription and positive regulation of RNA polymerase II transcription in the nucleus (Fig. 3A). The GO enrichment analysis results were statistically analyzed by GGplot2, and the results were presented in the form of scatter plots (Fig. 3B). The 'human T-cell leukemia virus 1 infection' and 'axon-directed' signaling pathways are significant pathways (Fig. 3C).
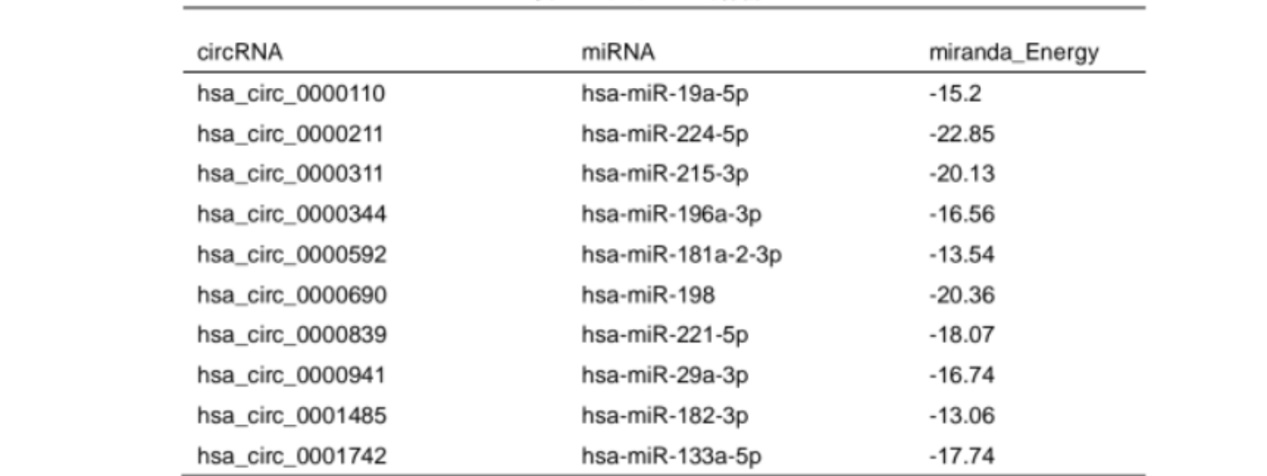
Interactions between circRNA and miRNA were analyzed
The interaction of circRNA-miRNA was predicted by TargetScan and miRANDA. TargetScan predicted miRNA target based on seed region. MiRanda is mainly based on the binding free energy of circRNA and miRNA. The smaller the free energy, the stronger the binding ability of the two. The results are shown in Table 5.