3.1 Analysis of Fourier Transform Infra Red (FT-IR)
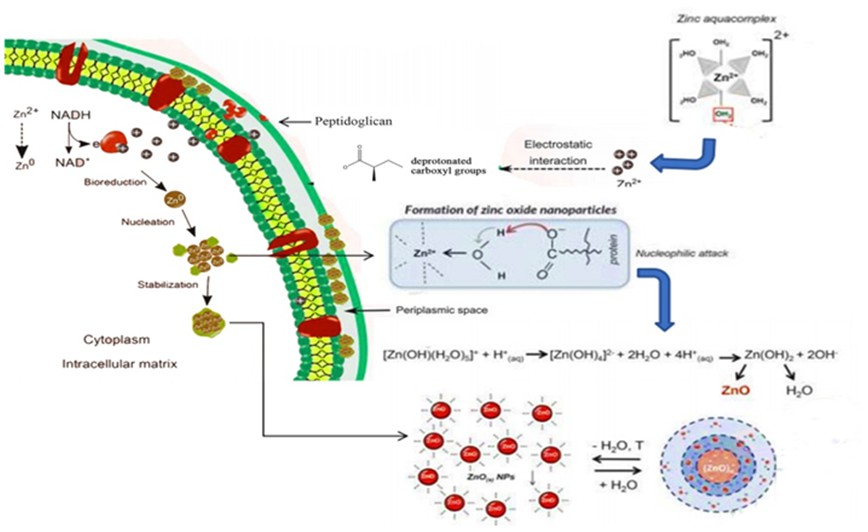
The mechanism for the ZnO formation at different biosynthetic pH should present similar steps [27], as the first reaction was related to the solubility of the zinc precursor (Zn(NO3)2), precipitate (Zn(OH)2) core development, and the stability for crystal growth in the presence of a capping agent substitution. Furthermore, Fig. 1 indicates the FT-IR spectrum of ZnO biosynthesis at different pH, as the analysis showed that there were functional associations at the absorption band intensity of 3385 cm− 1, namely the strain vibration of the O-H group [32]. The intensity of 1640 − 1635 cm− 1 was also the strain vibration of N-H bond, which was obtained from the amino acids of A. niger intracellular enzymes. Also, the methyl group (-CH3) of the surfactant CTAB (Cetyltrimethyl ammonium bromide) was used as a template for the formation of ZnO nanorods. The absorption band intensity at ~ 860 cm-1 was also Zn–OH, which was obtained from the hydrolysis of Zn(NO3)2 precursor in the pH medium of 6.0–13.0. However, the intensity of 584–401 cm− 1 was indicated as an O-Zn-O group [33].
The morphological pattern of ZnO formed adjusted to the pH of the biosynthetic media (6.0–13.0), due to the difference in the intensity of the absorption band produced from each functional group. Furthermore, Fig. 2a indicated the spectrum of ZnO biosynthesis in a slightly acidic medium (pH = 6.0), as the absorption intensity of N-H and O-H was lower in the basic channel. The Zn(NO3)2 precursor was not completely hydrolyzed at the conditions of pH = 6.0, as the Zn+ 2 ion precipitation into Zn(OH)2 was unstable. More energy was also needed for phase transitions in the formation of ZnO nanostructures [34]. Furthermore, Figs. 2b and 2c represented the ZnO biosynthesis at pH = 8.0 and 10.0, respectively, as the spectrum showed that the intensity of the absorption band was greater at a wavenumber of 584–401 cm− 1. The crystal formed was also observed to be more stable, due to being indicated by a larger amount of substituted NH, which served as a stabilizer for the growth of ZnO. This was indicated by the higher intensity of absorption band at 1640 − 1635 cm− 1. Based on being associated with the optimum pH, the growth of A. niger cells occurred at pH 8.0–10.0, due to being more productive in providing intracellular enzymes as reducing agents and stabilizers, within the ZnO biosynthesis process [28]. Furthermore, Fig. 1d showed the biosynthetic spectrum of ZnO in a strongly alkaline medium of pH = 13.0. Based on this condition, excess OH− ions and Zn+ 2 formed a very stable Zn(OH)2 precipitate, as the N-H ligand was difficult to substitute. Excess OH− ions were also moisturized on the ZnO surface, in order to form hydrated zinc oxide. When correlated with the XRD spectrum in Fig. 2, the biosynthesis at pH = 13.0 was indicated by the new intensity of hydrated Zn-O, at 2θ = 29.37° [23, 27, 29].
3.2 X-Ray Diffraction (XRD) Analysis of ZnO
The XRD pattern of ZnO was observed at the biosynthetic pH of 6.0–13.0, as shown in Fig. 2. Furthermore, the intensity at 2θ = 31.74°, 34.40°, 36.23°, 47.53°, 56.59°, 62.86°, 66.38°, 67.96°, and 69.10°, were the specific intensities of the ZnO wurtzite crystal structure, with hkl planes of 100, 002, 101, 102, 110, 200, 112, and 201 as hexagonal cell units, based on the ICSD-155780 standard [35]. The highest intensity was generally categorized as ZnO wurzite at similar 2θ, except in Fig. 2. Based on the ZnO biosynthesis at pH = 13.0, a new peak at 2θ = 29.37° was obtained, which indicated the intensity of hydrated Zn-O based on the standard of ICSD-15008. The study of Karuna et al. (2018), reported that the intensity at 2θ = 29.37° was hydrated ZnO, which was formed at a strong alkaline pH of 13.5 [35]. According to McBride et al. (2003) and Podlogar et al., the optimal condition of ZnO synthesis occurred at pH = 8.0–12.9. Based on this condition, the solubility of Zn ions was more saturated to form Zn(OH)2 precipitate, as ligand substitution (NH) formed coordination [Zn(OH)2(NH3)4] and a stable Zn(OH)42− core. Mean while, ZnO crystal growth was more directed [36, 37].
Based on the Debye Scherer equation, the data in Table 1 showed the size and phase of ZnO crystals, due to differences in biosynthetic pH (6.0–13.0). These influenced the ZnO dimensions, as higher pH levels produced greater amount of OH− ion concentration, and more stable Zn(OH)2 precipitate formation. Furthermore, the substitution of amine ligands in the precipitate was more difficult towards stabilizing the core formation and crystal growth of ZnO, as described in Fig. 1 [35]. The optical absorption rates in Table 1 were also used for the electronic transition analysis between bands, bandgap widths, and orbitals. Additionally, the contribution of defects to these transitions was highly dependent on particle size, which influenced the ability of ZnO to absorb UV light. The small value of the energy gap also enabled ZnO to easily absorb Ultraviolet light [38].
Table 1
ZnO crystal dimensions based on differences in biosynthetic pH
|
ZnO-NS
|
Ukuran Kristal
(nm)
|
Energi gap
(eV)
|
|
pH 6.0
|
38.2
|
3.01
|
|
pH 8.0
|
36.2
|
3.00
|
|
pH 10.0
|
45.4
|
3.03
|
|
pH 13.0
|
41.4
|
3.01
|
The XRD data were further refined through the Le Bail refinement technique, by using Rietica software to descriptively determine the crystal structure (Fig. 3 and Table 2). Based on Fig. 3, the XRD patterns were used to observe the crystal structure on Table 1, as the Le Bail refinement was carried out on the data. Furthermore, the structural parameters of ZnO phase with P63mc space group (a = b = 3.25254 Å, c = 5.2110 Å, α = β = 90°, γ = 120°) (ICSD-155780) was hexagonal, and also a fairly low fit for all pH parameters. The biosynthesis of all parameters at pH = 6.0–10.0 was further automatically refined to obtain the best fits and the unit cell. However, there was a new peak that did not match the model at pH = 13.0, which indicated the occurrence of a secondary phase that was different from hexagonal ZnO. The pH of 8.0 also had the smallest suitability parameter, compared to those at 6.0, 10.0 and 13.0. This indicated that the biosynthetic conditions at pH = 8.0 were optimal in obtaining the hexagonal structure of ZnO.
Table 2
Refined structural parameters of ZnO sample obtained from XRD
| |
ZnO pH 6
|
ZnO pH 8
|
ZnO pH 10
|
ZnO pH 13
|
|
Space Group
|
P63mc
|
P63mc
|
P63mc
|
P63mc
|
|
Z
|
2
|
2
|
2
|
2
|
|
a (Å)
|
3.2502
|
3.2481
|
3.2510
|
3.2519
|
|
c (Å)
|
5.2067
|
5.2037
|
5.2084
|
5.2076
|
|
V(Å3)
|
47.6365
|
47.5473
|
47.6755
|
47.6941
|
|
Rp
|
5.87
|
5.88
|
6.80
|
8.04
|
|
Rwp
|
7.72
|
7.36
|
9.47
|
13.7
|
|
χ2
|
1.60
|
1.55
|
2.55
|
5.20
|
3.4 Analysis of ZnO Morphology
Figure 4 indicates the ZnO morphology from Scanning Electron Microscopy (SEM) analysis, with 5a showing the biosynthesis at pH = 8.0, where a small crystal size was produced based on the measurement of XRD data. The dominant morphologies observed were rods, which had high uniformity degrees. Furthermore, Fig. 4b shows biosynthesis at pH = 10.0 and 13.0, where a rod-like morphology and mixed plate structure were produced, respectively. The spheric morphology with low uniformity is also presented in Fig. 4c, as FESEM-EDAX characterization was carried out with a high resolution at pH = 8.0, in order to obtain clearer information on the results produced. Figure 5 further indicates that there are rods and cubes with higher uniformity levels of ZnO nanorods distribution.
The differences in biosynthetic pH produced several ZnO morphology and uniformity distribution of particle size, which in turn influenced the amount of N-H substituted for the crystal nucleation stabilizer [33, 39]. Furthermore, the study of Alias et al. (2010), reported the agglomeration of alkaline media synthesis with pH greater than 12. This was due to the more difficult substitution of stabilizer in Zn(OH)2 precipitate [40, 41]. Based on EDAX analysis, ZnO contained the atomic composition of Zn = 61.5% and O = 38.5%.
3.5 ZnO application as textile coating
The aim of ZnO coating on textile fibres was to modify the function of anti-bacterials. This was due to using citric acid as a crosslinker, based on the formation of covalent ester interactions between the fibres and ZnO [42]. Furthermore, reported that covalent ester interactions were characterized by FT-IR, due to the absorption band intensity of the C = O group at wave number 1643–1456 cm− 1. The intensity of 3324–3414 cm− 1 was also the OH strain vibration obtained from the cellulose of the textile materials. Additionally, there was a difference between the intensity of the C = O group on textiles, without coating with ZnO materials [22, 23, 26, 33].
Figure 6 indicates the Scanning Electron Microscopy (SEM) analysis of a textile material, which is coated with ZnO. Based on the use of a crosslinked, the ZnO powder evenly spreads on all parts of the coated fibres. This coating stability was tested based on repeated washing, which occurred between 5–10 times [42]. According to the EDX analysis, the composition of ZnO-coated textiles is C = 60.72 %, O = 33.37 %, and Zn = 5.91 %.
3.6 Evaluation on antibacterial activity of the nanofinished textiles
The evaluation of ZnO anti-bacterial activity on textile fibres was carried out in vitro, on Staphylococcus aureus and P. aeruginosa, as the data of the inhibition zone measurement based on the differences in biosynthetic pH are shown in Figs. 7 and 8. Based on Fig. 8, the comparison of the ZnO inhibition zone at pH = 6.0–13.0, is observed against the two bacterial species. Furthermore, these Figures (Figs. 7 and 8) indicated that the inhibition ability of P. aurigenosa bacteria was more effective than S. Aureus, at pH = 8.0. The observation of growth area was also carried out with petri-dish photos, by using the Image pro Analyzer analysis system (cm2/day) for 3 days, at 24, 48, and 96 h. This was conducted in order to determine the bacteria behaviour against the presence of ZnO. The variation was because the two bacterial species had different cell wall thicknesses. Furthermore, the P. aurigenosa is a Gram negative bacteria with a cell wall layer of 30 A°, which was thinner than that of the S. aureus Gram positive at 250 A°. The cell wall layer of S. aureus also contained teichoic acid [21]. Differences in inhibition ability were further influenced by dimensions, morphology, and time [43]. Additionally, the ZnO activity test obtained an inhibition zone of > 20 mm, at different pH and observation time of 24–96 h. Therefore, ZnO is a very strong anti-bacterial agent for a number of pathogenic bacteria, due to the inhibitory abilities of the utilized species. This is superior to amoxicillin, which is found at an inhibition zone of 13.6 mm [22, 23].