Reagents
hBMSCs were purchased from Cyagen Biosciences (Guangzhou, China). hBMSC growth medium were purchased from Cyagen Biosciences. Cells cultured in a atmosphere of 5% CO2 at 37°C. Osteogenic induction medium was prepared according to previous methods(Hang et al., 2019).
Recombinant human TNF alpha were purchased from novoprotein (shanghai, china, #C008), Recombinant Human HSPB7 (R&D Systems), recombinant Human HSCA8 (Cayman) and recombinant Human HSPH1/HSPH1 (Novus) were purchased from Univ Biological.
Antibodies used for western blotting including Tublin (1:1000, Beyotime, shanghai, china), RUNX2 (1:1000, Beyotime), COL1A1 (1:1000, Beyotime), LAMP2a (1:1000, Beyotime), HSPH1 (1:1000, Beyotime), SP7/Osterix (1:1000, Abcam, shanghai, china), HSPB7 (1: 1000, Abcam), HSCA8 (1:1000, Abcam). Antibodies used for COIP included HSPB7 (5ug, rabbit, Abcam), HSPH1 (5ug, rabbit, Beyotime), HSCA8 (5ug, mouse, Abcam). Second antibodies including Alexa Fluor 488, Alexa Fluor 555 and Alexa Fluor 647 were purchased from Beyotime.
The siRNAs were purchased from Genepharma (Hangzhou, china).
hHSCA8 sense: GCAAAGAAUCAAGUUGCAATT
hHSCA8 antisense: UUGCAACUUGAUUCUUUGCTT
hLAMP2a sense: CCAUGGCACUGUGACAUAUTT
hLAMP2a antisense: AUAUGUCACAGUGCCAUGGTT
hHSPH1 sense: GCUCUACUUAGACUCAAUATT
hHSPH1 antisense: UAUUGAGUCUAAGUAGAGCTT
mRNA microarray
4 d TNF-α (100 ng/mL)-treated (Os4_T) and control (Os4_C) osteogenic BMSCs were prepared for mRNA microarray. Total RNA was isolated using RNA Isolation reagent (Takara), and then purified using RNeasy Mini Kit (Qiagen, Germany). A RIN number of total RNA was checked to examine RNA integration using Agilent Bioanalyzer 2100 (Agilent technologies, US). Then qualified RNA samples of each group were utilized to synthesis biotinylated cRNA targets for the Human RNA 8*60K Expression Microarray (Agilent technologies, USA). Then biotinylated cRNA targets hybridized with the Microarray slides, after that, slides were scanned by an Agilent Microarray Scanner G5761A (Agilent technologies, US). Data were extracted by Feature Extraction software (version10.7.1.1, Agilent technologies, US) and the raw data were normalized through Quantile algorithm. The Human RNA Expression Microarray experiments were performed according to the protocol of Agilent technologies at LC Sciences Corporation(Hangzhou, China. Genes with pvalue < 0.05 and fold change ≥ 1.2 were selected for further analysis. GO/KEGG pathway enrichment analysis were done use Fisher's exact test of the target genes. Microarray data was submitted to GEO, GEO accession number: GSE 176086.
Cell proliferation assay
Cells were cultured in 96-well plate at a density of 5000 cells per well, CCK-8 (Beyotime) of 10% was added into wells and incubated with cells for 2h at 37°C. Then the cell proliferation was measured by a microplate reader at the absorbance of 450 nm (BioTek, ELX808).
Protein interaction assay
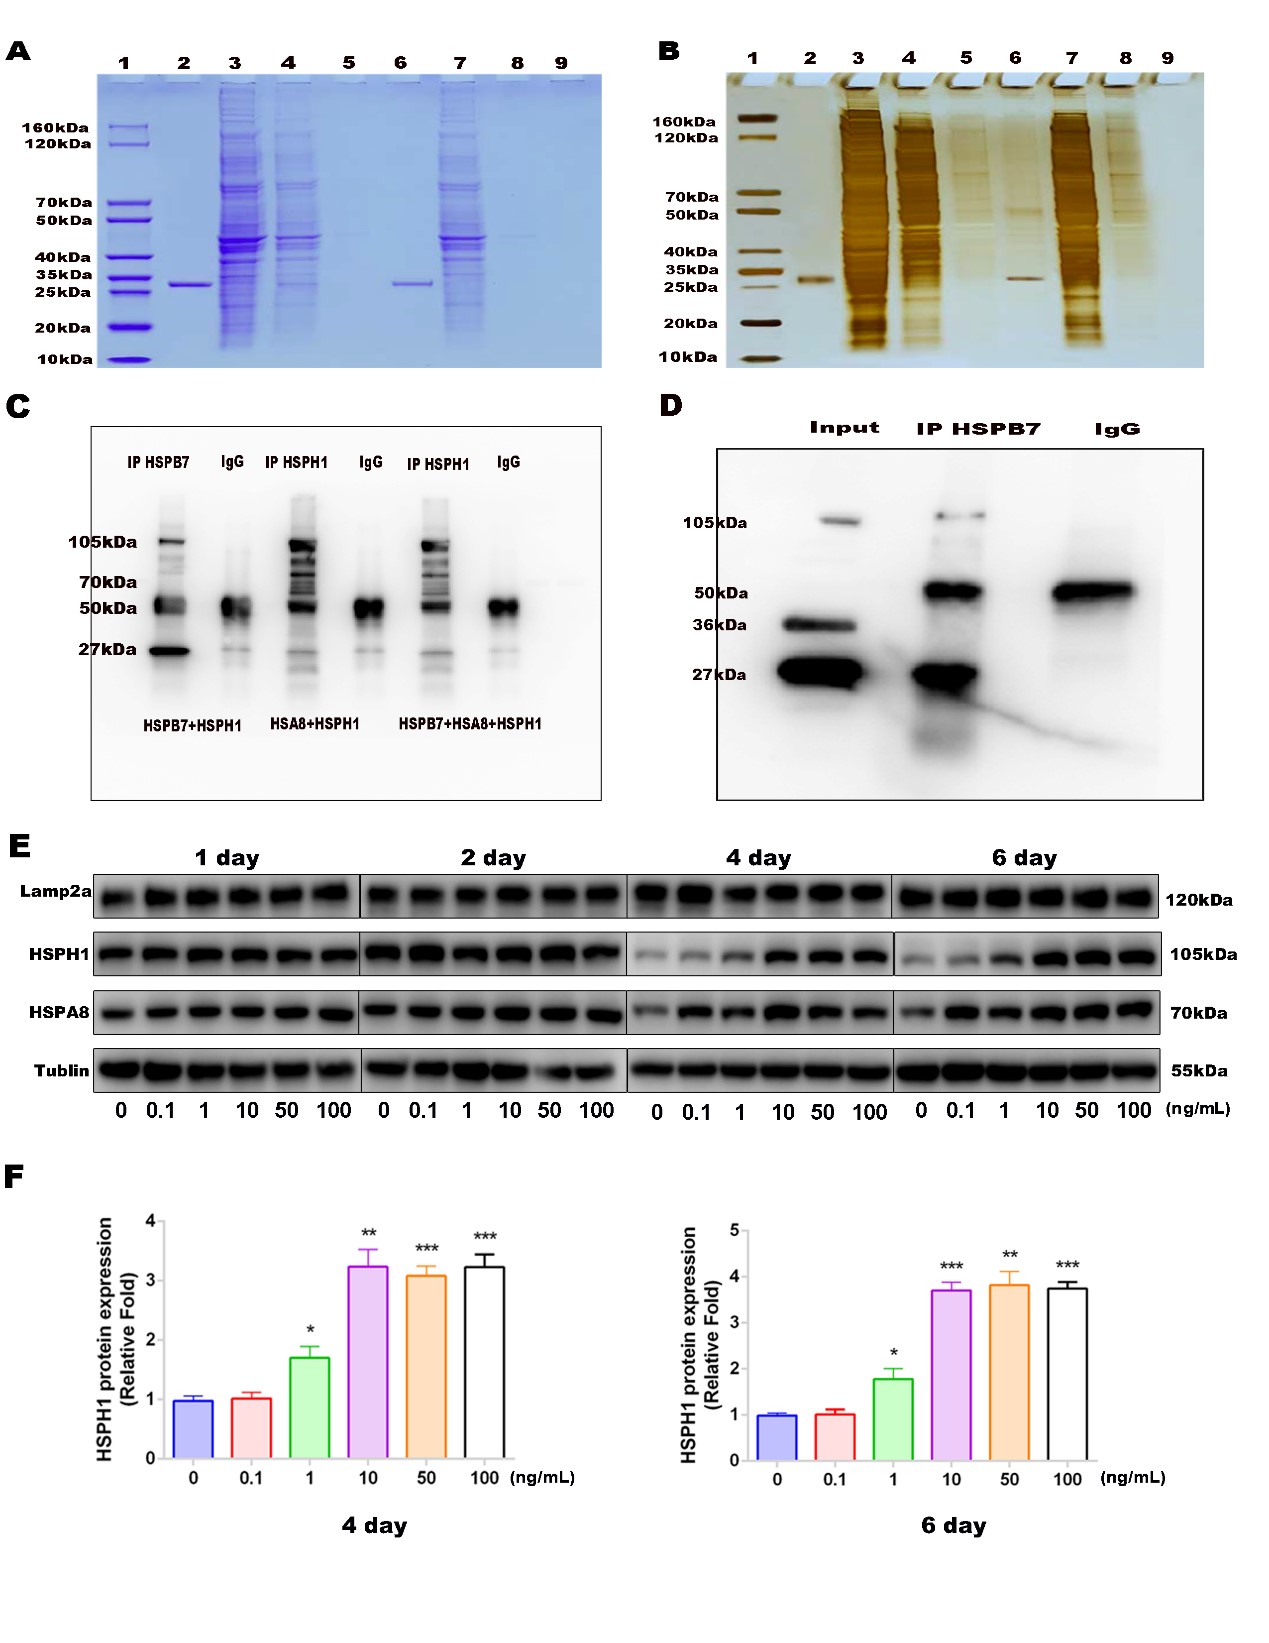
For in vitro immunoprecipitation, recombinant proteins were incubated within lysis buffer contained protease inhibitors and phosphatase inhibitors for 20 minutes at RT. Then adding anti-rabbit HSPB7 or anti-rabbit HSPH1 incubated for 90 min at RT, rabbit IgG (A7016, Beyotime) was used as a negative control. Then the mixture was incubated with protein G gammabind plus sepharose (17088601, GE life, SWEDEN) for 2h at RT. protein complex were centrifuged and washed with lysis buffer 3 times, suspended in 2X loading buffer and boiling for 5 min at 100°C. Finally, proteins were detected by western blotting.
For in vivo co- immunoprecipitation assay, cells were lysed in lysis buffer contained protease inhibitors and phosphatase inhibitors for 30 min, centrifuged and the supernatant were cleared with protein G for 10 min at 4°C. Then the cell lysates were incubated with primary antibodies and rabbit IgG which as a negative control overnight (16 h) at 4°C. Then the antibodies were captured by protein G gammabind plus sepharose (17088601, GE life, SWEDEN) overnight at 4°C. Protein complex were centrifuged and washed with lysis buffer 3 times, suspended in 2X loading buffer and boiling for 5 min at 100°C. Finally, proteins were detected by western blotting, coomassie blue staining and silver staining.
Protein mass spectrometry analysis
Proteins interacted with HSPB7 were freeze dried and enzymolysised by Trypsinbuffer for 16-18h at 37℃. Enzymolysis products were separated by high performance liquid chromatography (HPLC) according to the manufacturer’s instructions. Then the enzymolysis products were analyzed by QExactive mass spectrometer (ThermoFisher). Finally, the RawFile of mass spectrum were analyzed by MaxQuant 1.5.5.1 software.
RT-qPCR
Total RNA from cells or human bone tissues were extracted with RNA isolation reagent (Takara) and RNA was quantified by spectrophotometer at 260 nm wave length (NanoDrop 2000; ThermoFisher). Total RNA was then reverse-transcribed with the Double-Strand cDNA Synthesis reagent (Takara) and cDNA (2 ul) was used to quantification using SYBR Green PCR Master Mix reagent (Takara), and finally detected by a StepOnePlus System (Applied Biosystems). The reaction conditions were as previous described.
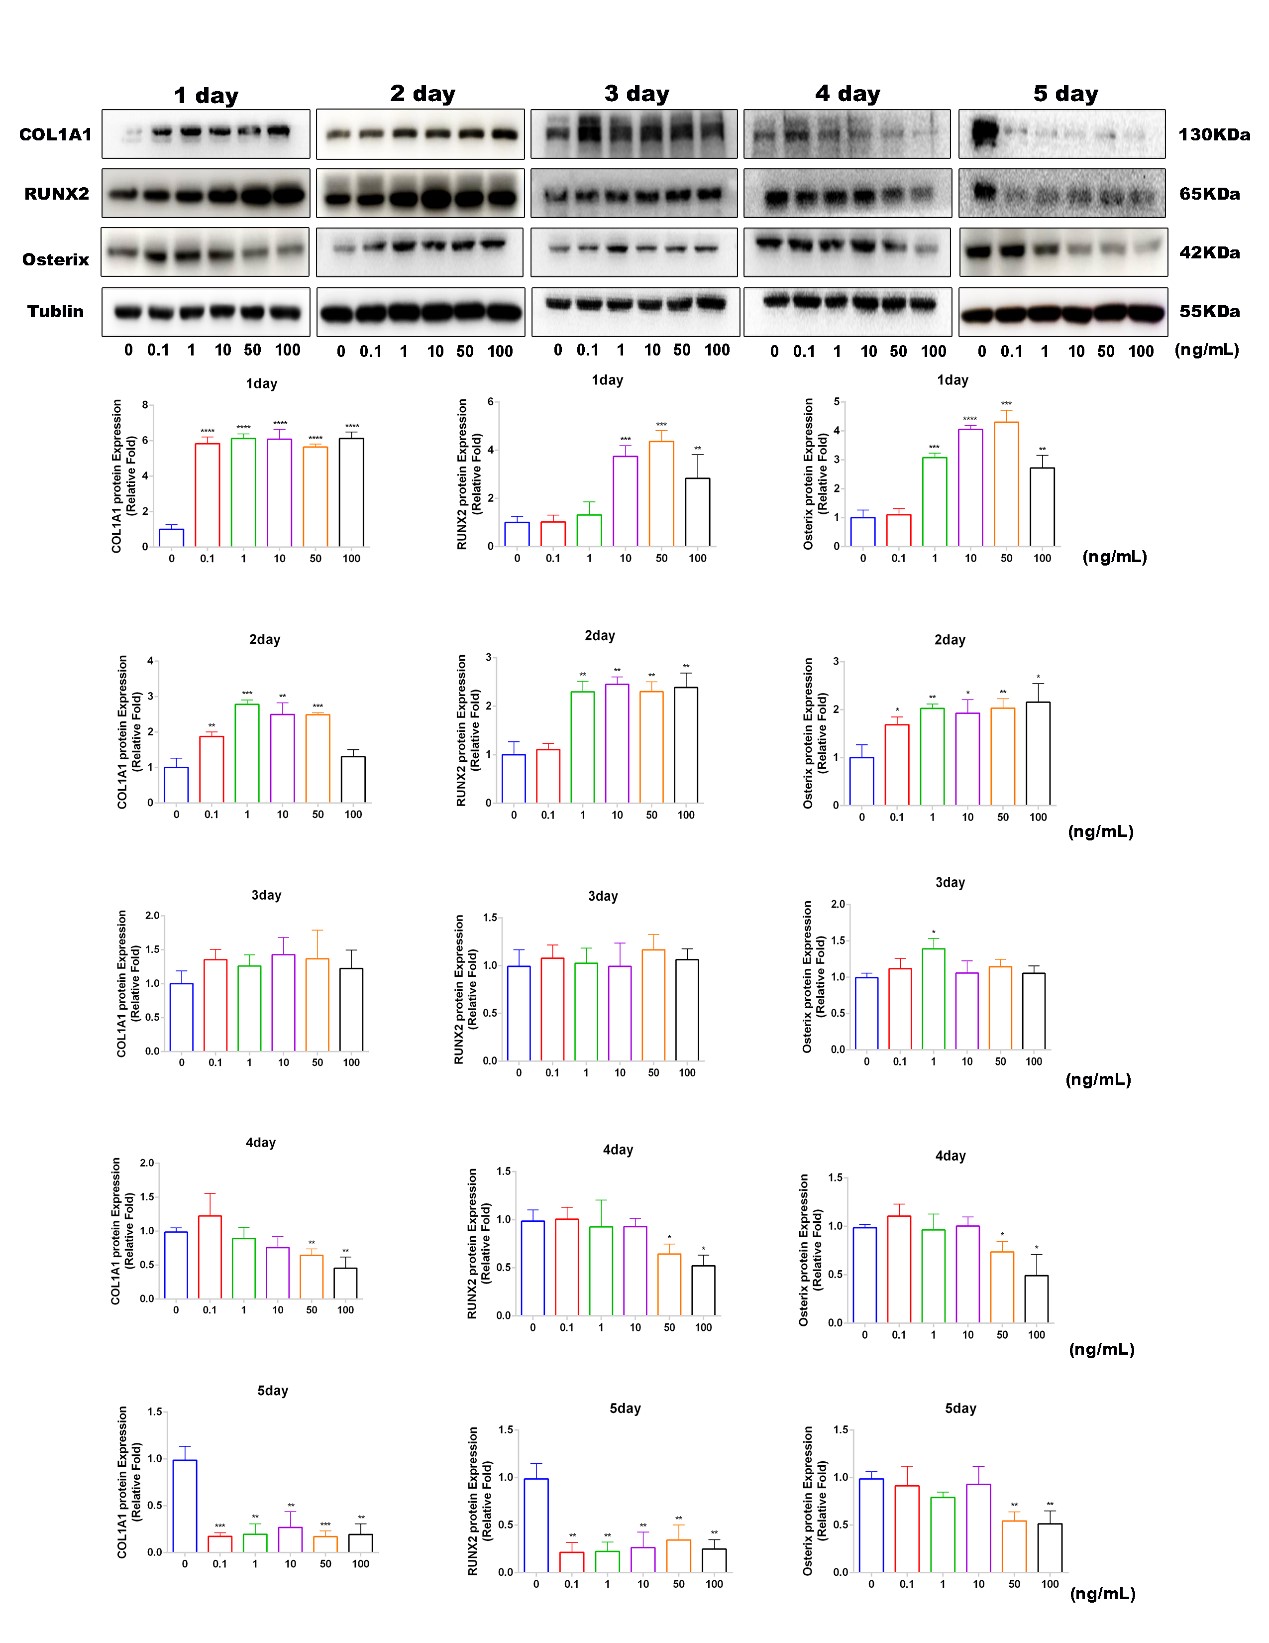
Western blot analysis
Proteins was extracted from cells by lysing in RIPA buffer supplemented with protease inhibitors and phosphatase inhibitors (Beyotime). After protein quantification, cell lysates were suspended in 5X loading buffer and then equal amounts of proteins were subjected to migration on 10%-12% polyacrylamide gels, then transferred to a polyvinylidene fluoride membrane (Millipore, Shanghai, China). The membranes were blocked by non-fat milk (5%) for 60 min and then incubated with primary antibodies for 12h-16h at 4°C. After, membranes were washed with Tris-buffered saline-Tween (TBST) 3 times (10 min each) and incubated with HRP-conjugated secondary antibodies (Beyotime) for 1 h at RT. Finally, proteins were revealed by chemiluminescence reagents (Millipore) and the signal intensity was detected using Bio-Rad XRS system (Bio-Rad).
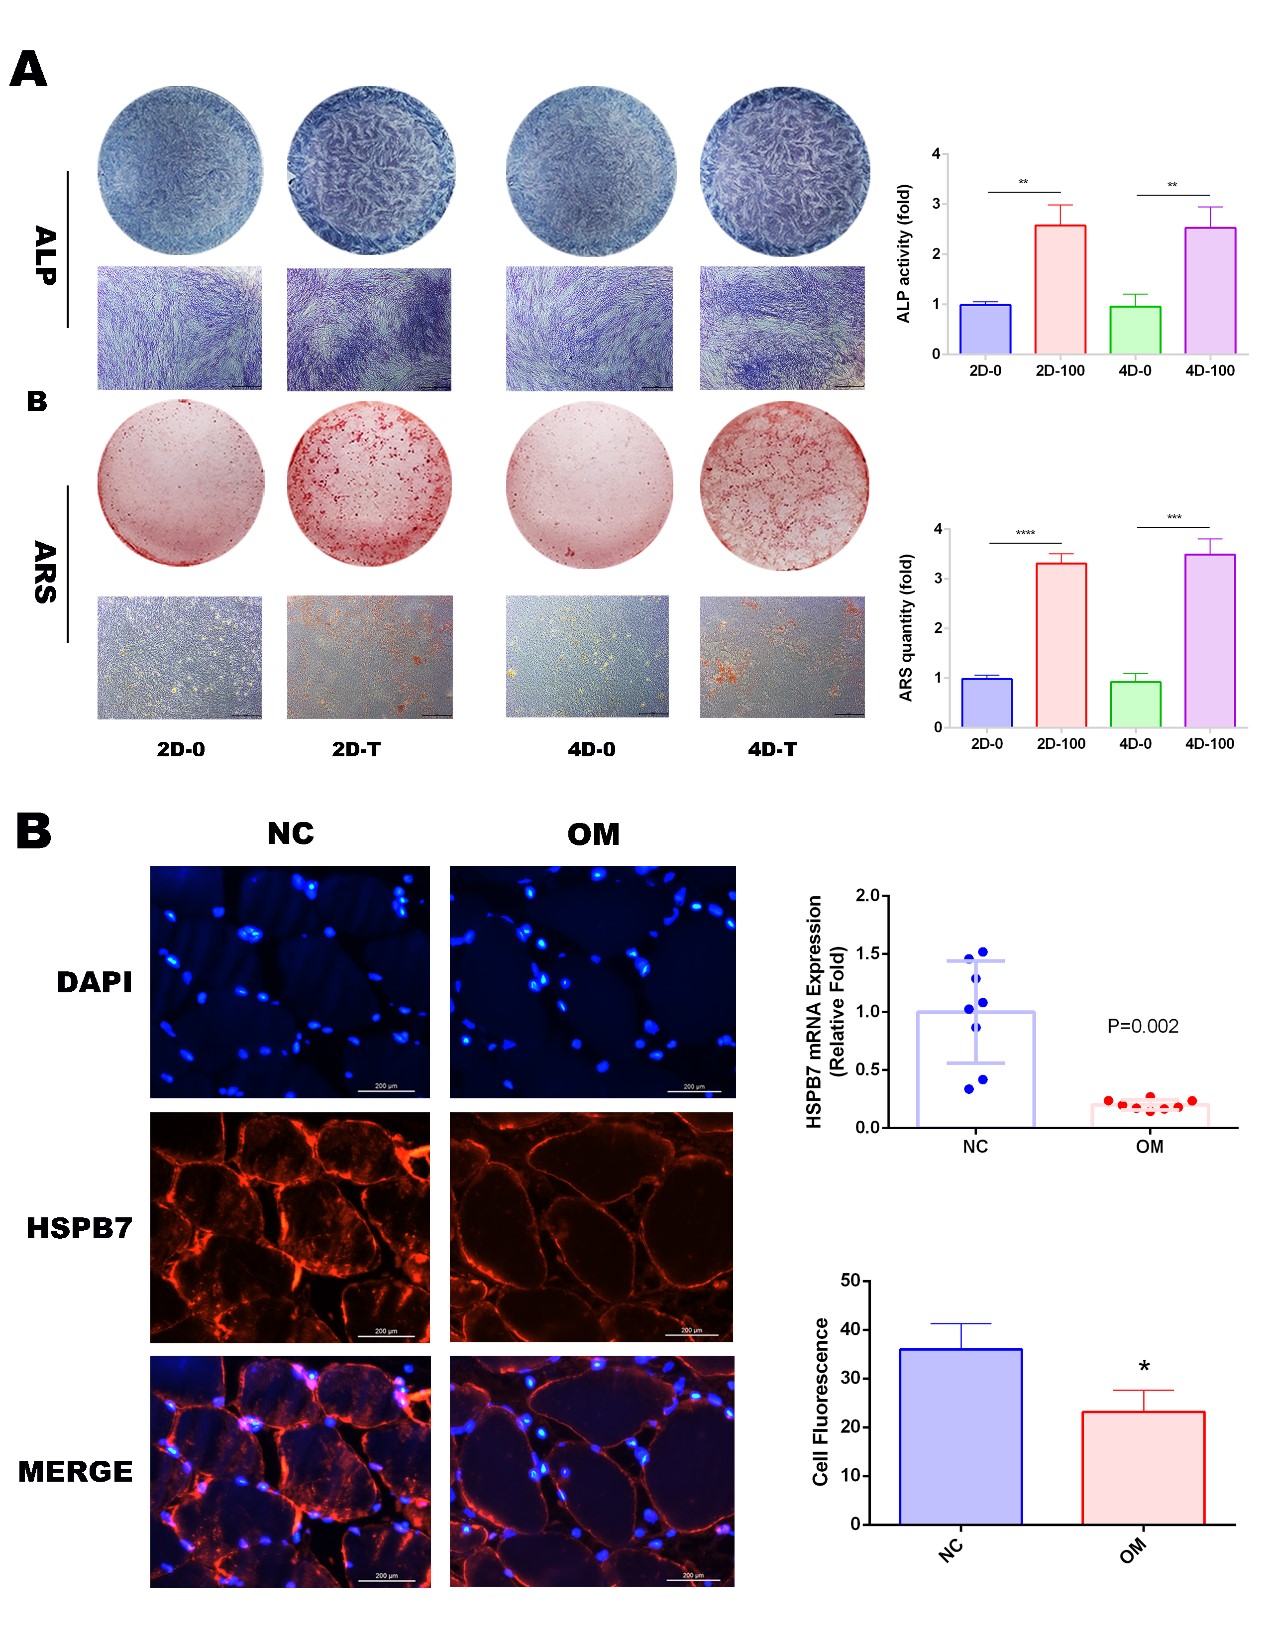
ALP staining
Cells were passaged to 12-well plates and cultured with osteogenic induction medium when cells reached at 70% confluence. Osteogenic induction medium cultured for 5 days, cells were washed by PBS 3 times, and were fixed in 4% paraformaldehyde for 20min-30min at RT. Washed by PBS 3 times, cells were stained by the ALP Color Development Kit (Beyotime). Finally, the ALP activity quantification was performed as previous described.
Alizarin Red staining
Cells were passaged to 12-well plates and cultured with osteogenic induction medium when cells reached at 70% confluence. Osteogenic induction medium cultured for 15 days, cells were washed by PBS 3 times and were fixed in 4% paraformaldehyde for 20min-30min at RT. Washed by PBS for 3 times, calcium deposition was stained by Alizarin Red staining (Cyagen) for 5min-10 min at RT, and then was rinsed by PBS 3 times. The ARS quantification was performed as previous described.
siRNA transfection
Cells were seeded in plates and transfected with siRNA when cells reached 30–50% confluence. Transfection process was according to the manufacturer’s instructions. Transfection efficiency was verified by qPCR.
Adenovirus transfection
Adenovirus expressing the GFP-LC3B (Ad-GFP-LC3B) and GFP-P62 (Ad-GFP-P62) were purchased from Beyotime. Briefly, cells were cultured in 12-well plates and transfected with adenovirus when cells reached at 70% confluence according to the manufacturer’s instructions. Finally, signals were visualized by a fluorescence microscope (Leica) and quantified by Image J software.
Lentiviral overexpression HSPB7
Human and murine Lentiviral overexpression GFP-HSPB7 (GFP-B7OE) particles and the GFP control group (GFP-NC) were purchased from Cyagen Biosciences. A multiplicity of infection (MOI) which was used as the optimal amount of virus dose was confirmed by IF assay. 50–60% confluent cells were incubated with lentiviral particles at a MOI of 40 and 4 µg/ml polybrene. 12 h later, the culture medium was changed and the transfected cells were used in next experiments.
Immunofluorescence assay for CMA-active lysosomes
CMA-active lysosomes were identified by the colocalization of LAMP-2A and HSCA8, procedures were performed according to the standard immunofluorescence protocol described by Cuervo et.(Kaushik and Cuervo, 2009). And signals were detected by a confocal microscopy (Leica TCS SP8, USA) and quantified by Image J software.
Animals
All C57/B16 mice (male, 12 weeks) were purchased from SLAC Laboratory Animal Co (Shanghai, China). All of the animal experiments were approved by the Institutional Animal Care and Use Committee of the 2nd Affiliated Hospital, Zhejiang University (No: 2020 − 1035). All mice were randomly divided into control and experimental groups.
Sample sizes used at 6–8 animals per experimental procedure
Mice-fracture model
Mice-fracture model was modified on the basis of previous method(Harry et al., 2008). Briefly, mice anesthetized by intraperitoneally injection of 0.3% pentobarbital sodium (30 mg/kg body). Exposed the right lower limb, made an incision lateral between the middle of tibia tuberosity and crest. A 0.38-mm diameter intramedullary fixation pin was then inserted into the tibia’s medullary canal at the level of the tibia tuberosity for fixation. Separated the soft tissue carefully and stripped the periosteum above the crest of tibia. Then an osteotomy was created above the crest of tibia. The same leg was used in each group.
For in vivo study of HSPB7 protecitve effects, animals were divided into three groups. 20ul volume of TNF-α (100ng/ml) or PBS was injected at the fracture site locally on days 0, 2, 4 and 6. GFP-B7OE or GFP-NC lentiviral particles were injected at day 6. 2 and 4 weeks after surgery, limbs were harvested by lethal intraperitoneal injection of 0.1ml sodium pentobarbitone (200mg/ml) for next experiments.
Histology
Following harvest, 2 weeks of samples were fixed by 10% paraformaldehyde for 36h at 4°C and then were decalcified by 0.5M ethylene diaminetetra acetic acid (EDTA, Beyotime) for 3 days at 4°C. Specimens were then embedded in paraffin and sectioned at a 5um thickness. Serial sections were deparaffinized and then stained with Safranin O and Fast Green, Masson’s Trichrome according to the standard procedures.
Radiographic analysis
Following harvest, 4 weeks of samples were send to make a microcomputed tomography (µCT) evaluation. Each tibia was scanned using µCT-100 imaging system (Scanco Medical, Switzerland), operation parameters were according to the previous report(Glass et al., 2011).
Histology immunofluorescence analysis
For mouse sample, following harvest, 2 weeks of samples were fixed by 10% paraformaldehyde for 4h at 4°C and then were decalcified by 0.5M EDTA (Beyotime) for 3 days at 4°C. Freshly dissected bone tissues and immunofluorescent stainings were according to previous methods described by Adams et(Kusumbe et al., 2014). The following primary antibodies were used: Sp7/Osterix (ab209484, abcam, diluted 1:100), Runx2 (ab192256, abcam, diluted 1:100), Endomucin (ab106100, abcam, diluted 1:100), CD31/PECAM (AF3628-SP, RD System, diluted 1:50).
Then sections were blocked with 2% BSA for 20 min at RT. Washed by PBS 3 times and incubated with primary antibody for 1h at RT. Washed by PBS 3 times and incubated with second antibodies in a wet box for 1h at RT. Then sections were washed by PBS 3 times and stained with DAPI. Target protein was observed under a fluorescence microscope (Leica) and quantified by Image J software.
Statistical analysis
All experiments were performed at least in triplicate, data are presented as means ± SD, statistical significance between two groups was determined by Student’s t test, one-way ANOVA or Bonferroni’s post-hoc test according to the distribution of the tested population. Statistical analysis was performed with SPSS 19.0 software (IBM, USA). A value of P ≤ 0.05 was considered significant.