This work aimed to study the feasibility to use vinasse for polyhydroxybutyrate (PHB) production by Bacillus megaterium. To optimize the culture medium, a Box Behnken design was employed considering carbon (C), nitrogen (N), and phosphorus (Ph) concentrations as independent variables and PHB productivity as the response variable. The productivity decreased when C or N were increased, probably due to the presence of phenolic compounds and the limitation of N for the production of PHB by Bacillus sp. bacteria. An additional experimental design to optimize the C/N ratio and growing conditions (fermentation time and temperature) was carried out. Fermentation time had a statistically significant effect on PHB productivity reaching 10.6 mg/L h. On the other hand, the variability in physicochemical properties of vinasse samples led to significant differences in PHB productivity. Lower productivity values were obtained when vinasse had DBO high values. Therefore, biopolymers production from vinasse is a feasible alternative to valorize this bioethanol by-product.
Research Article
Vinasse: From A Residue To A High Added Value Biopolymer
https://doi.org/10.21203/rs.3.rs-801030/v1
This work is licensed under a CC BY 4.0 License
Journal Publication
published 01 Dec, 2021
Read the published version in Bioresources and Bioprocessing →
You are reading this latest preprint version
vinasse
polyhydroxybutyrate (PHB)
Bacillus megaterium
media optimization
fermentation
culture medium optimization
Plastics obtained from non-renewable sources are one of the most used materials in the world, they are broadly integrated into today's lifestyle and contribute to almost all product areas. However, when plastics are discarded into the environment, they can persist for very long periods of time (Andrady 2015). For this reason, in the last years, alternatives have been explored to replace petroleum derived plastics by materials obtained from natural sources. Hence, several materials have been investigated such as biobased poly(ethylene terephthalate) (bio-PET), biobased poly(ethylene) (bio-PE), bio-poly(carbonate) (bio-PC), bio-poly(amide) (bio-PA), poly(hydroxyalcanoate)s (PHAs), and poly(lactic acid) (PLA), among others. PHAs are polyesters of hydroxyacids naturally synthesized by bacteria as carbon reserve. These biopolymers are accumulated as cytoplasmic inclusions in certain bacteria during unbalanced growth conditions, usually characterized by an excess supply of the carbon source and the lack of at least one of the essential nutrients (Kovalcik et al. 2019). Poly(3-hydroxybutyrate) (PHB) is the most common and the best known PHA and it is a great alternative to develop biomaterials since this biopolymer has similar properties to conventional polymers such as PE and poly(propylene) (PP) (Vandi et al. 2018). Also, PHB decomposes to water and carbon dioxide under aerobic conditions and to methane and carbon dioxide under anaerobic conditions by microorganisms in soil, sea, lake water, and sewage (Anjum et al. 2016). Its applications include packaging materials, bags, containers, sutures, cardiovascular stents, targeted tissue repair/regeneration devices, polymer-based depots for controlled drug release or implants, and disposable items like single-use cups and diapers (Koller 2018).
Despite these advantages, the high production cost of PHB is the main obstacle for its commercialization. PHB cost is at least three times higher than conventional plastics such as PP and PE, attributed mainly to the expensive substrates and processing (Kourmentza et al. 2017), and similar to bio-based polymers such as PLA (Kaur et al. 2017). Thus, using cheaper feedstocks is one of the keys to reduce PHB production costs. Food wastes (Nielsen et al. 2017), residues from beer breweries (Amini et al. 2020), cheese whey (Pais et al. 2016), olive mill wastewater (Alsafadi and Al-Mashaqbeh 2017), and hydrolyzed corn starch (Fabra et al. 2016) are some resources that have been investigated for sustainable PHB production. On the other hand, vinasse, a residue of the sugar cane alcohol industry, could be used as an economic substrate to produce PHB at lower costs. In this sense, some authors have reported the use of vinasse as carbon source for PHB production. Zanfonato et al. (2018) did fermentations with Cupriavidus necator and Pramanik et al. (2012) with Haloarcula marismortui using vinasse as carbon source to produce PHB. In other cases, a combination of vinasse and sugarcane molasses was used by Cupriavidus necator as microorganism (Dalsasso et al. 2019,Acosta-Cárdenas et al. 2018). Nowadays, vinasse disposal represents an environmental problem since it affects water and edaphic resources, as well as the life of animal and plant species. The high solids concentration and hard constituents, such as phenols and polyphenols, contaminate the surface and underground water. Also, vinasse presence increases eutrophication due to its high content of nitrogen and phosphorus (Parsaee et al. 2019). Colored compounds of vinasse reduce the permeability of sunlight in rivers and lakes, thereby reducing the photosynthetic activity and the concentration of dissolved oxygen in water generating disturbances of plants and aquatic animals life (Syaichurrozi 2016). Vinasse is also toxic because of its low pH, it has an unpleasant smell for humans and its influence on drinking water leads to an outbreak of malaria, amebiasis, and schistosomiasis. It is a medium for worm eggs of Meloidogyne javanica, M. incognita, and Drosophila melanogaster to grow. The pollution of each liter of vinasse is equal to the amount of contamination produced by 1.43 humans (Parsaee et al. 2019).
Optimization of the fermentation process is another way to reduce the costs of PHB. The optimization by statistical methods, compared to the common “one factor at a time” method, proved to be a powerful and useful tool to predict the maximum yield for bioproducts synthesis. Statistical methods such as response surface methodology enable to design the experiments and to evaluate the interactions among factors and responses throughout the study (Nor et al. 2017).
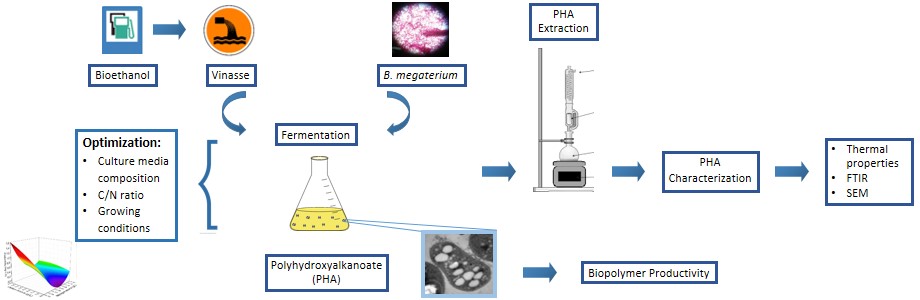
In the present work, PHAs were obtained by Bacillus megaterium employing vinasse as carbon source. A statistical experimental design was applied to optimize the medium composition and fermentation conditions at laboratory scale. Synthetized biopolymers were extracted from the cells and characterized to evaluate their composition and thermal properties.
2.1. Bacterial Strain
Fermentations for PHAs production were carried out with Bacillus megaterium (GenBank database accession number: HM119600.1), named as BBST4. This strain, isolated from sediments of the Bahía Blanca Estuary, was identified and characterized by López et al. (2011). Bacillus megaterium was adapted to metabolize vinasse by several fermentations increasing gradually the vinasse concentration. Adapted bacteria were conserved at -70°C in vials containing 1 mL growth medium and 20 % glycerol. The growth medium was composed of 10 g/L vinasse, 10 g/L yeast extract, and 5 g/L peptone. Bacteria cells were reactivated at 30°C for 24 h in the described growth medium. They were stored at 4°C in slopes containing the growth medium and 20 g/L agar. Fermentation inoculums were prepared by transferring bacteria cells using a wire loop into a shake flask containing 50 mL of the growth medium that were cultivated at 30°C for 24 h.
2.2. Carbon source
Vinasse, provided by a sugar-alcohol company located at Famaillá (Tucumán, Argentina), was used as carbon source. In Fig. 1 it is shown the flowchart of the bioethanol process from sugar cane. As it can be observed, vinasse is one of the byproducts resulting from this process. In this work, two vinasse samples called V2017 and V2018 were used.
Vinasse samples were physicochemically characterized by Chemical Oxygen Demand (COD), Biological Oxygen Demand (BOD), Total Organic Carbon (TOC), Total Nitrogen (TN) and pH. Many of these studies were carried out at the Environmental Chemistry Laboratory, Universidad Nacional del Sur (Bahía Blanca, Argentina) by different standard methods: TOC was determined using a TOC analyzer (Exeter analitycal CE440); TN by the Kjeldahl method (Bradstreet 1954); TSS by the Standard Method 2540 D (Total Suspended Solids Dried at 103–105°C); TFS and TVS by the Standard Method 2540 E (Fixed and Volatile Solids Ignited at 550°C), using the protocols described by Standard Methods for the examination of Water and Wastewater 20th Edition (Eaton et al. 1998); COD by the Standard Method Potassium Dichromate (Burke 1977) ;and BOD using the Winkler method (Prambudy 2019). The pH was measured using an Sensorex pHmeter.
2.3. Culture Media
The composition of the culture media was: 2.5 g/L MgSO4.7H2O, 2.5 g/L NaCl, 0.5 g/L FeSO4.7H2O,0,05 g/L MnSO4.4H2O, vinasse, NH4NO3, and K2HPO4. Concentration of carbon, nitrogen, and phosphorous was achieved varying the quantities of vinasse, NH4NO3, and K2HPO4 added to the culture medium. The pH of the media was adjusted to 7.0 by adding dilute sodium hydroxide solution.
2.4. Optimization of culture media composition and fermentation conditions
For the optimization of culture media composition and fermentation conditions, it was employed the Box–Behnken experimental design and response surface methodology.
To optimize the composition of the culture media, three independent variables were chosen: carbon (C), nitrogen (N), and phosphorus (Ph) concentrations, which were prescribed into 3 levels code: -1, 0, 1 (Table 1) and the design matrix for 15 experiments is presented in Table 2. The response variable was PHB productivity (expressed in mg/L h). In the experimental assays, cultures were incubated in 250 mL Erlenmeyers, containing 100 mL of each culture medium given by the experimental design, at 30°C for 24 h and 150 rpm in an orbital shaker.
|
Culture media composition |
|||
|---|---|---|---|
|
Level |
C (g/L) |
N (g/L) |
Ph (g/L) |
|
High (+ 1) |
8 |
0.4 |
1.2 |
|
Central (0) |
6 |
0.25 |
1.05 |
|
Low (-1) |
4 |
0.1 |
0.9 |
|
Fermentations conditions |
|||
|
Level |
C/N |
T (°C) |
t (h) |
|
High (+ 1) |
40 |
37 |
72 |
|
Central (0) |
30 |
33.5 |
48 |
|
Low (-1) |
20 |
30 |
24 |
| C: carbon; N: nitrogen; Ph: phosphorous. C/N: carbon/nitrogen ratio; T: fermentation temperature; t: fermentation time | |||
|
Run |
C (g/L) |
N (g/L) |
Ph (g/L) |
P (mg /L h) |
|---|---|---|---|---|
|
1 |
-1 |
-1 |
0 |
1.75 |
|
2 |
1 |
-1 |
0 |
0.54 |
|
3 |
-1 |
1 |
0 |
0.59 |
|
4 |
1 |
1 |
0 |
0.24 |
|
5 |
-1 |
0 |
-1 |
0.25 |
|
6 |
1 |
0 |
-1 |
0.46 |
|
7 |
-1 |
0 |
1 |
1.29 |
|
8 |
1 |
0 |
1 |
0.26 |
|
9 |
0 |
-1 |
-1 |
1.55 |
|
10 |
0 |
1 |
-1 |
1.38 |
|
11 |
0 |
-1 |
1 |
1.52 |
|
12 |
0 |
1 |
1 |
0.43 |
|
13 |
0 |
0 |
0 |
0.27 |
|
14 |
0 |
0 |
0 |
0.27 |
|
15 |
0 |
0 |
0 |
0.32 |
| C: carbon; N: nitrogen; Ph: phosphorous; P: PHB productivity | ||||
To complement the optimization of PHA production by B. megaterium and vinasse as carbon source, a second experimental design was carried out. As independent variables were chosen carbon/nitrogen ratio (C/N), temperature (T), and time (t) and they were prescribed into 3 levels code: -1, 0, 1 (Table 1). The design matrix for 15 experiments is presented in Table 3. As in the case of optimization of culture media, the response variable was PHB productivity. Cultures were incubated in 250 mL Erlenmeyers, containing 100 mL of culture medium with different C/N ratios at different temperatures and times, following the experimental design.
|
Run |
C/N |
T (°C) |
t (h) |
P (mg /L h) |
|---|---|---|---|---|
|
1 |
-1 |
-1 |
0 |
5.1 |
|
2 |
1 |
-1 |
0 |
5.5 |
|
3 |
-1 |
1 |
0 |
4.4 |
|
4 |
1 |
1 |
0 |
4.0 |
|
5 |
-1 |
0 |
-1 |
9.7 |
|
6 |
1 |
0 |
-1 |
4.0 |
|
7 |
-1 |
0 |
1 |
3.0 |
|
8 |
1 |
0 |
1 |
4.5 |
|
9 |
0 |
-1 |
-1 |
10.3 |
|
10 |
0 |
1 |
-1 |
9.5 |
|
11 |
0 |
-1 |
1 |
3.2 |
|
12 |
0 |
1 |
1 |
4.8 |
|
13 |
0 |
0 |
0 |
6.9 |
|
14 |
0 |
0 |
0 |
6.3 |
|
15 |
0 |
0 |
0 |
6.5 |
| C/N: carbon/nitrogen ratio; T: fermentation temperature; t: fermentation time; P: PHB productivity | ||||
After all fermentation assays, culture medium was centrifuged for 10 min at 4000 rpm. The cell pellet was washed with distilled water 3 times and dried to constant weight at 60°C in an oven with forced air circulation.
2.5. Quantification of accumulated PHA
Gas chromatography (GC) was used to quantify accumulated PHA. This technique specifically determines PHB. Samples for GC analysis were prepared as described by Riis & Mai (1988). 2 mL of 1,2 dichloroethane, 2 mL propanol containing hydrochloric acid (1 volume concentrated hydrochloric acid + 4 volume propanol) and 200 µL of internal standard solution (2 g benzoic acid in 50 mL propanol) were added to 40 mg of dry bacterial mass. Then, the sample was kept for 2 h in an incubator at 100°C. After cooling to room temperature, 4 mL of water were added, and the mixture was shaken for 20–30 s. The heavier phase was injected into a gas chromatograph Hewlett Packard 5890 (Series II).
To quantify PHB, a calibration curve was previously performed by using a commercial PHB (Biomer, Germany). Productivity (P) of PHB was calculated using Eq. 1.

where PHB is the quantity of the biopolymer in miligrams, t is the fermentation time in hours, and V is the culture media volume in liters.
2.6. PHA extraction
Centrifuged cells were lyophilized in a Rificor, L-A-B3-C lyophilizer and PHA was extracted with chloroform in a Soxhlet apparatus during 48 h. After extraction, solvent was removed by evaporation and PHA yield was calculated by Eq. 2.
 [2]
[2]
where PHAextracted corresponds to the PHA obtained after solvent-extraction and dry cell weight is the amount of lyophilized cell used, both expressed in g/L.
2.7. Characterization of extracted PHA
Fourier transform infrared (FTIR)
FT-IR analysis was performed using a spectrophotometer Nicolet Nexus. Samples were well-mixed with KBr (Sigma–Aldrich, 99 % purity) at 1 % w/w and press in order to obtain transparent discs. Spectra were obtained from 100 accumulated scans at 4 cm− 1 resolution in the range 4000–400 cm− 1.
Scanning Electron Microscopy (SEM)
Scanning Electron Microscopy (SEM) was conducted on a JEOL JSM-35CF electron microscope at an accelerating voltage of 10 kV. Samples were dispersed over 3M aluminum conductive tape stuck onto stubs by using an air flow and coated with gold in a sputter coater SPI.
Differential Scanning Calorimetry (DSC)
Thermal properties were evaluated by Differential Scanning Calorimetry (DSC) using a Perkin-Elmer DSC calorimeter under nitrogen atmosphere. Analysis was carried out on ~ 8 mg of sample heating from 25°C to 190°C, followed by a subsequent cooling down to 25°C, and finally a second heating to 190°C. All thermal ramps were performed at a rate of 10°C/min. Melting point (Tm) and melting enthalpy (∆Hm) were obtained from thermograms at the second heating stage.
Thermogravimetric analysis (TGA)
Thermal degradation was performed using a thermogravimetric balance Discovery TA Instruments. Samples (~ 8 mg) were heated from 25°C to 700°C, under nitrogen atmosphere, at 10°C/min. Mass-temperature curves were obtained and first derivative was calculated. The peak of the first derivative indicates the maximum thermal degradation temperature (Td), point of maximum rate of change on the mass curve.
3.1. Carbon source
Vinasse samples were physicochemically characterized and results are shown in Table 4. As it can be observed, physicochemical parameters of both samples (V2017 and V2018) were significantly different between them. This variability depends on the sugar cane variety and maturation, the substrate used in fermentation, distillation, and sulfitation process that enriches the downstream products with sulfur compounds especially sulfate species (de Godoi et al. 2019). This wide range of physicochemical properties represents a challenge to use vinasse as carbon source on PHA production. Even though, both studied vinasse samples contained raised BOD and COD levels and high suspended solids, V2017 presented significantly higher values than V2018. These parameters are responsible for the difficult disposal and are according to the average values found in the literature (Acosta-Cárdenas et al. 2018,Carrilho et al. 2016,Nakashima and de Oliveira Junior 2020). TN content of V2017 was 4.3 times higher than the corresponding to V2018. In the bibliography it was found TN values goes from 60 mg/L (Zanfonato et al. 2018) to 587 mg/L (Popolizio 2017), demonstrating once again the variability of this byproduct and the challenge when using it as carbon source to produce biopolymers via microbial fermentation. Regarding TOC content, the value corresponding to V2018 was about half of the content obtained for V2017 sample. Parsaee et al. (2019) reported a TOC value of 20.16 g /L, similar to the value obtained for V2018. On the other hand, Fagier et al.(2018) obtained a TOC value of 48 g/L, similar to the value obtained for V2017. pH values of vinasse samples are in the range reported on the bibliography (Fukushima 2019). These low values hinder the disposal of this by-product.
|
Physicochemical property |
Vinasse sample |
|
|---|---|---|
|
V2017 |
V2018 |
|
|
BOD (mg/L) |
96,500 ± 500 |
36,170 ± 1,808 |
|
COD (mg/L) |
101,600 ± 500 |
40,880 ± 822 |
|
TN (mg/L) |
1,100 ± 20 |
255 ± 10 |
|
TOC (g/L) |
40.5 ± 0.5 |
16.3 ± 0.5 |
|
pH |
4.8 |
4.6 |
| BOD: Biological Oxygen Demand; COD: Chemical Oxygen Demand; TN: Total Nitrogen; and TOC: Total Organic Carbon. | ||
3.2. Optimization of culture media composition and fermentation conditions
In this study, it was employed Bacillus megaterium to synthetize biopolymers via microbial fermentation. According to López et al. (2012) and Porras et al.(2017), this strain is capable of producing PHB and PHA copolymers, respectively. To optimize culture media composition, it was carried out 15 experiments given by the Box–Behnken experimental design and obtained PHB productivity (P) values are included in Table 2. The vinasse sample employed in these assays as carbon source was V2017. The influence of the different tested independent variables (carbon, nitrogen, and phosphorus concentration) on the biopolymer productivity are given by the p-value: those that presented p < 0.05 significantly affected the response parameter, meanwhile variables that showed p > 0.05 were considered not statistically significant.
The p-values for the three independent variables and their interactions are given in Table 5. It is important to note that not all variables affected the productivity in the same way. It can be seen that C and N statistically influenced PHB productivity, considering a significance level α = 0.05 (p = 0.0441 and 0.0280, respectively). On the other hand, phosphorus concentration was not statistically significant (p = 0.8941). Interactions between studied variables were not remarkable on PHB productivity, except the quadratic term N2 (p = 0.0167).
|
Variable |
Coefficient |
p-value |
|---|---|---|
|
C |
-0.2956 |
0.044 |
|
N |
-0.3384 |
0.028 |
|
Ph |
-0.0155 |
0.894 |
|
C2 |
-0.0783 |
0.651 |
|
C-N |
0.2130 |
0.231 |
|
C-Ph |
-0.3106 |
0.104 |
|
N2 |
0.5745 |
0.017 |
|
N-Ph |
-0.2287 |
0.203 |
|
Ph2 |
0.3570 |
0.080 |
| C: carbon; N: nitrogen; Ph: phosphorous | ||
|
Variable |
Coefficient |
p-value |
|---|---|---|
|
C/N |
-0.5340 |
0.278 |
|
T |
-0.1878 |
0.702 |
|
t |
-2.2338 |
0.003 |
|
C/N-T |
-0.1580 |
0.756 |
|
C/N-t |
1.8160 |
0.032 |
|
T-t |
0.6016 |
0.370 |
|
(C/N)2 |
-1.7675 |
0.495 |
|
T2 |
-0.0898 |
0.901 |
|
t2 |
0.4981 |
0.495 |
| C/N: carbon/nitrogen ratio; T: fermentation temperature; t: fermentation time | ||
For predicting the optimal culture media composition, a polynomial function was fitted to the experimental data (Eq. 3).
P = 0.286–0.296 C – 0.338 N – 0.010 Ph – 0.080 C2 + 0.213 C N – 0.310 C Ph + 0.570 N2 – 0.228 N Ph + 0.357 Ph2 [3]
where P is PHB productivity (mg/Lˑh), meanwhile C, N, Ph represents the carbon, nitrogen, and phosphorus concentration (mg/L) in the culture media.
This polynomial function represents a good fitted of experimental data since the determination coefficient (R2) was 0.8924. C and N have similar negative standardized coefficients (-0.296 and -0.338, respectively). The fact that these coefficients were negative means that PHB productivity decreased when C or N concentration were increased. Even though the coefficient of Ph was also negative, it was very low (-0.010), indicating that the effect of this variable on PHB productivity was not significant. Quadratic terms are model fit coefficients which demonstrate that there is a curvature and a local optimum point could be found. Thus, the optimum level for each studied variable, estimated from the maximum point of the polynomial PHB model, was estimated using the solver function of Statgraphics Centurion XV.II X64 tools. Optimum level of C, N, and Ph were -1, -1 and 0.935 respectively. Comparison with data found in the bibliography is difficult because several factors should be taken into account to analyze the effect of these variables on PHB productivity. For example, Bora (2013) studied the PHA synthesis by Bacillus megaterium, using fructose as carbon source, and K2HPO4 and Na2HPO4 as phosphorus sources. This author reported that fructose and its interaction with Na2HPO4 significantly affected PHB productivity. On the other hand, Nygaard et al. (2019) carried out fermentations for PHA production using Cupriavidus necator, and evaluated the effect of carbon, nitrogen and phosphorus concentration, as well as medium pH on the biopolymer productivity. Obtained results showed that productivity was statistically affected by N, pH, and C2. These examples from the literature demonstrate that the effect of fermentation variables on PHA productivity depends on many factors such as strain, nutrient sources, and fermentation conditions, among others. Therefore, the comparison with results obtained in this work is not suitable.
As it was aforementioned, phosphorus concentration did not have a significant effect on PHB productivity, so the response surface was built taking into account only carbon and nitrogen concentrations as independent parameters and the productivity as response variable (Figure 2). These response surface plots reinforced the discussed results about the effect of C and N concentrations on PHB productivity. As can be seen, productivity increased when the carbon and nitrogen concentration decreased. This could be attributed to the fact that vinasse contains phenolic compounds, difficult to be biologically degraded by bacteria, that have antimicrobial and phytotoxic properties (Parsaee et al. 2019). Besides, the decrease in PHB productivity by increasing nitrogen concentration may be due to that Bacillus sp. bacteria require the limitation of this nutrient for the production of PHB as metabolite (Kanekar et al. 2015).
From the optimum levels, PHB maximum productivity was calculated obtaining a value of 2.43 mg/Lˑh. This is a low productivity compared to values found in the literature. For example, Bhattacharyya et al.(2012) reported a PHB productivity of 0.21 g/Lˑh employing vinasse as carbon source and Haloferax meditaerranei as strain. Therefore, in order to improve PHB productivity by B. megaterium employing vinasse as carbon source, it was carried out an additional experimental design to optimize the C/N ratio and growing conditions (fermentation time and temperature). Therefore, it was performed 15 experiments given by the Box–Behnken experimental design and obtained PHB productivity (P) values are included in Table 3. The vinasse sample employed in these assays as carbon source was V2018. The p-value for the three variables and their interactions are given in Table 6. Taking into account the different independent variables, fermentation time had a statistically significant effect on PHB productivity (p = 0.0034). Meanwhile, fermentation temperature and C/N ratio did not significantly affect PHB productivity by B. megaterium (p = 0.7016 and 0.2777, respectively). Regarding the interaction between the variables, the only one that had a notable influence on PHB productivity was the one between C/N and time (0.0318), probably due to the significant effect of fermentation time. None of the quadratic terms resulted statistically significant. Equation 4 described the polynomial model which good-fitted to the experimental data with a determination coefficient (R2) of 0.9093.
P = 6.57 – 0.524 C/N – 0.175T – 2.25 t – 1.7 C/N2 – 0.2 C/N. T + 1.8 C/N. t – 0.08 T2 + 0.6 T.t + 0.5 t2 [2]
where P is the PHB productivity (mg/Lˑh), t is the fermentation time (h), and T is the fermentation temperature (°C).
The time variable had the largest negative standardized coefficient (-2.25), indicating that an increase in the fermentation time led to a decrease in PHB productivity. The longer the fermentation time the lower the productivity. This tendency is in good agreement with the low PHB production rate, not accumulating more PHB until the end of the cultivation. Similar behavior was reported by Dalsasso et al. (2019) studying PHB production by Cupriavidus necator using a blend of vinasse and sugarcane molasses as substrate. On the other hand, coefficients of C/N and T variables presented very low values, demonstrating that they had not a significant effect on the response variable. The quadratic coefficients and those of the interactions between variables resulted negligible, except the one corresponding to C/N and t interaction, mainly attributed to the effect of the fermentation time. In Figure 3 are shown the three response surface plots representing the productivity as response variable and C/N ratio and fermentation time (Figure 3a), temperature and fermentation time (Figure 3b), and C/N and temperature (Figure 3c) as independent variables. The only significant interaction was between C/N and t; when t value was minimal and the ratio C/N increased, the production of PHB increased. Besides, when t reached its highest value, the slope of PHB production as a function of C/N became negative (Figure 3a). The factor associated with the quadratic contribution of C/N presented its maximum value in the vicinity of the central point. Thus, the maximum PHB production occurred when C/N had a value of 23.95 (Figure 3a,c). As it can be seen, the temperature range assayed in these experiences did not significantly affect the PHB productivity (Figure 3b,c), despite these values are within the optimal growing temperature range for this strain (Porras et al. 2017).
The optimal value of C/N ratio, fermentation time and temperature to produce PHB by B. megaterium and vinasse as carbon source were 24.01, 30.25 °C and 24 h. The optimal productivity value in this case was 10.6 mg/Lˑh. Pramanik et al. (2012) reported a PHB productivity in the same magnitude order (0.015 g/L h) using a culture medium with 10 % raw vinasse as carbon source and Haloarcula marismortui as strain. Otherwise, reported values of PHB production by Bacillus megaterium by other authors are very variable according to the carbon source used. Jimenez (2011) informed a PHB productivity of 0.082 g/Lˑ h from glucose as carbon source, Obruca et al.(2011) reported a value of 0.056 g/Lˑh employing cheese whey, and Porras (2012) obtained a PHB productivity of 0.0125 g/Lˑh using starch.
As it was aforementioned, vinasse sample employed in the optimization of the media composition was V2017, meanwhile for the optimization of growing conditions it was employed V2018. The variability in physicochemical properties of both vinasse samples led to significant differences in PHB productivity. As it can be seen, the best values were obtained using V2018 in the second experimental design. When V2018 was employed, it reached a productivity 4.4 times higher than value obtained with V2017, estimated for the optimal conditions. This difference could be associated with the higher BOD and COD values of V2017 than those of V2018. Particularly, BOD high values indicate that microorganisms need more oxygen to degrade it (Porras 2012) and this issue could affect the PHB production by B. megaterium from V2017.
3.3. PHA extraction and characterization
Fermentations were carried out using the optimal composition. PHB was extracted and a characterization was done. Considering the mass of dry cells and extracted PHA, a polymer yield of 37 % was obtaining. Valappil et al. (2007) reported a similar value for PHA yield (31 %), using glucose as substrate and Bacillus cereus as microorganism. On the other hand, using vinasse as carbon source, Pramanik et al.(2012) obtained a PHA yield of 23 % employing Haloarcula marismortui as strain and Zanfonato et al.(2018) reported a maximum PHA yield of 26 % with Cupriavidus necator. In addition, Bacillus sp. accumulated 75.5 % (Das et al. 2018), 54.6 % (Mohanrasu et al. 2020) and 59 % (Jimenez 2011) PHA using cheese whey in the first case and glucose in the others, respectively.
FTIR spectra of synthesized PHA is shown in Fig. 4 and it is in consonance with the PHB structure reported in the bibliography. A high intense band at 1726 cm− 1 was observed which corresponds to the C = O stretch of the ester group (Lathwal et al. 2018). Absorption band at 1455 cm− 1 is attributed to the asymmetric deformation of C-H bonds in -CH2 groups, while the band at 1380 cm− 1 is assigned to the symmetric vibration of -CH3 groups. The band at 1230 cm− 1 is assigned to CH2 vibrations (Jimenez 2011).
Figure 4 also includes a SEM micrograph of the extracted biopolymer, showing the morphology of PHA granules. The microstructure gives a fairly porous material with fine grains interconnected and a strong tendency to form multigrain agglomerates. The morphology shows grains that are pseudo-spherical in shape with fairly uniform distribution. Similar observations were reported by Nwinyi and Owolabi (2019). They used microbial species obtained from an abattoir employing different carbon sources (acetate and molasses) in the mineral medium.
The melting temperature of obtained PHB was taken at the maximum of the endothermic peak in the DSC second heating thermogram. A value of 177.7°C was obtained which is in good agreement with values reported by Pradhan et al. (2018). These authors reported values of 175°C and 176°C for PHA obtained by Bacillus megaterium and Cupriavidus necator, respectively. The melting enthalpy determined of the PHA obtained in this study was 79.6 J/g. Pradhan et al.(2018) using B. megaterium and fructose as carbon source reported a melting enthalpy of 33 J/g and Ansari and Fatma (2016) obtained 83.2 J/g by Nostoc muscorum NCCU- 442 and glucose as carbon source.
TGA was performed to detect the thermal stability of PHA. The maximum degradation temperature for the PHA synthesized was determined using the first derivative of thermogravimetric curve. PHA degradation occurred in two stages: in the first step, the degradation started at 225°C and extended until 300°C with a maximum degradation occurring at 255°C and the second step began after 310°C and the maximum degradation took place at 325°C. The degradation in more than one stage was reported by various authors (Pradhan et al. 2018, Hassan et al. 2016, Liu et al. 2014) Particularly Hassan et al. (2016) showed that PHB from Bacillus sp. was decomposed in 3 stages and resisted until 320°C.
A medium was optimized to maximize PHA production with vinasse as carbon source. It was possible to determine the optimal culture medium composition and operating conditions. Vinasse composition had an important effect on productivity. FTIR spectrum, SEM micrography and melting temperature of extracted biopolymer are in good agreement with values reported in the literature.
This study demonstrated the successful utilization of vinasse for PHB production by Bacillus megaterium at the shake-flask level. Although promising at the laboratory level, scaled-up fermentation studies with better controlled conditions (mainly pH and dissolved oxygen) can provide further insight into the functional feasibility of PHA production from vinasse.
PHA: poly(hydroxyalcanoate)s; COD: Chemical Oxygen Demand; BOD: Biological Oxygen Demand; TOC: Total Organic Carbon; TN: Total Nitrogen; C: Carbon concentration, N: Nitrogen concentration, Ph: phosphorus concentration; GC: Gas chromatography, PHB: Poly(3-hydroxybutyrate); P: Productivity; C/N: carbon/nitrogen ratio; T: Temperature; t: Fermentation time; FTIR: Fourier-transform infrared spectroscopy; SEM: Scanning Electron Microscopy; DSC: Differential Scanning Calorimetry; TGA: Thermogravimetric analysis; Td: Thermal degradation temperature.
Ethics approval and consent to participate
Not applicable
Consent for publication
Not applicable
Availability of data and materials
All data generated or analyzed during this study are included in the manuscript.
Competing interests
The authors declare that they have no competing interests
Funding
This work was financed by Consejo Nacional de Investigaciones Científicas y Técnicas (Grant Number: PIP 112-201501-00127), Agencia Nacional de Promoción Científica y Tecnológica (Grant Number: PICT-2014-2410)
Authors’ contributions
D.T designed and performed experiments to optimize culture media and fermentation conditions using vinasse to PHA production, collected and analyzed data, and drafted the manuscript. O.V helped to perform and collect data to characterized the extracted PHA, as well as supervised and revised the manuscript. M.V designed and supervised the entire work, as well as drafted and revised the manuscript. All authors read and approved the final manuscript.
Acknowledgements
We express our gratitude to Consejo Nacional de Investigaciones Científicas y Técnicas, Agencia Nacional de Promoción Científica y Tecnológica, and Universidad Nacional del Sur for their financial support.
- Acosta-Cárdenas A, Alcaraz-zapata W, Cardona-betancur M (2018) Sugarcane molasses and vinasse as a substrate for polyhydroxyalkanoates (PHA) production • Melazas y vinaza de la caña de azúcar como sustrato para la producción de polihidroxialcanoatos ( PHA ). RevistasUnalEduCo 85:220–225
- Alsafadi D, Al-Mashaqbeh O (2017) A one-stage cultivation process for the production of poly-3-(hydroxybutyrate-co-hydroxyvalerate) from olive mill wastewater by Haloferax mediterranei. N Biotechnol 34:47–53. doi:10.1016/j.nbt.2016.05.003
- Amini M, Yousefi-massumabad H, Younesi H, Abyar H (2020) Production of the polyhydroxyalkanoate biopolymer by Cupriavidus necator using beer brewery wastewater containing maltose as a primary carbon source. J Environ Chem Eng 8:103588. doi:10.1016/j.jece.2019.103588
- Andrady AL (2015) Persistence of Plastic Litter in the Oceans. In: Bergmann M, Gutow L, Klages M (eds) Marine Anthropogenic Litter. Springer International Publishing, Cham, pp 57–72
- Anjum A, Zuber M, Zia KM et al (2016) Microbial production of polyhydroxyalkanoates (PHAs) and its copolymers: A review of recent advancements. Int J Biol Macromol 89:161–174. doi:10.1016/j.ijbiomac.2016.04.069
- Ansari S, Fatma T (2016) Cyanobacterial polyhydroxybutyrate (PHB): Screening, optimization and characterization. PLoS One 11:1–20. doi:10.1371/journal.pone.0158168
- Bhattacharyya A, Pramanik A, Mitra A et al (2012) Utilization of vinasse for the production of polyhydroxybutyrate by Haloarcula marismortui. Folia Microbiol (Praha) 57:71–79. doi:10.1007/s12223-011-0092-3
- Bora L (2013) Polyhydroxybutyrate Accumulation in Bacillus megaterium and Optimization of Process Parameters Using Response Surface Methodology. J Polym Environ 21:415–420. doi:10.1007/s10924-012-0529-z
- Bradstreet RB (1954) Kjeldahl Method for Organic Nitrogen. Anal Chem 26:185–187. doi:10.1021/ac60085a028
- Burke RW and RM (1977) Certification and Use of Acidic Potassium Dichromate Solutions as an Ultraviolet Absorbance Standard SRM 935. Dept. of Commerce, National Bureau of Standards, Washington, DC
- Carrilho ENVM, Labuto G, Kamogawa MY (2016) Destination of vinasse, a residue from alcohol industry: resource recovery and prevention of pollution. In: Environmental materials and waste: resource recovery and pollution prevention. Elsevier, Amsterdam. doi:10.1016/b978-0-12-803837-6.00002-0
- Dalsasso RR, Pavan FA, Bordignon SE et al (2019) Polyhydroxybutyrate (PHB) production by Cupriavidus necator from sugarcane vinasse and molasses as mixed substrate. Process Biochem 85:12–18. doi:10.1016/j.procbio.2019.07.007
- Das S, Majumder A, Shukla V et al (2018) Biosynthesis of Poly(3-hydroxybutyrate) from Cheese Whey by Bacillus megaterium NCIM 5472. J Polym Environ 26:4176–4187. doi:10.1007/s10924-018-1288-2
- de Godoi LAG, Camiloti PR, Bernardes AN et al (2019) Seasonal variation of the organic and inorganic composition of sugarcane vinasse: main implications for its environmental uses. Environ Sci Pollut Res 26:29267–29282. doi:10.1007/s11356-019-06019-8
- Eaton AD, Clesceri LS, Greenberg AE, Franson MAH (1998) Standard methods for the examination of water and wastewater, 20th edn. American P, Washington, DC
- Fabra MJ, López-rubio A, Ambrosio-martín J, Lagaron JM (2016) Improving the Barrier Properties of Thermoplastic Corn Starch-based Films Containing Bacterial Cellulose Nanowhiskers by Means of PHA Electrospun Coatings of Interest in Food Packaging. Food Hydrocoll 61:261–268. doi:10.1016/j.foodhyd.2016.05.025
- Fagier MA, Elmugdad AA, Aziz ME, Gabra NM (2018) Characterization of Sugarcane Vinasse. J Fac Sci Int Univ Africa 5
- Fukushima NA, Palacios-Bereche MC, Palacios-Bereche R, Nebra SA (2019) Energy analysis of the ethanol industry considering vinasse concentration and incineration. Renew Energy 142:96–109. doi:10.1016/j.renene.2019.04.085
- Prambudy H TS and FSA (2019) The testing of Chemical Oxygen Demand (COD) and Biological Oxygen Demand ( BOD ) of river water in Cipager Cirebon The testing of Chemical Oxygen Demand ( COD ) and Biological Oxygen Demand ( BOD ) of river water in Cipager Cirebon. In: International Symposium on Sciences, Engineering, and Technology. pp 0–6
- Hassan MA, Bakhiet EK, Ali SG, Hussien HR (2016) Production and characterization of polyhydroxybutyrate (PHB) produced by Bacillus sp. isolated from Egypt. J Appl Pharm Sci 6:46–51. doi:10.7324/JAPS.2016.60406
- Jimenez JAL (2011) Biopolímeros de interés industrial. Síntesis y caracterización de polyhidroxibutirato (PHB). Dissertation, Universidad Nacional del Sur
- Kanekar PP, Kulkarni SO, Nilegaonkar SS, Sarnaik SS, Kshirsagar PR, Ponraj M, Kanekar SP (2015) Polymers for packaging applications. In: Alavi S, Sabu T, Sandeep KP, Nandakumar K, Varghese Jini YS (eds) Polymers for packaging applications. Apple Academic Press, pp 197–225
- Kaur L, Khajuria R, Parihar L, Singh GD (2017) Polyhidroxyalkanoates: Biosynthesis to commercial production. J Microbiol Biotechnol Food Sci 6(4):1098–1106. doi:10.15414/jmbfs.2017.6.4.1098-1106
- Koller M (2018) Biodegradable and Biocompatible Polyhydroxy-alkanoates (PHA): Auspicious Microbial Macromolecules for Pharmaceutical and Therapeutic Applications. Molecules 23:362. doi:10.3390/molecules23020362
- Kourmentza C, Pl J, Venetsaneas N et al (2017) Recent Advances and Challenges towards Sustainable Polyhydroxyalkanoate (PHA) Production. Bioeng 2017:1–43. doi:10.3390/bioengineering4020055
- Kovalcik A, Obruca S, Marova I (2019) Polyhydroxyalkanoates: Their Importance and Future. BioResources 14:2468–2471
- Lathwal P, Nehra K, Singh M, Rana JS (2018) Characterization of Novel and Efficient Poly-3-hydroxybutyrate (PHB) Producing Bacteria Isolated from Rhizospheric Soils. J Polym Environ 26:3437–3450. doi:10.1007/s10924-018-1224-5
- Liu Y, Huang S, Zhang Y, Xu F (2014) Isolation and characterization of a thermophilic Bacillus shackletonii K5 from a biotrickling filter for the production of polyhydroxybutyrate. J Environ Sci (China) 26:1453–1462. doi:10.1016/j.jes.2014.05.011
- López JA, Naranjo JM, Higuita JC et al (2012) Biosynthesis of PHB from a New Isolated Bacillus megaterium Strain: Outlook on Future Developments with Endospore Forming Bacteria. Biotechnol Bioprocess Eng 17:250–258. doi:10.1007//s12257-011-0448-1
- Mohanrasu K, Rao RGR, Dinesh GH et al (2020) Optimization of media components and culture conditions for polyhydroxyalkanoates production by Bacillus megaterium. Fuel 271:117522. doi:10.1016/j.fuel.2020.117522
- Nakashima RN, de Oliveira Junior S (2020) Comparative exergy assessment of vinasse disposal alternatives: Concentration, anaerobic digestion and fertirrigation. Renew Energy 147:1969–1978. doi:10.1016/j.renene.2019.09.124
- Nielsen C, Rahman A, Rehman AU et al (2017) Food waste conversion to microbial polyhydroxyalkanoates. Microb Biotechnol 10:1338–1352. doi:10.1111/1751-7915.12776
- Nor NM, Mohamed MS, Loh TC et al (2017) Comparative analyses on medium optimization using one-factor-at-a-time, response surface methodology, and artificial neural network for lysine – methionine biosynthesis by Pediococcus pentosaceus RF-1. Biotechnol Biotechnol Equip 31:935–947. doi:10.1080/13102818.2017.1335177
- Nwinyi OC, Owolabi TA (2019) Scanning electron microscopy and Fourier transmission analysis of polyhydroxyalkanoates isolated from bacteria species from abattoir in Ota, Nigeria. J King Saud Univ - Sci 31:285–298. doi:10.1016/j.jksus.2017.08.003
- Nygaard D, Yashchuk O, Hermida ÉB (2019) Evaluation of culture medium on poly(3-hydroxybutyrate) production by Cupriavidus necator ATCC 17697: application of the response surface methodology. Heliyon 5: Issue 3:e01353. doi:10.1016/j.heliyon.2019.e01374
- Obruca S, Marova I, Melusova S, Mravcova L (2011) Production of polyhydroxyalkanoates from cheese whey employing Bacillus megaterium CCM 2037. Ann Microbiol 61:947–953. doi:10.1007/s13213-011-0218-5
- Pais J, Serafim LS, Freitas F, Reis MAM (2016) Conversion of cheese whey into poly(3-hydroxybutyrate-co-3-hydroxyvalerate) by Haloferax mediterranei. N Biotechnol 33:224–230. doi:10.1016/j.nbt.2015.06.001
- Parsaee M, Kiani M, Kiani D, Karimi K (2019) A review of biogas production from sugarcane vinasse. Biomass Bioenerg 122:117–125. doi:10.1016/j.biombioe.2019.01.034
- Popolizio DAT (2017) Efecto de la aplicación de vinazas de la industria del tequila en el cultivo del maíz y en la asociación planta-hongos micorrízicos arbusculares (hma). Centro de Investigación y Asistencia en Tecnología y Diseño del Estado de Jalisco
- Porras MA (2012) Producción de Poli(Hidroxialcanoato)s (PHA)s a partir de fuentes renovables de bajo costo. Dissertation, Universidad Nacional del Sur
- Porras MA, Villar MA, Cubitto MA (2017) Novel spectrophotometric technique for rapid determination of extractable PHA using Sudan black dye. J Biotechnol 255:28–32. doi:10.1016/j.jbiotec.2017.06.012
- Pradhan S, Dikshit PK, Moholkar VS (2018) Production, ultrasonic extraction, and characterization of poly (3-hydroxybutyrate) (PHB) using Bacillus megaterium and Cupriavidus necator. Polym Adv Technol 29:2392–2400. doi:10.1002/pat.4351
- Pramanik A, Mitra A, Arumugam M et al (2012) Utilization of vinasse for the production of polyhydroxybutyrate by Haloarcula marismortui. Folia Microbiol (Praha) 57:71–79. doi:10.1007/s12223-011-0092-3
- Riis V, Mai W (1988) Gas chromatographic determination of poly-hydroxybuyric acid in microbial biomass after hydrochloric acid propanolysis. J qf Chromatogr 445:285–289
- Syaichurrozi I (2016) Biogas Technology to Treat Bioethanol Vinasse. Waste Technol 4:16–23
- Valappil SP, Misra SK, Boccaccini AR et al (2007) Large-scale production and efficient recovery of PHB with desirable material properties, from the newly characterised Bacillus cereus SPV. J Biotechnol 132:251–258. doi:10.1016/j.jbiotec.2007.03.013
- Vandi L, Chan CM, Werker A et al (2018) Wood-PHA Composites: Mapping Opportunities. Polym 2018 10:1–15. doi:10.3390/polym10070751
- Zanfonato K, Schmidt M, Quines LK et al (2018) Can vinasse be used as carbon source for Poly(3-hidroxybutyrate). Production by Cupriavidus necator DSM 545. Brazilian J Chem Eng 35:901–908