Cotton fibers have a high crystallinity, which makes a large number of reactive hydroxyl groups blocked and therefore affects the ink-jet printing performance of reactive dyes on cotton fabrics. In this work, the alkali treatment was employed to adjust the structure of cotton fibers. The crystallinity of treated cotton fibers reduced from 73.9–58.5%, and the breaking strength did not decrease compared with original cotton fiber. Thus, the accessible reactive hydroxyl groups and the wettability were enhanced for treated cotton fibers, which promoted the penetration of inks into the fibers. The optimal K/S value of 23.47 was achieved for treated cotton fabrics which was higher than that of untreated cotton fabrics (17.15). Meanwhile, the printed fabrics displayed good washing fastness, rubbing fastness and glossiness. This work provides an effective way for improving the utilization of dye solution and producing high-quality cotton fabric digital printing products.
Research Article
Enhancing digital ink-jet printing patterns quality through controlling the crystallinity of cotton fibers
https://doi.org/10.21203/rs.3.rs-804119/v1
This work is licensed under a CC BY 4.0 License
You are reading this latest preprint version
Cotton fabric
Crystallinity
Digital ink-jet print
Alkali treatment
Cotton has been well known as one of the most popular agricultural renewable resources because of its excellent hand feel, moisture absorption and air permeability (Zhang et al. 2020b; Zhang et al. 2020c; Wang et al. 2018; Wu et al. 2021). Digital inkjet printing as a burgeoning technology has been widely used in the field of textile printing. Cotton fabric was extensively used in digital inkjet printing as a good substrate. The inkjet printing technology provides an opportunity for repaid the development of the cotton fabric printing industry because of its high resolution and flexibility (C.W.M.Yuen et al. 2007; C.W.M.Yuen et al. 2004; P.S.R.Choi et al. 2005; El-Hennawi et al. 2015; Zhou et al. 2018; Song et al. 2018; Tang et al. 2019; Wang et al. 2019). In the process of inkjet printing, tiny droplets are sprayed onto the fabrics through the nozzle to form patterns (An et al. 2020a; An et al. 2020b). However, the high crystallinity of cotton fiber prevents the ink droplets from penetrating into the fiber (El-Zaher et al. 2019; Liu et al. 2019; Zhong et al. 2020), resulting in low dye utilization in the process of inkjet printing. The color strength of digital print patterns on cotton fabrics was also adversely affected. Therefore, the fabric must be treated before inkjet printing to obtain high-quality printing patterns (Li et al. 2018; Liang et al. 2021a; Li et al. 2021; Song et al. 2020).
To solve the above problems, several researchers have improved the color intensity of cotton fabrics by pretreatment. Liu et al. selected sodium alginate (SA) and high fatty acid (PT) as pretreatment agents of cotton fabric to enhance the ink-jet printing performance of cotton fabrics by inhibiting the diffusion of ink droplets (Liu et al. 2016). Jeferson Correia et al. reported that cationic modification of cotton fabric with 3-chloro-2-hydroxypropyl trimethylammonium chloride enhanced the affinity between cotton and reactive dyes and improved the inkjet printing performance of cotton fabric (Correia et al. 2020). Yang et al. prepared a cationic nanosphere to modify cotton fabrics, which enhanced the electrostatic attraction between cotton fabric and reactive dyes, and improved the color performance (Yang et al. 2019). Pransilp, P et al. achieved a good color strength through increasing the contact area between ink and cotton fibers by plasma etching (Pransilp et al. 2016). However, most of the current studies only focus on the pretreatment of cotton fabrics, and the influence of cotton fiber crystallinity on the ink-jet printing performance has not been studied.
It has been reported that alkali treatment could change the internal structure and physicochemical properties of cellulose. Wakida, T et al. used sodium hydroxide/liquid ammonia to treat cotton fabrics, and found that with the decrease of the crystallinity of cotton fibers, the water absorption rate and dye utilization rate increased (Wakida et al. 2000). Poondodi, G. R et al. treated regenerated cellulose fibers by sodium hydroxide swelling method. The results showed that the dyeing performance of regenerated cellulose yarn was effectively improved after alkali treatment (Poongodi et al. 2019). Gao et al. pointed out that using NaOH/urea aqueous solution system to treat waste cotton fabric can change its morphology and reduce its crystallinity (Gao et al. 2020). As a consequence, it is feasible to change the morphology and chemical properties of cotton fibers through alkali solution treatment, thus to improve the inkjet printing performance. However, the related research in this area has not been reported yet.
In this work, the effects of cotton fiber crystallinity on color performance and ink penetration of cotton fabric inkjet printing were investigated. The crystallinity of cotton fiber could be controlled by adjusting the alkali treatment time. The crystal structure of cotton fibers was studied by 2D-GIXD scattering patterns. The changes of surface groups were characterized by FTIR spectra. The morphology changes of cotton fabric were observed by the scanning electron microscope (SEM). Meanwhile, contact angle and capillary effect were measured to characterize the wettability of cotton fabrics before and after treatment, and the wetting process of ink drops on the fabric surface was observed. The color strength and color fastness of printed cotton fabrics were evaluated to test the ink-jet printing performance. Moreover, the breaking strength and glossiness of the cotton fabrics were also tested. Based on this study, the alkali treated fabric was identified as a good substrate for digital inkjet printing, which provided an effective way to produce high-quality printed cotton products.
2.1. Experimental Materials
C.I. reactive orange 13 (Fig. 1) was obtained from Everlight chemistry Co., Ltd., (Taiwan, China). Ethylene glycol and sodium m-nitrobenzene sulfonate were purchased from Aladdin Biochemical Technology Co., Ltd., (Shanghai, China). Urea and sodium bicarbonate were obtained from Sinopharm Chemical Reagent Co., Ltd., (Shanghai, China). The deionized water applied in this study was prepared by ultra-pure water filtration system, the resistivity of the deionized water was 18.2 MΩ·cm. 100% cotton twill fabric (32×21/133×60, YuYue Home Textiles Co., Ltd, Shandong, China) was used in this research.
2.2. Preparation of dye solutions
The active orange 13 solution was prepared in a 50 mL volumetric flask. The mixtures of water and ethylene glycol were prepared in advance. The ethylene glycol concentration was 20 % by weight. The certain amount of reactive dye was added to ethylene glycol aqueous solution (Cao et al. 2021; Qi et al. 2020; Wang et al. 2020; Zhang et al. 2019; Uzun et al. 2020; Xie et al. 2022). The concentration of reactive dye in all solutions was 50 mmol/L. In the process of ink-jet printing, viscosity and surface tension of reactive dye inks play very important roles in the formation of ink droplets and the fluency of inkjet printing. In this experiment, the viscosity of the ink was 1.62 mPa·s and the surface tension was 63.57 mN/m, respectively, as shown in Fig. S1a and Fig. S1b.
2.3. Alkali treatment
The cotton fabric with tension was soaked in a 250 g/L NaOH aqueous solution at room temperature for 10 s, 20 s, 30 s, 60 s, 90 s, and then immersed in 80°C water to remove extra alkali solution. Finally, the cotton fabric was neutralized by 2 g/L sulfuric acid.
2.4. Sodium alginate pretreatment
All cotton fabrics were soaked and rolled with a solution containing sodium alginate, urea, sodium bicarbonate and sodium m-nitrobenzene sulfonate at 90 % pickup, and dried at 100°C (Tang et al. 2020).
2.5. Inkjet printing system
The inkjet printing system used in this research under laboratory conditions was supplied by Shanghai Ruidu Optoelectronics Technology Co., Ltd. As shown in Fig. 2, the inkjet printing system consists of a nozzle, a movable platform, a light source and a high-speed camera. When inkjet printing, the cotton fabric was adhered to a movable platform, and the nozzle can move up and down. By controlling the movement of the nozzle and the platform, patterns can be generated on the cotton fabric (Zhang et al. 2020a). The droplet shape of reactive dye ink was very important for the fineness and clarity of inkjet printing patterns. As shown in Fig. S1c, there were no satellite ink drops in the process of ink drops from the nozzle, which met the printing conditions (Qin et al. 2020; Wijshoff 2018). In factory production, the effect of cotton fiber crystallinity on ink-jet printing performance was investigated by using vega 5000 digital inkjet printing machine (VEGA5000, Atexco, China), a cartoon pattern was designed for inkjet printing.
2.6. Characterization
2.6.1. Color measurements of printed cotton fabrics
The color strength (K/S values) and colorimetric parameters (L*, a*, b*, C* and h°) of printed cotton fabric were measured by datacolor 850 spectrophotometer (Datacolor Co., USA). Each fabric was measured at five different locations, and obtained the reflectivity (R) value at the maximum absorption wavelength (Shi et al. 2021). The color strength (K/S values) of fabric could be expressed by Eq. (1):
K/S=(1-R)2/2R (1)
C* and h° were counted by Eqs. (2) and (3), respectively.

2.6.2. Surface analysis
The Fourier transform infrared (FTIR) spectroscopy of cotton fabrics was carried out using a Nicolet iS 10 instrument (Thermo Fisher Scientific, US). The two-dimension grazing incidence X-ray diffraction(2D-GIXD) of cotton fabrics were measured by two-dimensional grazing incidence wide-angle scattering (Xenocs company, France). A scanning electron microscope (SEM, Phenom Pure) was used to observe the morphological changes of cotton fibers treated with high concentration alkali solution under 5 kV accelerating voltage.
2.6.3. Wettability
The wettability of cotton fabric before and after alkali treatment was characterized by measuring contact angle and capillary effect. The static contact angle of cotton fabric was measured by using Dataphysics-OCA 25(Germany). A drop (ethylene glycol) was injected into the cotton fabric. The volume of the drop was 3 µL and the injection speed was 0.5 µL/s. At the same time, this method was used to simulate the wetting process of ink drops on cotton fabric. The fabric before and after treatment was cut into 3 cm *25 cm strips, and then one side of the cotton fabric was immersed in deionized water to observe the climbing height of deionized water on the cotton fabric at different times.
2.6.4. Glossiness
3 nh glossmeter was used to test the glossiness of cotton fabrics before and after treatment, and each fabric was measured at six different locations, and then obtained the average of the data.
2.6.5. Breaking strength and color fastness
The breaking strength was measured by electronic fabric strength tester (Shanghai Sansi Experimental Instrument Co., Ltd). A Sw-12A washing color fastness tester (Wuxi Textile Instrument Co., China) was used to measure the washing fastness according to ISO 105-C10:2007. The rubbing fastness was tested by Q238BB rubbing colorfastness tester (Gellowen Co., Ltd., UK) based on GB/T 3920 − 2008.
3.1. Surface properties analysis of cotton fabric
The two-dimension grazing incidence X-ray diffraction measurements were used to observe the crystallinity of cotton fiber. And the 2D-GIXD scattering patterns were depicted in Fig. 3a − f, the cotton fibers crystallinity was decreased as indicated by the weakening of scattering intensity (Li et al. 2016). The weakening of lamellar peak also meant the increase of amorphous state of cotton fiber (Mai et al. 2016). To further study the change of the crystal structure of the treated cotton fabric, the above diffraction patterns were integrated and the corresponding curve shown in Fig. 3g was obtained. Cellulose I is a mixture of cellulose Iα and cellulose Iβ of two crystal forms, cellulose Iα mainly existed in bacterial cellulose and seaweed cellulose, while cellulose Iβ mainly existed in the fibers of higher plants(Liang et al. 2021b; French 2014). Cellulose I was a parallel chain structure. The original samples showed the characteristic diffraction of cellulose Iβ, and the diffraction peaks appeared at 2θ = 14.7 °, 16.8 °, 20.5°, 22.7 ° and 34.8 °, corresponding to the diffractions of the (1–10), (110), (012/102), (200) and (040) crystal planes. Weak diffraction peaks appeared at 2θ = 12.1 ° and 20.1 ° corresponding to the (1–10) and (110) lattice planes respectively after treatment, which was typical characteristics for cellulose Ⅱ(Sebe et al. 2012). In the progress of alkali treatment, sodium hydroxide entered the amorphous region of the cotton fiber and separated the crystallites in the cotton fiber, resulting in the structure of Na-cellulose Ⅰ. After the alkali treatment, Na-cellulose Ⅰ was rinsed with water to remove alkali, and then Na-cellulose Ⅰ was converted to Na-cellulose Ⅳ (hydrate form of cellulose II) (Sarko 2021; Nishiyama. et al. 2000). After drying and removing water, the crystal structure of cellulose II with antiparallel structure is formed(Langan. et al. 2001). However, due to the existence of tension, the penetration of sodium hydroxide solution in the highly ordered crystal structure of cotton fiber was limited. Therefore, the cellulose Ⅰ was not completely transformed into cellulose Ⅱ during the treatment. As shown in Fig. 3i, the original samples exhibited the crystalline form of cellulose Ⅰ. The crystal structure of treated cotton fiber is a mixed structure of cellulose Ⅰ and cellulose Ⅱ.
To better investigate the changes of cotton fiber crystallinity after treatment, Eq. (4) was used to calculate the crystallinity of cotton fiber(Zhang et al. 2021), and the results were shown in Table 1.

|
Treated Time (s) |
Crystal zone content (%) |
Amorphous region content (%) |
|---|---|---|
|
0 |
73.9 |
26.1 |
|
10 |
65.1 |
34.9 |
|
20 |
63.5 |
36.5 |
|
30 |
62.5 |
37.5 |
|
60 |
59.3 |
40.7 |
|
90 |
58.5 |
41.5 |
As the cellulose molecular chain was a highly ordered structure, this ordered structure was a network formed by a large number of intramolecular and intermolecular hydrogen bonds, resulting in high crystallinity of cotton fiber. From Table 1, the crystallinity of the treated cotton fiber was reduced from 73.9–58.5%. This result implied that alkali could reduce the crystallinity of cotton fibers through breaking the degree of order of cellulose macromolecular chains.
To further investigate the surface properties of cotton fibers, FTIR spectra of the cotton fabrics, before and after alkali treatment, were demonstrated in Fig. 3h. All samples treated by alkali showed the similar spectral curves, indicating that no new groups were produced after treatment. The stretching of the strong hydrogen bond -OH near 3455 − 3210 cm− 1 is universally observed in all spectra(Tarbuk et al. 2014). The bands at around 3455–3410 cm− 1 and 3375–3340 cm− 1, which were assigned to O3H···O5 and O2H···O6 intramolecular hydrogen bonds(Schwanninger et al. 2004). The intermolecular hydrogen bonding of O6H···O3 in cellulose are generally shown 3310–3230 cm− 1(Duchemin 2015; Remadevi et al. 2018). The maximum absorption peak of the OH stretching vibration of the treated cotton fiber was transferred to a higher wavenumber. The crystal structure of cellulose was transformed from cellulose I to cellulose II by high concentration alkali treatment(Oh et al. 2005). Moreover, the alkali treatment reduced the OH stretching vibration mainly caused by intramolecular hydrogen bonds.
The morphology of cotton fibers treated by high concentration alkali at different times were observed by scanning electron microscopes (SEM). As illustrated in Fig. 4a and Fig. 4g, the cross section of original cotton fiber was flat waist shaped with a large cell cavity. The longitudinal direction of untreated cotton fiber had natural distortion and rough surface. As for the cotton fabrics treated by high concentration alkali solution, sodium hydroxide solution diffuses rapidly into the fiber. Because of the deconvolution, cotton fibers changed from natural twisted band structure to rod structure with smooth surface.(Liang et al. 2021b). As shown in Fig. 4b-4f, the cross section of cotton fiber gradually changed from flat oval to round with the increase of treatment time, and the cell cavity gradually became smaller, and finally reduced to a line. As illustrated in Fig. 4h-4l, the surfaces of the cotton fibers became a little smooth after treatment, and the vertical natural torsion gradually disappeared.
The glossiness of the treated cotton fabrics treated was shown in Table 2. All the treated cotton fabrics exhibited excellent glossiness than original fabric. The results clearly indicated that the glossiness of cotton fabrics might be related to morphological structure. Combined with Fig. 4, the cross section of the cotton fibers treated with alkali solution changed from ear shape to round shape, the wrinkles on the surface of the fiber disappeared and the surface became smooth. As a result, the treated fibers exhibited an improvement in light reflection, bringing much better glossiness.
|
Treated Time(s) |
0 |
10 |
20 |
30 |
60 |
90 |
|---|---|---|---|---|---|---|
|
Glossiness |
2.15 |
2.41 |
2.43 |
2.45 |
2.44 |
2.50 |
3.2. Effect of crystallinity on ink deposition morphology
Figure 5a and Fig. 5b showed the wettability of cotton fabric through the contact angle and capillary effect measurement. It could be seen from Fig. 5a that the treated cotton fabric obtained a better capillary effect. The wicking height of original cotton fabric was 65 mm in 30 minutes. In comparison, the wicking height of the treated cotton fabric increased with the increase of high concentration alkali solution treatment time. The wicking height changed little when the treatment time reached 60 s. The reason was that the crystallinity of treated cotton fiber decreased and the amorphous region increased. The increase of amorphous region led to the increase of accessible hydrophilic groups in the fiber, and water molecules could rapidly form hydrogen bonds with hydrophilic group, which led to the increase of wicking height. At the same time, cotton fibers could be regarded as a porous medium, and liquid could be transported in the porous medium (Zhu et al. 2019; Zhao et al. 2021). After alkali treatment, the fiber swelled and the gap between fibers became smaller, which was helpful to improve the wicking height.
The droplet spread rapidly on the fabric due to the capillary pressure and hydrogen bonding after contacting the cotton fabric. As depicted in Fig. 5b, the contact angle of cotton fabrics gradually decreased with the increase of treatment time. After the treatment, the accessible hydroxyl groups on the fiber surface increased and the hydrogen bond between the droplet and the fiber surface was enhanced (Song et al. 2021). As the fiber swelled, the fiber gap became smaller and the capillary pressure increased, the droplet diffusion on the fabric accelerated. Therefore, under the action of hydrogen bond and capillary pressure, the contact angle of droplet on the treated cotton fabric gradually decreased and finally reached an equilibrium state.
As shown in Fig. S2, the diffusion of ink drops on cotton fabric was mainly divided into two parts: the first was that the ink drops fall on the fabric, and the second was that the ink drops wet the cotton fabric (Josserand and Thoroddsen 2016; Rioboo et al. 2002). This process mainly included the spreading and penetration of ink droplets on the fabric, and finally stable deposition on the fabric surface to form a line pattern (Zhang et al. 2020a). The wetting state of droplets on the fabric was observed, and the deposition state of droplets on the fabric before and after treatment was further investigated, as shown in Fig. 5c-5e. After the droplets hit the fabric, they permeate and spread instantly (Mhetre et al. 2010). The wetting speed of the droplets on the treated cotton fabric was obviously accelerated. Combined with the results in Fig. 3, it was believed that with the decrease of crystal area, the penetration of droplets into the fiber amorphous area increased after the droplets impacted on the fabric surface, which accelerated the penetration of droplets perpendicular to the fabric surface. That also meant that the increase of amorphous area, the combination of cotton fabric and dye ink increased, leading to the improvement of dye utilization (Xie et al. 2020).
3.3. Study on inkjet printing performance of cotton fabric
The color strength of the cotton fabric directly reflects the distribution of dye molecules in inkjet printed fabrics. In ink-jet printing, the amount of dye in each area is certain, so the darker the color of printed cotton fabric means the higher the ink utilization. The effect of crystallinity on color intensity of inkjet printed cotton fabrics was investigated. As shown in Fig. 6a, the color strength of cotton fabrics increased with the increase of treatment time and the color intensity of the treated cotton fabric reached the maximum K/S value in 60 s. There was no obvious change when the treatment time was over 60 s. The reason may be that when the cotton fabric was treated with alkali for 60 s, the absorption capacity of cotton fabric to dyes reached the maximum. Based on the above research, it could be concluded that alkali treatment increased the wettability of cotton fiber, making the dye molecules more easily penetrate into the fibers. At the same time, the crystal area in the fiber decreased and the amorphous region increased, leading to the increase of the reaction sites in the fibers. Therefore, the color strength of the treated printed cotton fabric was high after steam washing. The schematic mechanism was shown in Fig. 6b.
The color data of inkjet printed cotton fabrics with reactive dye inks were shown in Table 3. L* and C* represent lightness and chroma, respectively (An et al. 2020a). It can be seen that the printed cotton fabrics treated for 60 s obtained the lowest L* values and the largest C* for all the cotton fabric samples, indicating that the cotton fabrics got the deepest colors. a* represents the degree of greenness(-) and redness(+), b* corresponds to the degree of blueness(-) and yellowness(+) and h° represents the hue angle (Li et al. 2021). At the same time, both a* and b* are positive, which means that orange is a mixture of red and yellow. These color data have a certain relationship with the dyes used. All in all, alkali treatment can improve the printing quality of cotton fabric through controlling the crystallinity of cotton fibers. Furthermore, the best color strength can be obtained by treating the cotton fabric for 60 s, and the color strength of printed cotton fabric has no obvious change by prolonging the treatment time.
As mentioned above, the color strength of ink-jet printing on cotton fabrics could be improved by controlling the crystallinity of cotton fiber. Figure 6c-6e showed the scanning images of inkjet printed cotton fabrics treated with alkali for different time under laboratory conditions. Compared with untreated cotton fabrics, the color strength of alkali-treated cotton fabrics improved in different extents. And the highest color strength was achieved after 60 s of treatment, and the trend of color change was consistent with Fig. 6a. To verify the feasibility of implementation in the factory, cotton fabrics with alkali treatment time of 0 s, 10 s and 60 s were printed with vega 5000 digital inkjet printing machine, as shown in Fig. 6f-6h, and the color change trend was consistent with the above.
|
Treated time(s) |
L* |
a* |
b* |
C* |
h° |
|---|---|---|---|---|---|
|
0 |
62.37 |
56.22 |
64.23 |
85.36 |
48.80 |
|
10 |
62.06 |
56.52 |
67.18 |
87.79 |
49.93 |
|
20 |
61.86 |
57.07 |
68.72 |
89.33 |
50.29 |
|
30 |
60.45 |
57.99 |
66.20 |
88.01 |
48.78 |
|
60 |
60.31 |
58.38 |
69.02 |
90.40 |
49.78 |
|
90 |
60.38 |
58.46 |
68.55 |
90.09 |
49.54 |
Table 4 showed the color fastness and breaking strength of different cotton samples. The range of color fastness was from 1 to 5, the larger the value of color fastness, the better the color fastness (An et al. 2020b). All printed products showed excellent color fastness to washing and rubbing, as all color fastness levels were higher than 4. Table 3 also indicated that cotton fabrics treated with alkali exhibit better mechanical properties than untreated fabrics. In the process of alkali treatment, the cellulose macromolecules were arranged neatly and the orientation of the fiber was increased due to the presence of tension. As a result, cellulose molecular chains could more synergistically resist the destruction of external forces, thus reducing the fracture phenomenon caused by stress concentration (Ahmed et al. 2017). Hence, the treated cotton fabric got a better breaking strength than original fabric.
|
Treated Time(s) |
Washing Fastness |
Rubbing Fastness |
Breaking strength(N) |
||
|---|---|---|---|---|---|
|
SC |
CC |
Dry |
Wet |
||
|
0 |
4–5 |
4–5 |
4–5 |
4–5 |
486.0 |
|
10 |
4–5 |
4–5 |
4–5 |
4–5 |
493.0 |
|
20 |
4–5 |
4 |
5 |
4–5 |
494.0 |
|
30 |
4–5 |
4–5 |
5 |
5 |
495.6 |
|
60 |
4–5 |
4–5 |
5 |
5 |
495.2 |
|
90 |
4–5 |
4 |
5 |
4–5 |
495.0 |
| a SC = Staining to cotton fabric, CC = color change. | |||||
In this work, the effect of crystallinity on ink-jet printing performance of cotton fabric was investigated. The crystallinity of cotton fibers could be modified by controlling the alkali treatment time. The treated cotton fibers crystallinity was reduced from 73.9–58.5%, and therefore the treated cotton fibers had more reaction sites with dyes. Compared with the original cotton fiber, the alkali treated cotton fiber swelled, which increased the contact area between dyes and fibers. Meanwhile, its wettability was also enhanced, which benefitted for the ink drops to penetrate into the fiber. Therefore, a higher K/S value of 23.47 was achieved for the treated cotton fabrics compared with the original sample with a K/S value of 17.15. This work provides an effective way to improve the utilization rate of reactive dyes and therefore the printing performance for cotton fabric in digital ink-jet printing.
Acknowledgement
This work was supported by National Key R&D Program of China (2017YFB0309800), State Key Laboratory of Bio-Fibers and Eco-Textiles (Qingdao University), No. ZKT01 and Department of Science and Technology of Shandong Province of China (Grant No.: ZR2020QE099).
Conflict of interest
The authors declare no competing financial interest.
- Ahmed R, Mia S, Nabijon N, Neaz Morshed M, Heng Q (2017) Knit fabric mercerisation through the use of high-concentration naoh in a scouring and bleaching bath using an exhaustion method. Tekstilec 60(4):324–330. doi:10.14502/Tekstilec2017.60.324-330
- An F, Fang K, Liu X, Li C, Liang Y, Liu H (2020a) Rheological properties of carboxymethyl hydroxypropyl cellulose and its application in high quality reactive dye inkjet printing on wool fabrics. Int J Biol Macromol 164:4173–4182. doi:10.1016/j.ijbiomac.2020.08.216
- An F, Fang K, Liu X, Yang H, Qu G (2020b) Protease and sodium alginate combined treatment of wool fabric for enhancing inkjet printing performance of reactive dyes. Int J Biol Macromol 146:959–964. doi:10.1016/j.ijbiomac.2019.09.220
- Yuen CWM, A.Ku SK, Kan CW, P.S.R.Choi (2007) A two-bath method for digital ink-jet printing of cotton fabric with chitosan. Fiber Polym 8 (6):625–628. doi:10.1007/BF02876000
- Yuen CWM, A.Ku SK, Choi PSR, C.W.Kan (2004) The effect of the pretreatment print paste contents on colour yield of an ink-jet printed cotton fabric. Fiber Polym 5(2):117–121. doi:10.1007/BF02902924
- Cao C, Zhao Z, Qi Y, Peng H, Fang K, Xie R, Chen W (2021) Effects of alkanolamine solvents on the aggregation states of reactive dyes in concentrated solutions and the properties of the solutions. RSC Adv 11(18):10929–10934. doi:10.1039/d0ra10656a
- Correia J, Rainert KT, Oliveira FR, de Cássia SC, Valle R, Valle JAB (2020) Cationization of cotton fiber: an integrated view of cationic agents, processes variables, properties, market and future prospects. Cellulose 27(15):8527–8550. doi:10.1007/s10570-020-03361-w
- Duchemin BJC (2015) Mercerisation of cellulose in aqueous NaOH at low concentrations. Green Chem 17(7):3941–3947. doi:10.1039/c5gc00563a
- El-Hennawi HM, Shahin AA, Rekaby M, Ragheb AA (2015) Ink jet printing of bio-treated linen, polyester fabrics and their blend. Carbohydr Polym 118:235–241. doi:10.1016/j.carbpol.2014.10.067
- El-Zaher NA, El-Bassyouni GT, Esawy MA, Guirguis OW (2019) Amendments of the structural and physical properties of cotton fabrics dyed with natural dye and treated with different mordants. J Nat Fibers 18(9):1247–1260. doi:10.1080/15440478.2019.1689884
- French AD (2014) Idealized powder diffraction patterns for cellulose polymorphs. Cellulose 21(2):885–896. doi:10.1007/s10570-013-0030-4)
- Gao L, Shi S, Hou W, Wang S, Yan Z, Ge C (2020) NaoH/urea swelling treatment and hydrothermal degradation of waste cotton fiber. J Renew Mater 8(6):703–713. doi:10.32604/jrm.2020.09055
- Josserand C, Thoroddsen ST (2016) Drop impact on a solid surface. Annu Rev Fluid Mech 48(1):365–391. doi:10.1146/annurev-fluid-122414-034401
- Langan P, Nishiyama. Y, Chanzy. H (2001) X-ray structure of mercerized cellulose II at 1 angstrom resolution. Biomacromol 2(2):410–416. doi:10.1021/bm005612q
- Li C, Fang L, Fang K, Liu X, An F, Liang Y, Liu H, Zhang S, Qiao X (2021) Synergistic effects of alpha olefin sulfonate and sodium alginate on inkjet printing of cotton/polyamide fabrics. Langmuir 37(2):683–692. doi:10.1021/acs.langmuir.0c02723
- Li M, Zhang L, An Y, Ma W, Fu S (2018) Relationship between silk fabric pretreatment, droplet spreading, and ink-jet printing accuracy of reactive dye inks. J Appl Polym Sci 135(45):46703. doi:10.1002/app.46703
- Li S, Liu W, Shi M, Mai J, Lau T-K, Wan J, Lu X, Li C-Z, Chen H (2016) A spirobifluorene and diketopyrrolopyrrole moieties based non-fullerene acceptor for efficient and thermally stable polymer solar cells with high open-circuit voltage. Energ Environ Sci 9(2):604–610. doi:10.1039/c5ee03481g
- Liang Y, Liu X, Fang K, An F, Li C, Liu H, Qiao X, Zhang S (2021a) Construction of new surface on linen fabric by hydroxyethyl cellulose for improving inkjet printing performance of reactive dyes. Prog Org Coat 154:106179. doi:10.1016/j.porgcoat.2021.106179
- Liang Y, Zhu W, Zhang C, Navik R, Ding X, Mia MS, Pervez MN, Mondal MIH, Lin L, Cai Y (2021b) Post-treatment of reactive dyed cotton fabrics by caustic mercerization and liquid ammonia treatment. Cellulose 28(11):7435–7453. doi:10.1007/s10570-021-03984-7
- Liu W, Liu S, Liu T, Liu T, Zhang J, Liu H (2019) Eco-friendly post-consumer cotton waste recycling for regenerated cellulose fibers. Carbohydr Polym 206:141–148. doi:10.1016/j.carbpol.2018.10.046
- Liu Z, Fang K, Gao H, Liu X, Zhang J (2016) Effect of cotton fabric pretreatment on drop spreading and colour performance of reactive dye inks. Color Technol 132(5):407–413. doi:10.1111/cote.12232
- Mai J, Lau T-K, Li J, Peng S-H, Hsu C-S, Jeng US, Zeng J, Zhao N, Xiao X, Lu X (2016) Understanding morphology compatibility for high-performance ternary organic solar cells. Chem Mater 28(17):6186–6195. doi:10.1021/acs.chemmater.6b02264
- Mhetre S, Carr W, Radhakrishnaiah P (2010) On the relationship between ink-jet printing quality of pigment ink and the spreading behavior of ink drops. J Text I 101(5):423–430. doi:10.1080/00405000802449984
- Nishiyama Y, Kuga S, Okano. T (2000) Mechanism of mercerization revealed by X-ray diffraction. J Wood Sci 46(6):452–457. doi:10.1007/BF00765803
- Oh SY, Yoo DI, Shin Y, Seo G (2005) FTIR analysis of cellulose treated with sodium hydroxide and carbon dioxide. Carbohydr Res 340(3):417–428. doi:10.1016/j.carres.2004.11.027
- Choi PSR, Yuen CWM, A.Ku SK, C.W.Kan (2005) Digital ink-jet printing for chitosan-treated cotton fabric. Fiber Polym 6(3):229–234. doi:10.1007/BF02875647
- Poongodi GR, Sukumar N, Subramnaiam V, Radhalakshmi YC (2019) Effects of alkali treatment and strain hardening on the mechanical, dye uptake, and structural properties of regenerated cellulosic yarns. J Nat Fibers 18(1):122–135. doi:10.1080/15440478.2019.1612809
- Pransilp P, Pruettiphap M, Bhanthumnavin W, Paosawatyanyong B, Kiatkamjornwong S (2016) Surface modification of cotton fabrics by gas plasmas for color strength and adhesion by inkjet ink printing. Appl Surf Sci 364:208–220. doi:10.1016/j.apsusc.2015.12.102
- Qi Y, Xie R, Yu A, Bukhari MN, Zhang L, Cao C, Peng H, Fang K, Chen W (2020) Effect of ethylene glycol and its derivatives on the aggregation properties of reactive Orange 13 dye aqueous solution. RSC Adv 10(57):34373–34380. doi:10.1039/d0ra06330d
- Qin H, Fang K, Ren Y, Zhang K, Zhang L, Zhang X (2020) Insights into influences of dye hydrophobicity on cleanliness and resolution of fabric ink-jet printing. ACS Sustain Chem Eng 8(46):17291–17298. doi:10.1021/acssuschemeng.0c06447
- Remadevi R, Rajkhowa R, Crowle G, Wang X, Zhu H, Gordon S (2018) Effect of aqueous glycine treatment on the fine structure and dyeing ability of cotton. Carbohyd Polym 202:365–371. doi:10.1016/j.carbpol.2018.08.057
- Rioboo R, Marengo M, Tropea C (2002) Time evolution of liquid drop impact onto solid, dry surfaces. Exp Fluids 33(1):112–124. doi:10.1007/s00348-002-0431-x
- Sarko A (2021) Advances in solid state structural studies of celluloses – a brief review. https://www.researchgate.net/publication/266448909
- Schwanninger M, Rodrigues JC, Pereira H, Hinterstoisser B (2004) Effects of short-time vibratory ball milling on the shape of FT-IR spectra of wood and cellulose. Vib Spectrosc 36(1):23–40. doi:10.1016/j.vibspec.2004.02.003
- Sebe G, Ham-Pichavant F, Ibarboure E, Koffi AL, Tingaut P (2012) Supramolecular structure characterization of cellulose II nanowhiskers produced by acid hydrolysis of cellulose I substrates. Biomacromol 13(2):570–578. doi:10.1021/bm201777j
- Shi F, Liu Q, Zhao H, Fang k, Xie R, Song L, Wang M, Chen W (2021) Eco-friendly pretreatment to the coloration enhancement of reactive dye digital inkjet printing on wool fabrics. ACS Sustain Chem Eng 9(30):10361–10369. doi:10.1021/acssuschemeng.1c03486
- Song Y, Fang K, Bukhari MN, Ren Y, Zhang K, Tang Z (2020) Green and efficient inkjet printing of cotton fabrics using reactive dye@copolymer nanospheres. ACS Appl Mater Interfaces 12(40):45281–45295. doi:10.1021/acsami.0c12899
- Song Y, Fang K, Bukhari MN, Zhang K, Tang Z (2021) Improved inkjet printability of dye-based inks through enhancing the interaction of dye molecules and polymer nanospheres. J Mol Liq 324:114702. doi:10.1016/j.molliq.2020.114702
- Song Y, Fang K, Ren Y, Tang Z, Wang R, Chen W, Xie R, Shi Z, Hao L (2018) Inkjet printable and self-curable disperse dyes/P(st-ba-maa) nanosphere inks for both hydrophilic and hydrophobic fabrics. Polymers 10 (12). doi:10.3390/polym10121402
- Tang Z, Fang K, Bukhari MN, Song Y, Zhang K (2020) Effects of viscosity and surface tension of a reactive dye ink on droplet formation. Langmuir 36(32):9481–9488. doi:10.1021/acs.langmuir.0c01392
- Tang Z, Fang K, Song Y, Sun F (2019) Jetting performance of polyethylene glycol and reactive dye solutions. Polymers 11 (4). doi:10.3390/polym11040739
- Tarbuk A, Grancaric AM, Leskovac M (2014) Novel cotton cellulose by cationisation during the mercerisation process—part 1: chemical and morphological changes. Cellulose 21(3):2167–2179. doi:10.1007/s10570-014-0245-z
- Uzun S, Schelling M, Hantanasirisakul K, Mathis TS, Askeland R, Dion G, Gogotsi Y (2020) Additive-free aqueous mxene inks for thermal inkjet printing on textiles. Small 17(1):2006376. doi:10.1002/smll.202006376
- Wakida T, Kida K, Lee M, Bae S, Yoshioka H, Yanai Y (2000) Dyeing and mechanical properties of cotton fabrics treated with sodium hydroxide/liquid ammonia and liquid ammonia/sodium hydroxide. Text Res J 70(4):328–332. doi:10.1177/004051750007000408
- Wang C, Zhang S, Wu S, Cao Z, Zhang Y, Li H, Jiang F, Lyu J (2018) Study on an alternative approach for the preparation of wood vinegar from the hydrothermolysis process of cotton stalk. Bioresour Technol 254:231–238. doi:10.1016/j.biortech.2018.01.088
- Wang H, Kong H, Zheng J, Peng H, Cao C, Qi Y, Fang K, Chen W (2020) Systematically exploring molecular aggregation and its impact on surface tension and viscosity in high concentration solutions. Molecules 25 (7). doi:10.3390/molecules25071588
- Wang R, Fang K, Ren Y, Song Y, Zhang K, Bukhari MN (2019) Jetting performance of two lactam compounds in reactive dye solution. J Mol Liq 294:111668. doi:10.1016/j.molliq.2019.111668
- Wijshoff H (2018) Drop dynamics in the inkjet printing process. Curr Opin Colloid In 36:20–27. doi:10.1016/j.cocis.2017.11.004
- Wu Z, Fang K, Chen W, Zhao Y, Xu Y, Zhang C (2021) Durable superhydrophobic and photocatalytic cotton modified by PDMS with TiO2 supported bamboo charcoal nanocomposites. Ind Crop Prod 171:113896. doi:10.1016/j.indcrop.2021.113896
- Xie R, Fan J, Fang K, Chen W, Song Y, Pan Y, Li Y, Liu J (2022) Hierarchical Bi2MoO6 microsphere photocatalysts modified with polypyrrole conjugated polymer for efficient decontamination of organic pollutants. Chemosphere 286:131541. doi:10.1016/j.chemosphere.2021.131541
- Xie R, Fang K, Liu Y, Chen W, Fan J, Wang X, Ren Y, Song Y (2020) Z-scheme In2O3/WO3 heterogeneous photocatalysts with enhanced visible-light-driven photocatalytic activity toward degradation of organic dyes. J Mater Sci 55(26):11919–11937. doi:10.1007/s10853-020-04863-5
- Yang H, Fang K, Liu X, An F (2019) High-Quality Images Inkjetted on Different Woven Cotton Fabrics Cationized with P(St-BA-VBT) Copolymer Nanospheres. ACS Appl Mater Interfaces 11(32):29218–29230. doi:10.1021/acsami.9b07848
- Zhang K, Fang K, Bukhari MN, Xie R, Song Y, Tang Z, Zhang X (2020a) The effect of ink drop spreading and coalescing on the image quality of printed cotton fabric. Cellulose 27(16):9725–9736. doi:10.1007/s10570-020-03446-6
- Zhang K, Xie R, Fang K, Chen W, Shi Z, Ren Y (2019) Effects of reactive dye structures on surface tensions and viscosities of dye solutions. J Mol Liq 287:110932. doi:10.1016/j.molliq.2019.110932
- Zhang L, Huang C, Zhang C, Pan H (2021) Swelling and dissolution of cellulose in binary systems of three ionic liquids and three co-solvents. Cellulose 28(8):4643–4653. doi:10.1007/s10570-021-03844-4
- Zhang X, Fang K, Zhou H, Zhang K, Bukhari MN (2020b) Enhancing inkjet image quality through controlling the interaction of complex dye and diol molecules. J Mol Liq 312:113481. doi:10.1016/j.molliq.2020.113481
- Zhang Z, Wang H, Sun J, Guo K (2020c) Cotton fabrics modified with Si@ hyperbranched poly(amidoamine): their salt-free dyeing properties and thermal behaviors. Cellulose 28(1):565–579. doi:10.1007/s10570-020-03540-9
- Zhao Y, Fang K, Chen W, Wu Z, Xu Y, Zhang C (2021) Fabrication of a wearable directional moisture-transfer cotton by clean technology of wet plasma, without fluoride consumption. Ind Crop Prod 172:113995. doi:10.1016/j.indcrop.2021.113995
- Zhong T, Dhandapani R, Liang D, Wang J, Wolcott MP, Van Fossen D, Liu H (2020) Nanocellulose from recycled indigo-dyed denim fabric and its application in composite films. Carbohydr Polym 240:116283. doi:10.1016/j.carbpol.2020.116283
- Zhou Y, Yu J, Biswas TT, Tang R-C, Nierstrasz V (2018) Inkjet Printing of Curcumin-Based Ink for Coloration and Bioactivation of Polyamide, Silk, and Wool Fabrics. ACS Sustain Chem Eng 7(2):2073–2082. doi:10.1021/acssuschemeng.8b04650
- Zhu C, Tada H, Shi J, Yan J, Morikawa H (2019) Water transport on interlaced yarns. Text Res J 89(23–24):5198–5208. doi:10.1177/0040517519853794
- supportinfomation.docx
Supporting Information: Some data and pictures help to explain the experimental phenomenon.
- Graphicalabstract.png
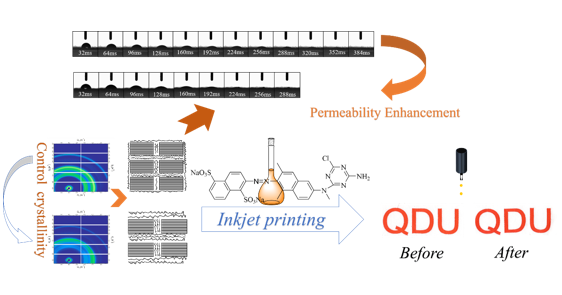
Graphical abstract