Nanomaterials characterization
In Fig. 1a it is shown the X-ray diffraction pattern of the Ti_50 and Ti_400 samples, which presents characteristic diffraction peaks for both anatase and brookite TiO2 crystalline phases.
The nanoparticles show peaks at 25.34° (111), 37.94° (004), 47.94° (200), 54.40° (105)/(211), 62.90° (204), and 68,67° (116) assigned to anatase phase according to JCPDS 21-1272. Further, a low amount of the brookite phase is identified by the presence of the diffraction peaks at 30.68° (121), 40.22° (022), 42.46° (221), 46.00° (032), and 60.00° (123), in agreement with the JCPDS sheet 29-1360 (Di Paola et al. 2008; Mehraz et al. 2019). Moreover, the broad diffraction peaks indicate a very small size crystallite, which can be estimated by the Scherrer equation. Considering the diffraction peak at 25.34° ascribed to the anatase phase it is calculated average crystallite size of 8.39 nm (Zhao et al. 2007; Mehraz et al. 2019).
Table 1
– Crystallographic parameters of Ti_400 sample.
|
Crystallographic phase
|
2θ (degree)#
|
d (Å)*
|
Intensity (counts)
|
Observed ratio
|
Expected ratio
|
|
Anatase
|
25.34
|
3.5119
|
1341
|
100
|
100
|
|
Brookite
|
30.68
|
2.9117
|
115
|
9
|
90
|
|
Anatase
|
37.94
|
2.3696
|
366
|
27
|
20
|
|
Brookite
|
40.22
|
2.2403
|
55
|
4
|
18
|
|
Brookite
|
42.46
|
2.1272
|
35
|
3
|
16
|
|
Brookite
|
46.00
|
1.9714
|
93
|
7
|
16
|
|
Anatase
|
47.94
|
1.8960
|
476
|
35
|
35
|
|
Anatase
|
54.40
|
1.6852
|
405
|
30
|
20
|
|
Brookite
|
60.00
|
1.5406
|
46
|
3
|
7
|
|
Anatase
|
62.90
|
1.4763
|
229
|
17
|
14
|
|
Anatase
|
68.67
|
1.3657
|
101
|
8
|
6
|
| # 2θ = Angle of the diffraction peak; * d = Distance between atomic planes, |
It is worth remembering that the Scherrer equation is an approximation and not an accurate method for estimating the size of crystalline nanoparticles (Kibasomba et al. 2018). However, this estimation suggests a nanometric nature of the materials, indicating an important characteristic of semiconductors applied in heterogeneous photocatalysis (Moreira et al. 2020a). As the main purpose of the paper is to monitor the ATZ photolysis and photocatalysis using the chemometric approach for investigating degradation mechanism, the use of transmission electron microscopy to measure the nanoparticle size was dismissed. Figure 1b shows the Tauc plot and the bandgap energy calculated for the Ti_400 sample, which is in agreement with the anatase crystalline phase observed in the X-ray diffractograms. The Ti_400 presents an indirect bandgap of 3.18 eV, which is expected for anatase TiO2 and is in accordance with the literature (Beranek 2011; Tripathi et al. 2013). Numerous studies show that TiO2 anatase is photoactive and widely used in studies of heterogeneous photocatalysis (Fang et al. 2017; Moreira et al. 2020a). Also, its nanometric nature and bandgap close to 3.18 eV are two important properties for the application of TiO2 as a photocatalyst (Di Paola et al. 2008). Thus, the synthesis method applied in this study proved to be efficient to achieve these characteristics of TiO2 after a short synthesis time (20 min) followed by heat treatment at 400 ºC for 2h. Therefore, this material (Ti_400) was applied in the photocatalytic degradation studies of ATZ to investigate the influence of the heterogeneous process in the degradation mechanism using UV-Vis spectrophotometry aided by chemometrics.
Photolytic degradation of ATZ
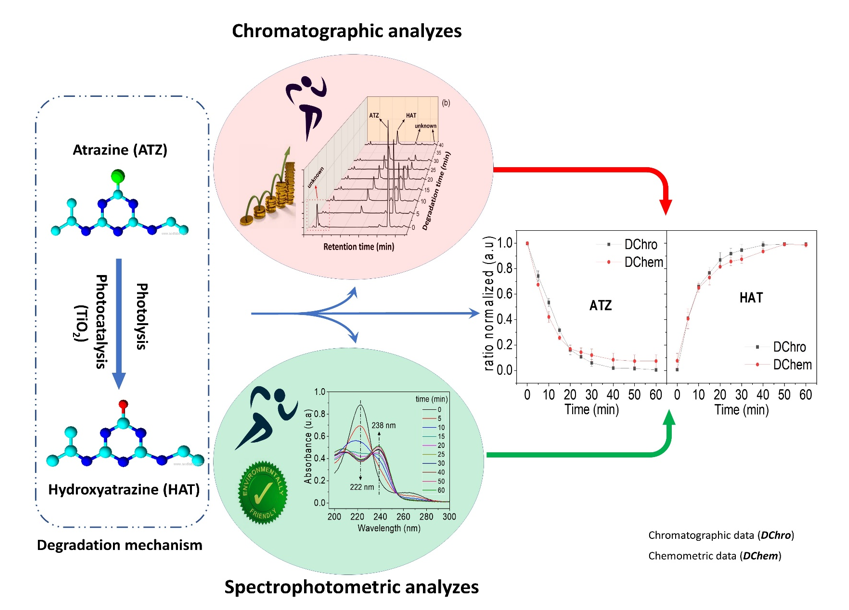
Figure 2 showed the molecular absorption spectra (Fig. 2a) and the chromatographic profiles (Fig. 2b) obtained at different time intervals from the ATZ photolytic degradation under UV irradiation.
The peak centered at 222 nm (Fig. 2a), which can be attributed to ATZ, exhibited a decreasing absorbance as the irradiation time increased, reaching its lowest value at about 0.4 u.a. In contrast, the peak centered at 238 nm, which can be attributed to HAT, exhibited an increase in absorbance, confirming the conversion of ATZ to HAT during the photochemical step (Moreira et al. 2016). Corroborating with the molecular absorption results, the chromatograms (Fig. 2b) show the HAT formation as a result of ATZ degradation. However, while DChro indicated 95% ATZ removal in 30 min, DSpec indicated only 57% removal at the same time interval. Also, at the maximum irradiation time (60 min), ATZ removal remained at 57% according to DSpec, in disagreement with the 99 % ATZ removal shown by DChro. It is also worth mentioning that the results of the chromatographic analysis do not show the formation of other by-products monitored in this study [DEAT, DIAT, DEHAT, and DIHAT (Fig. S1)]. Thus, both the amount and the identity of the compounds that participate in the photolytic degradation process are corresponding by the two analytical techniques used.
The first-order kinetic model (Eq. 1) that considers the variation in ATZ concentration as a function of degradation time was used to calculate the kinetic constant (k) and its linear correlation coefficient (R2) (Samsudin et al. 2015).
\(\text{ln}\left(\frac{{ATZ}_{final}}{{ATZ}_{initial}}\right)= -kt\) Eq. 1
The k and R2 mean values for ATZ at different concentrations were k = 0.113 ± 0.012 min− 1 / R2 = 0.992 ± 0.001 for DChro and k = 0.021 ± 0.004 min− 1 / R2 = 0.806 ± 0.045 for DSpec, which confirms the inapplicability of DSpec in its conventional use. Here, a difference of 85% was obtained for the kinetic constants, while R2 showed a linear correlation only for DChro. Evidently, these appreciable differences of 38% in the ATZ removal and 85% in the kinetic constant help to understand why chromatography is the most used technique for monitoring the photodegradation of organic compounds when compared to spectrophotometry (Singh et al. 2018). The accuracy of DSpec was significantly impaired due to the spectral interferences between ATZ and HAT present in the same solution. According to Moreira et al. (2017), the molar absorptivity coefficient for some by-products is greater than that of ATZ at 222 nm, which justifies the limitation of the drop in absorbance, as shown in Fig. 2(a). In this sense, to overcome the spectral interferences and improve the DSpec reliability, a chemometric data treatment (DChem) based on MCR-ALS was performed.
MCR-ALS was performed on each matrix obtained from the degradation of the different ATZ concentrations. The execution in each matrix was performed considering that the photodegradation process could be dependent on the ATZ concentration, which could result in a different number of species in each experiment as a result of the MCR-ALS analysis. However, initial SVD analysis showed for each experiment the presence of only two species during the photodegradation process. Figure 3 shows the UV-Vis spectra from ST matrix and the kinetic profiles from C matrix (concentration profiles) obtained by MCR-ALS. Explained variances and lack of fit values are, respectively, 2.00% and 99.96% for 3 mg L− 1 ATZ, 1.75% and 99.97% for 5 mg L− 1 ATZ, and 1.24% and 99.98% for 10 mg L− 1 ATZ. These values indicate that excellent fits were obtained.
The pure spectra obtained from the decomposition of X is compared to the spectra obtained from standard solutions of ATZ and HAT. As can be seen, component 1 obtained from the MCR-ALS analysis has a spectrum very similar to the ATZ spectrum, while component 2 resembles the HAT spectrum. The same number of species and spectra obtained for all ATZ concentrations evaluated show the photodegradation process followed the same pathway despite the change on ATZ concentration, also presenting similar kinect profiles for ATZ consumption and HAT formation. One can see that ATZ concentration decreased to half its initial concentration right before 10 min of UV-light irradiation and continued being reduced until disappearing afterward, in agreement with the results obtained from chromatographic analysis (Fig. 3b). Simultaneously, the kinetic profile corresponding to HAT formation appeared at the beginning of the experiment reaching its maximum value at the end of the time frame of the experiment.
Figure 4 shows the ATZ degradation curves (Fig. 4a) and HAT formation (Fig. 4b) when the DChro, DSpec, and DChem were normalized and compared. It is noted that the graphic profile of the DChem was similar to DChro and significantly improved compared to DSpec. Moreover, the statistical analysis assuming a 95% confidence level (t-test) confirmed that there is no significant difference between the DChro and DChem results for ATZ degradation and HAT formation. However, the comparative data between DChro and DSpec showed a significant difference for the degradation of ATZ and HAT production, reinforcing the inapplicability of DSpec in its conventional use.
DChro and DChem showed an ATZ removal of 83 ± 3% in 20 min, while DSpec showed removal of 53 ± 1% in the same time frame. Also, this removal reached 100 ± 0.2% and 93 ± 5% in 60 min to the DChro and the DChem, respectively, while the DSpec exhibits only 55 ± 3% at the same conditions. Here, the data evaluation in 20 and 60 min is due to the ATZ degradation profile, which was more pronounced up to 20 min. This behavior in the degradation mechanism of emerging contaminants has already been shown in other studies, and the by-products when formed, act as competitors in the degradation process (Moreira et al. 2019). Thus, as HAT was formed, a radiation portion and possible oxidizing agents are consumed by this compound (especially after 20 min), affecting the ATZ removal. Therefore, DChro and DChem were limited to 20 min to calculate the kinetic constant (k) and the linear correlation coefficient (R2) of ATZ degradation. The values found were k = 0.116 ± 0.004 min− 1 / R2 = 0.996 ± 0.005 for DChro and k = 0.093 ± 0.002 min− 1 / R2 = 0.998 ± 0.001 for DChem.
The results show that the difference between the k values is < 20%, while R2 values indicate the good fit of the theoretical model to the experimental data. These results and the similarity between the kinetic profiles verified by the t-test confirm the applicability of MCR-ALS in the treatment of molecular absorption spectra in the study of ATZ photodegradation. To highlight the importance of HAT quantitative monitoring and the applicability of MCR-ALS in providing reliable data, a new hypothesis was tested for the calculation of k in this study. The chromatogram of Fig. 2b and the MCR-ALS data in Fig. 3 confirmed HAT as the major by-product formed during ATZ degradation, corroborating with the literature that points out that HAT is present in the first stage of the ATZ degradation mechanism (Moreira et al. 2017; He et al. 2019a). In this way, it is possible to suggest that ATZ is totally converted to HAT in the first minutes of the reaction, which was limited to 20 min due to the reasons explained above. Thus, while Eq. 2 shows the conversion stoichiometry from ATZ (C8H14ClN5) to HAT (C8H15NO), the set of Eq. 3 to 6 presents the mathematical hypothesis for calculating k.
C8H14ClN5 + H2O + hʋ ◊ C8H15N5O + HCl Eq. 2
Eq. 2 shows that the conversion stoichiometry of ATZ ◊ HAT is 1:1, and therefore the valid equality is
ATZdegraded = HATformed Eq. 3
Thus,
ATZfinal = ATZinitial - ATZdegraded Eq. 4
Replacing Eq. 3 in Eq. 4, we have
ATZfinal = ATZinitial – HATformed Eq. 5
Finally replacing Eq. 5 in Eq. 1, the new hypothesis for calculating k is given by Eq. 6
\(\text{ln}\left(\frac{{ATZ}_{intial} -{ HAT}_{formed}}{{ATZ}_{initial}}\right)= -kt\) Eq. 6
Eq. 6 represents an advance for obtaining k, since, in most of this type of study, by-products such as HAT are totally ignored, as well as their effects on the degradation mechanism. Therefore, the new values of k and R2 using the DSpec, DChro, and DChem data were shown in Table 2.
Table 2
Kinetic constants calculated by the conventional approach (Eq. 1) and by the new proposal (Eq. 6).
|
Data source
|
k (min− 1) and R2 obtained by Eq. 1
|
k (min− 1) and R2 obtained by Eq. 6
|
Difference of k between
Eq. 1 and Eq. 6
|
|
DSpec
|
0.038 / 0.979
|
0.069 / 0.979
|
45 %
|
|
DChro
|
0.116 / 0.996
|
0.099 / 0.995
|
15%
|
|
DChem
|
0.093 / 0.998
|
0.080 / 0.985
|
14%
|
The new values show a significant increase from k to DSpec, evidencing the significant influence that HAT exerts on the ATZ degradation kinetic mechanism and, therefore, HAT cannot be ignored. On the other hand, the k and R2 values found for DChro and DChem show a slight decrease, while the compatibility between these was maintained, as shown by the differences k in the order of 15% and 14%, respectively. Also, this observed decrease in k values for DChro and DChem is justified by the greater capacity that these techniques exhibit in providing quantitative data closer to reality for ATZ and HAT. Especially for HAT, Fig. 2b showed some unknown peaks, which may be the result of the HAT degradation, causing a small deviation to the applicability of Eq. 6. However, it is worth noting that when limiting the data treatment to 20 min, these deviations were not significant, which is confirmed by the good R2 values obtained for DChro and DChem, confirming the reaction stoichiometry is 1: 1. Thus, it is possible to replace the chromatographic approach by the chemometric one with similar efficiency, while k calculated by Eq. 6 provides a most realistic information for unveiling the ATZ degradation kinetic mechanism.
Photocatalytic degradation of ATZ
In addition to photolytic studies, the literature broadly addresses heterogeneous photocatalysis for degradation of atrazine and other emerging contaminants (Chen et al. 2018; Moreira et al. 2018; Paris et al. 2020). Thus, this study was expanded to evaluate the application of MCR-ALS in the analysis of the photocatalytic degradation of ATZ in the presence of TiO2. According to the characterization data (Sect. 3.1), Ti_400 was applied for the photocatalytic degradation of ATZ under UV radiation (254 nm). Figure 5 shows the UV-Vis spectra and the kinetic profiles recovered from MCR-ALS decomposition of the matrices obtained from photocatalytic experiments. Explained variances and lack of fit values are, respectively, 6.94% and 99.52% for 3 mg L− 1 ATZ, 6.84% and 99.53% for 5 mg L− 1 ATZ, and 5.49% and 99.70% for 10 mg L− 1 ATZ. The lack of fit values is higher than those observed for ATZ photolysis, which may be related to the noisier spectra obtained from the photocatalysis experiments caused by a residual amount of TiO2. However, these values still indicate that good fits were obtained.
As observed for ATZ photolysis, SVD analysis showed the occurrence of only two species during ATZ photodegradation with TiO2 and UV radiation, independent of ATZ concentration. The obtained pure spectra (Fig. 5a) can also be attributed to ATZ and HAT. Kinect profiles for ATZ consumption and HAT formation (Fig. 5b, 5c, and 5d) also show a behavior similar to that observed for ATZ photolysis. However, some important differences have been noticed for the experiments related to the degradation of ATZ at 3 mg L− 1 and 5 mg L− 1. In these experiments one can see the concentration of HAT in t = 0 s is not null, indicating a possible conversion of ATZ in HAT by the action of the photocatalyst previously to UV radiation. This initial conversion is proportionally higher in the experiment performed with the 3 mg L− 1 solution, lower with the 5 mg L− 1 solution, and negligible with the 10 mg L− 1 solution. Despite this initial photocatalytical activity, the complete removal of ATZ (maximum HAT formation) is observed in the same time frame as observed for ATZ photolysis. Figure 6 shows the ATZ decay curve and HAT formation after the MCR analysis of the molecular absorption spectra.
Applying Eq. 6 to calculate the k representative of the photocatalytic degradation curve of ATZ (Fig. 6a) showed a k = 0.068 ± 0.008 min− 1 / R2 = 0.943 ± 0.003, considering a first-order reaction mechanism. This result was approximately 15% lower than the constant found for the photolytic step (k = 0.083 ± 0.002 min− 1 / R2 = 0.985 ± 0.001). The literature reports that different factors are responsible for influencing the efficiency of the photocatalytic process, highlighting the initial pH of the reaction medium (Bakar and Ribeiro 2016; Moreira et al. 2020b), the mass of the catalyst (He et al. 2019a), and the efficiency of carrying charge on the surface of the material (Truc et al. 2019; Moreira et al. 2020a). As pointed out earlier, the focus of this study was to show that the MCR is applicable to solve molecular absorption spectra in both photolytic and photocatalytic studies, and, therefore, the optimal conditions of degradation have not been investigated. In addition, the R2 = 0.943 ± 0.003 obtained after the photocatalysis confirmed that the MCR treatment was efficient to achieve a reliable result after the photocatalytic degradation of ATZ.
Corroborating the effective applicability of MCR to solve the photocatalytic degradation of ATZ, Fig. 6b showed the formation profile of HAT for photocatalysis. Thus, the lower formation of HAT in the photocatalytic stage corroborates with the lower degradation of ATZ and, therefore, the MCR was efficient to show the correlation in the degradation mechanism. Therefore, after proving the applicability of MCR to solve ATZ molecular absorption spectra in both the photolytic and photocatalytic processes, other gains were highlighted in this study.
Economic and environmental gains associated with the MCR application.
The applicability of MCR as an analytical tool for monitoring ATZ and HAT after photodegradation was verified in this study. However, the advantages of using this tool have been expanded to highlight its economic and environmental gains compared to chromatographic analysis. The operational parameters of the chemical analyses presented in Sect. 2.2.3 were used to estimate the time required for analysis and the total volume of chemical waste generated (Table 3).
Table 3
– Time required for analysis and total volume of chemical waste generated throughout spectrophotometric or chromatographic analyses in this study.
|
Analytical method
|
Performed analyzes amount
|
Time spent in the analysis *
|
Residue from the analytical process
|
|
Chromatographic
|
130**
|
24 h
|
1.43 L***
|
|
Spectrophotometric
|
60
|
0.33 h
|
-
|
| * Time required for each analysis: Spectrophotometer = 0.33 min; HPLC = 11 min |
| ** 40 analyzes refer to the calibration curve construction. |
| *** Of the total volume of analytical waste, 36% corresponds to acetonitrile. |
Table 3 shows that the analysis time demanded by the spectrophotometric measurements represents only 1.5% of the time demanded by the chromatographic ones to perform the same photodegradation experiment. Moreover, while the chromatographic analysis required a calibration curve, the application of the MCR dispensed this step, without prejudice to the final result. As for chemical waste generation, the spectrophotometric analysis follows by MCR treatment generated only a negligible volume, while a volume of 1.43 L was produced at the end of the chromatographic analysis. In addition, data can be obtained more quickly by using the MCR, which can be considered environmentally friendly.