We analyzed clusters specific marker genes (DEGs) from two perspectives, therefore results were presented in two parts.
1. The establishment of marker gene profiles for the prediction of satellite nodules
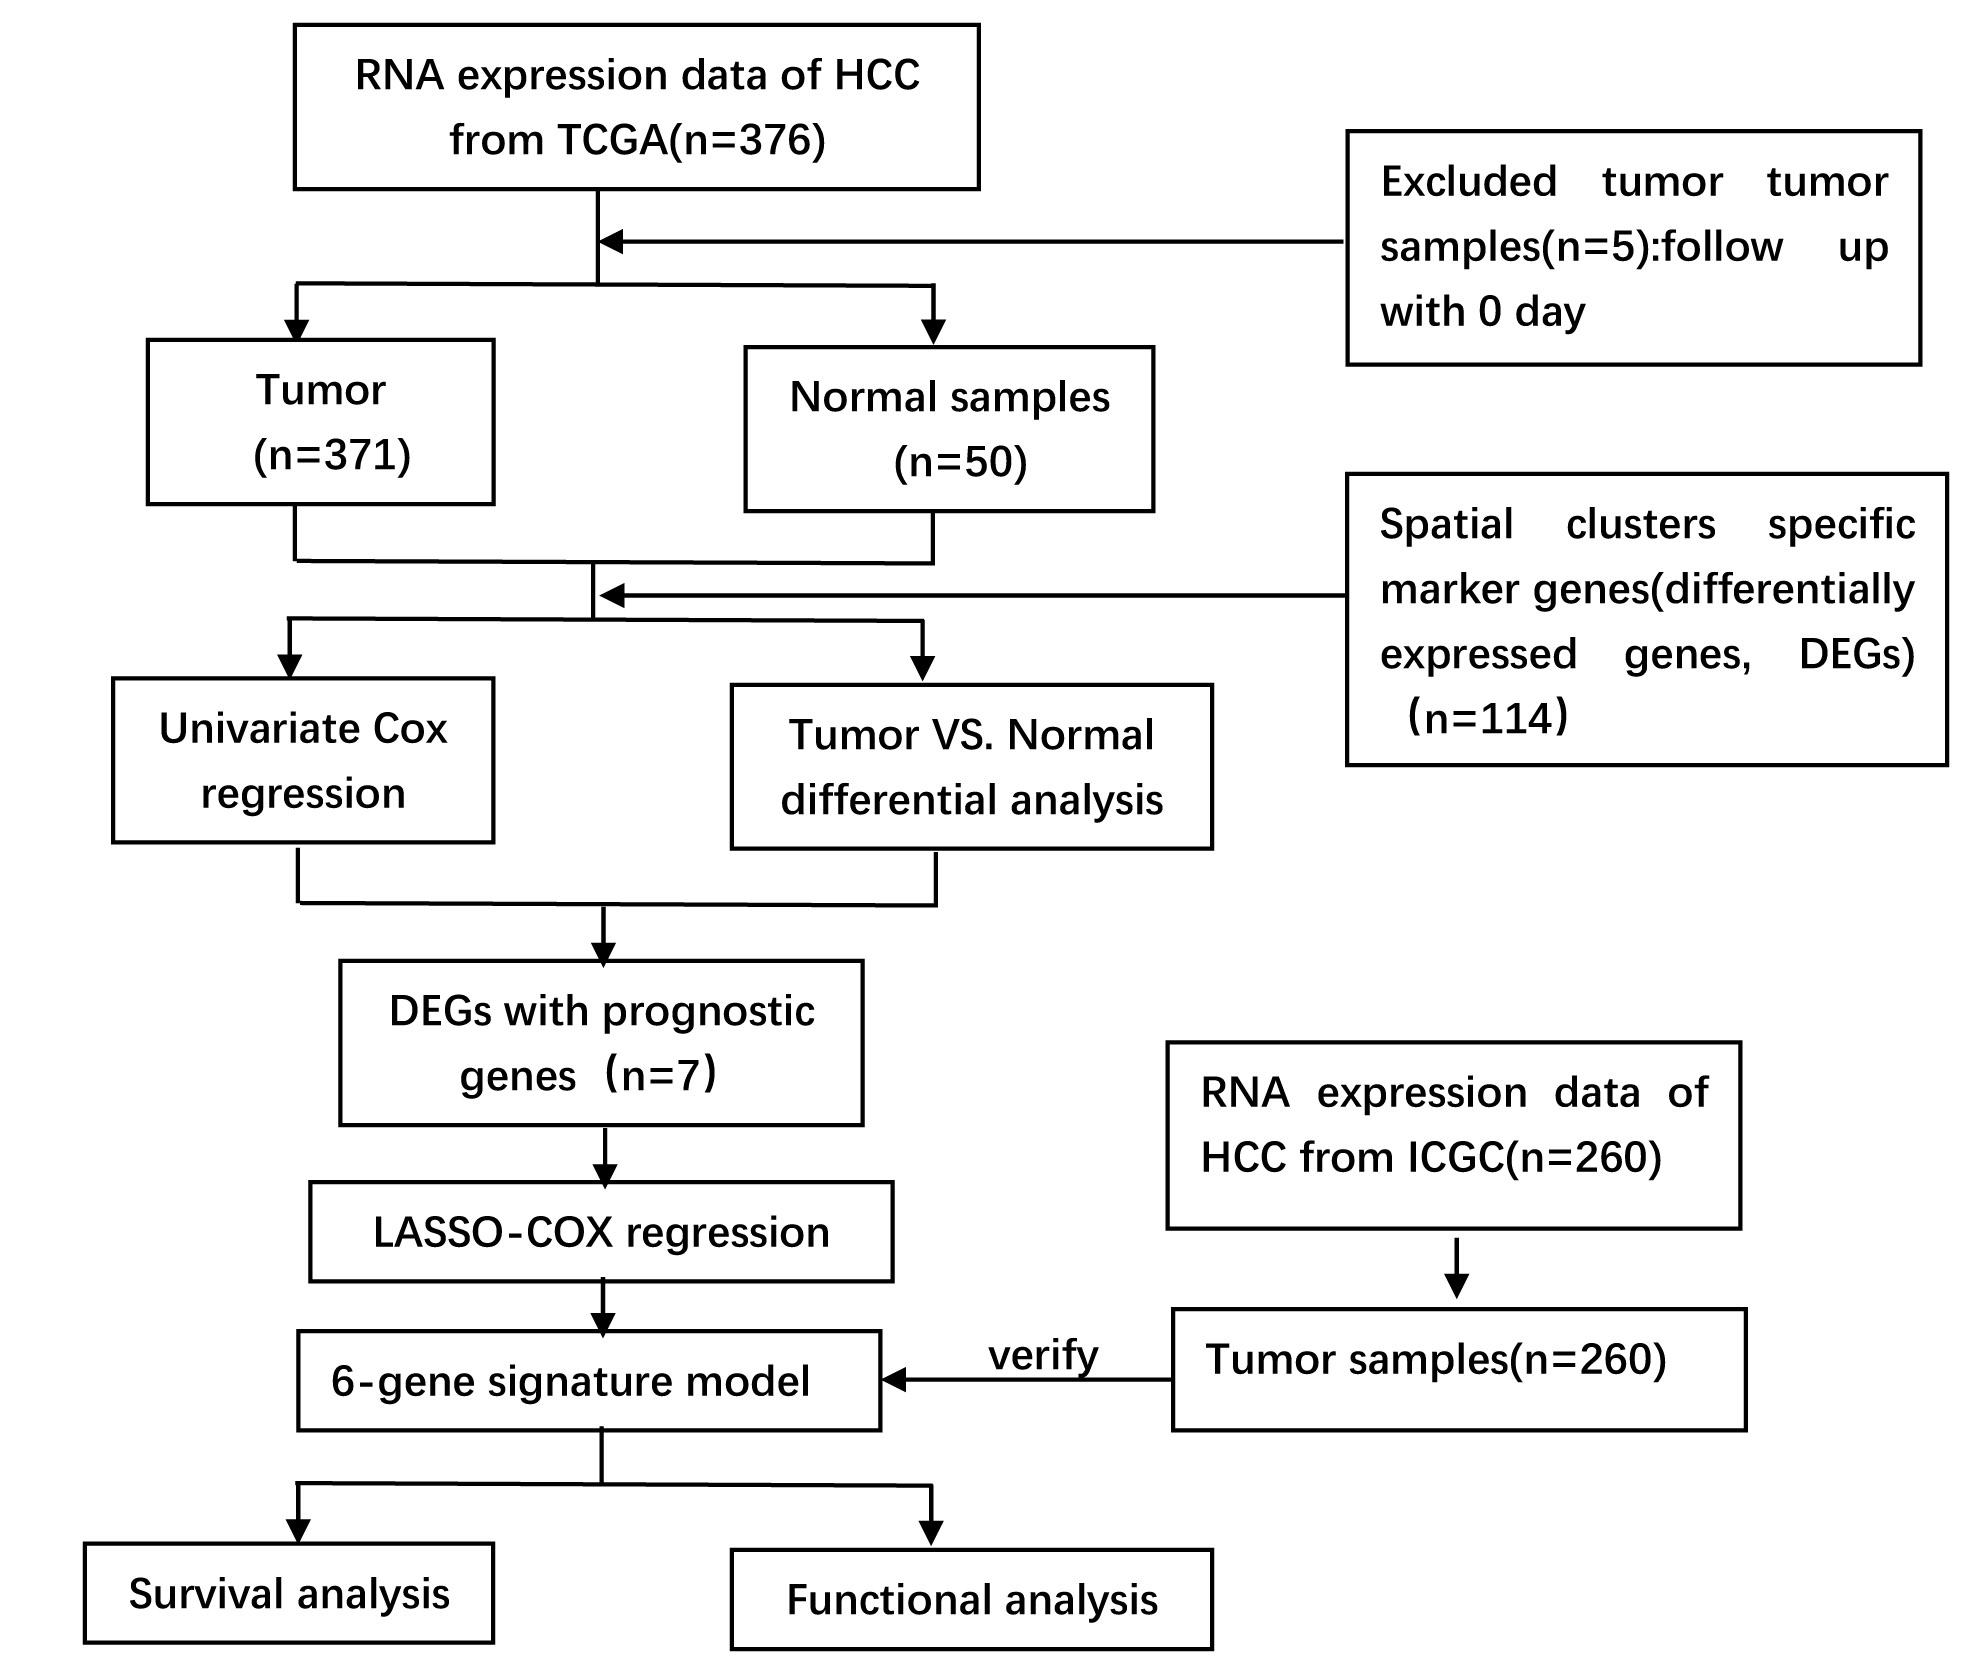
The flow chart of first part is shown in Fig. 1. To spatially analyze the gene expression of each HCC, we analyzed 3 individual patient samples (one with satellite nodules and two without satellite nodules) using the ST methodology. For each specimen, we separated the bulk tumor from the adjacent peritumoral tissue. We performed ST to detect the spatial gene expression between 6 tissue sections. Figure 1 shows the gene number distribution, expression distribution, mitochondrial genes, and hemoglobin gene expression ratio of all the spots. This figure also indicates the spatial gene number distribution and expression distribution in 6 sections. Overall, we analyze 10820 tissue regions within the 6 samples.
1.1 The spatial transcriptome heterogeneity in HCC
We initially analyzed one pair of tissue sections containing a tumor and a peritumoral tissue with satellite nodules. In order to analyze the different components within the cell in HCC, principal component analysis were used to analyze differentially expressed gene among all cells. According to the results of t-SNE and UMAP, all spots of 2 sections were grouped into 4 main clusters (Fig 2 A-C). These clusters show spatial morphological characteristics that closely reflects those of histologically identifiable structures, including tumors, peritumor tissue and stroma. Each cluster had unique differentially expressed genes, indicating intratumoral and intertumoral heterogeneity in HCC (Figure 2D-F).Analysis of these 4 clusters shows that the gene expression between peritumoral tissues are similar, but they are significantly different from the tumors.
Weaker correlation between tumor samples than between peritumoral tissues were observed. It suggested that there’s more pronounced intertumoral heterogeneity (Figure 2E). Thereafter, we performed differential gene expression analysis to identify clusters-specific marker genes and then defined the identity of each cluster (Fig 4F). The gene expression profiles represents the HCC expression phenotype taking tissue origin or the functional respective tissue components into account.
1.2 Spatial Transcriptomics Analysis uncovers changes that could not be detected by single-cell Transcriptomics Analysis
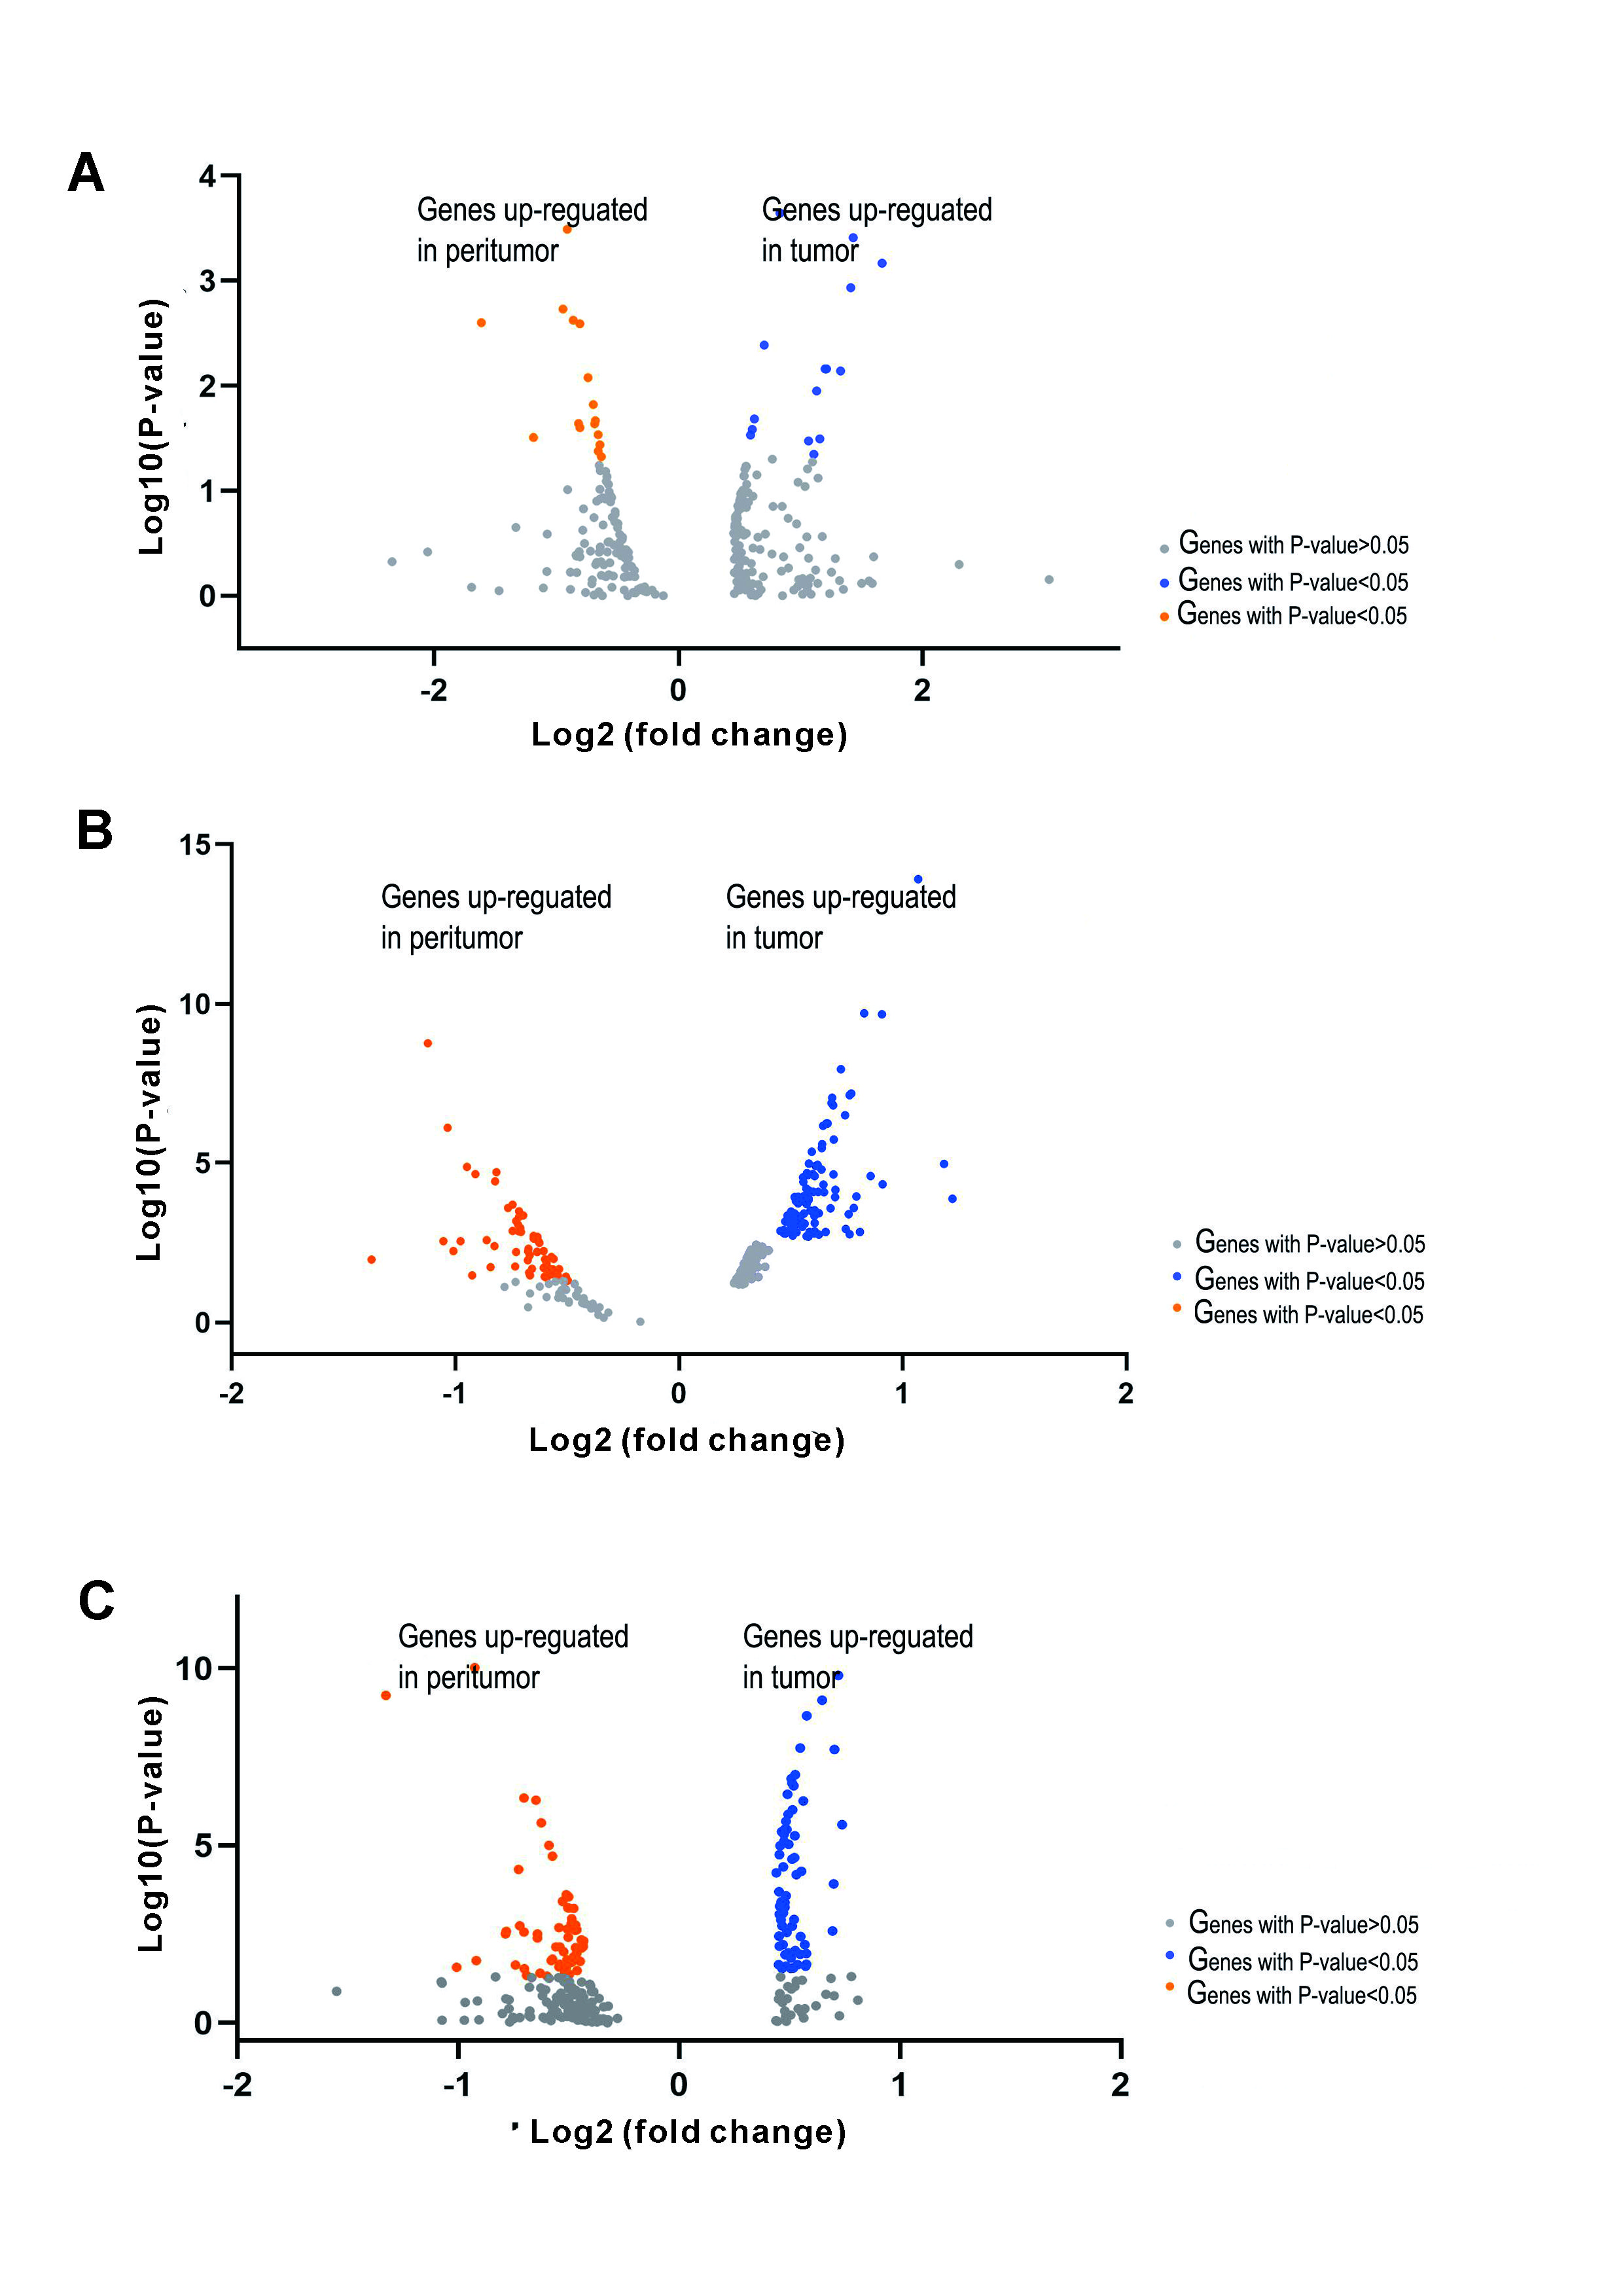
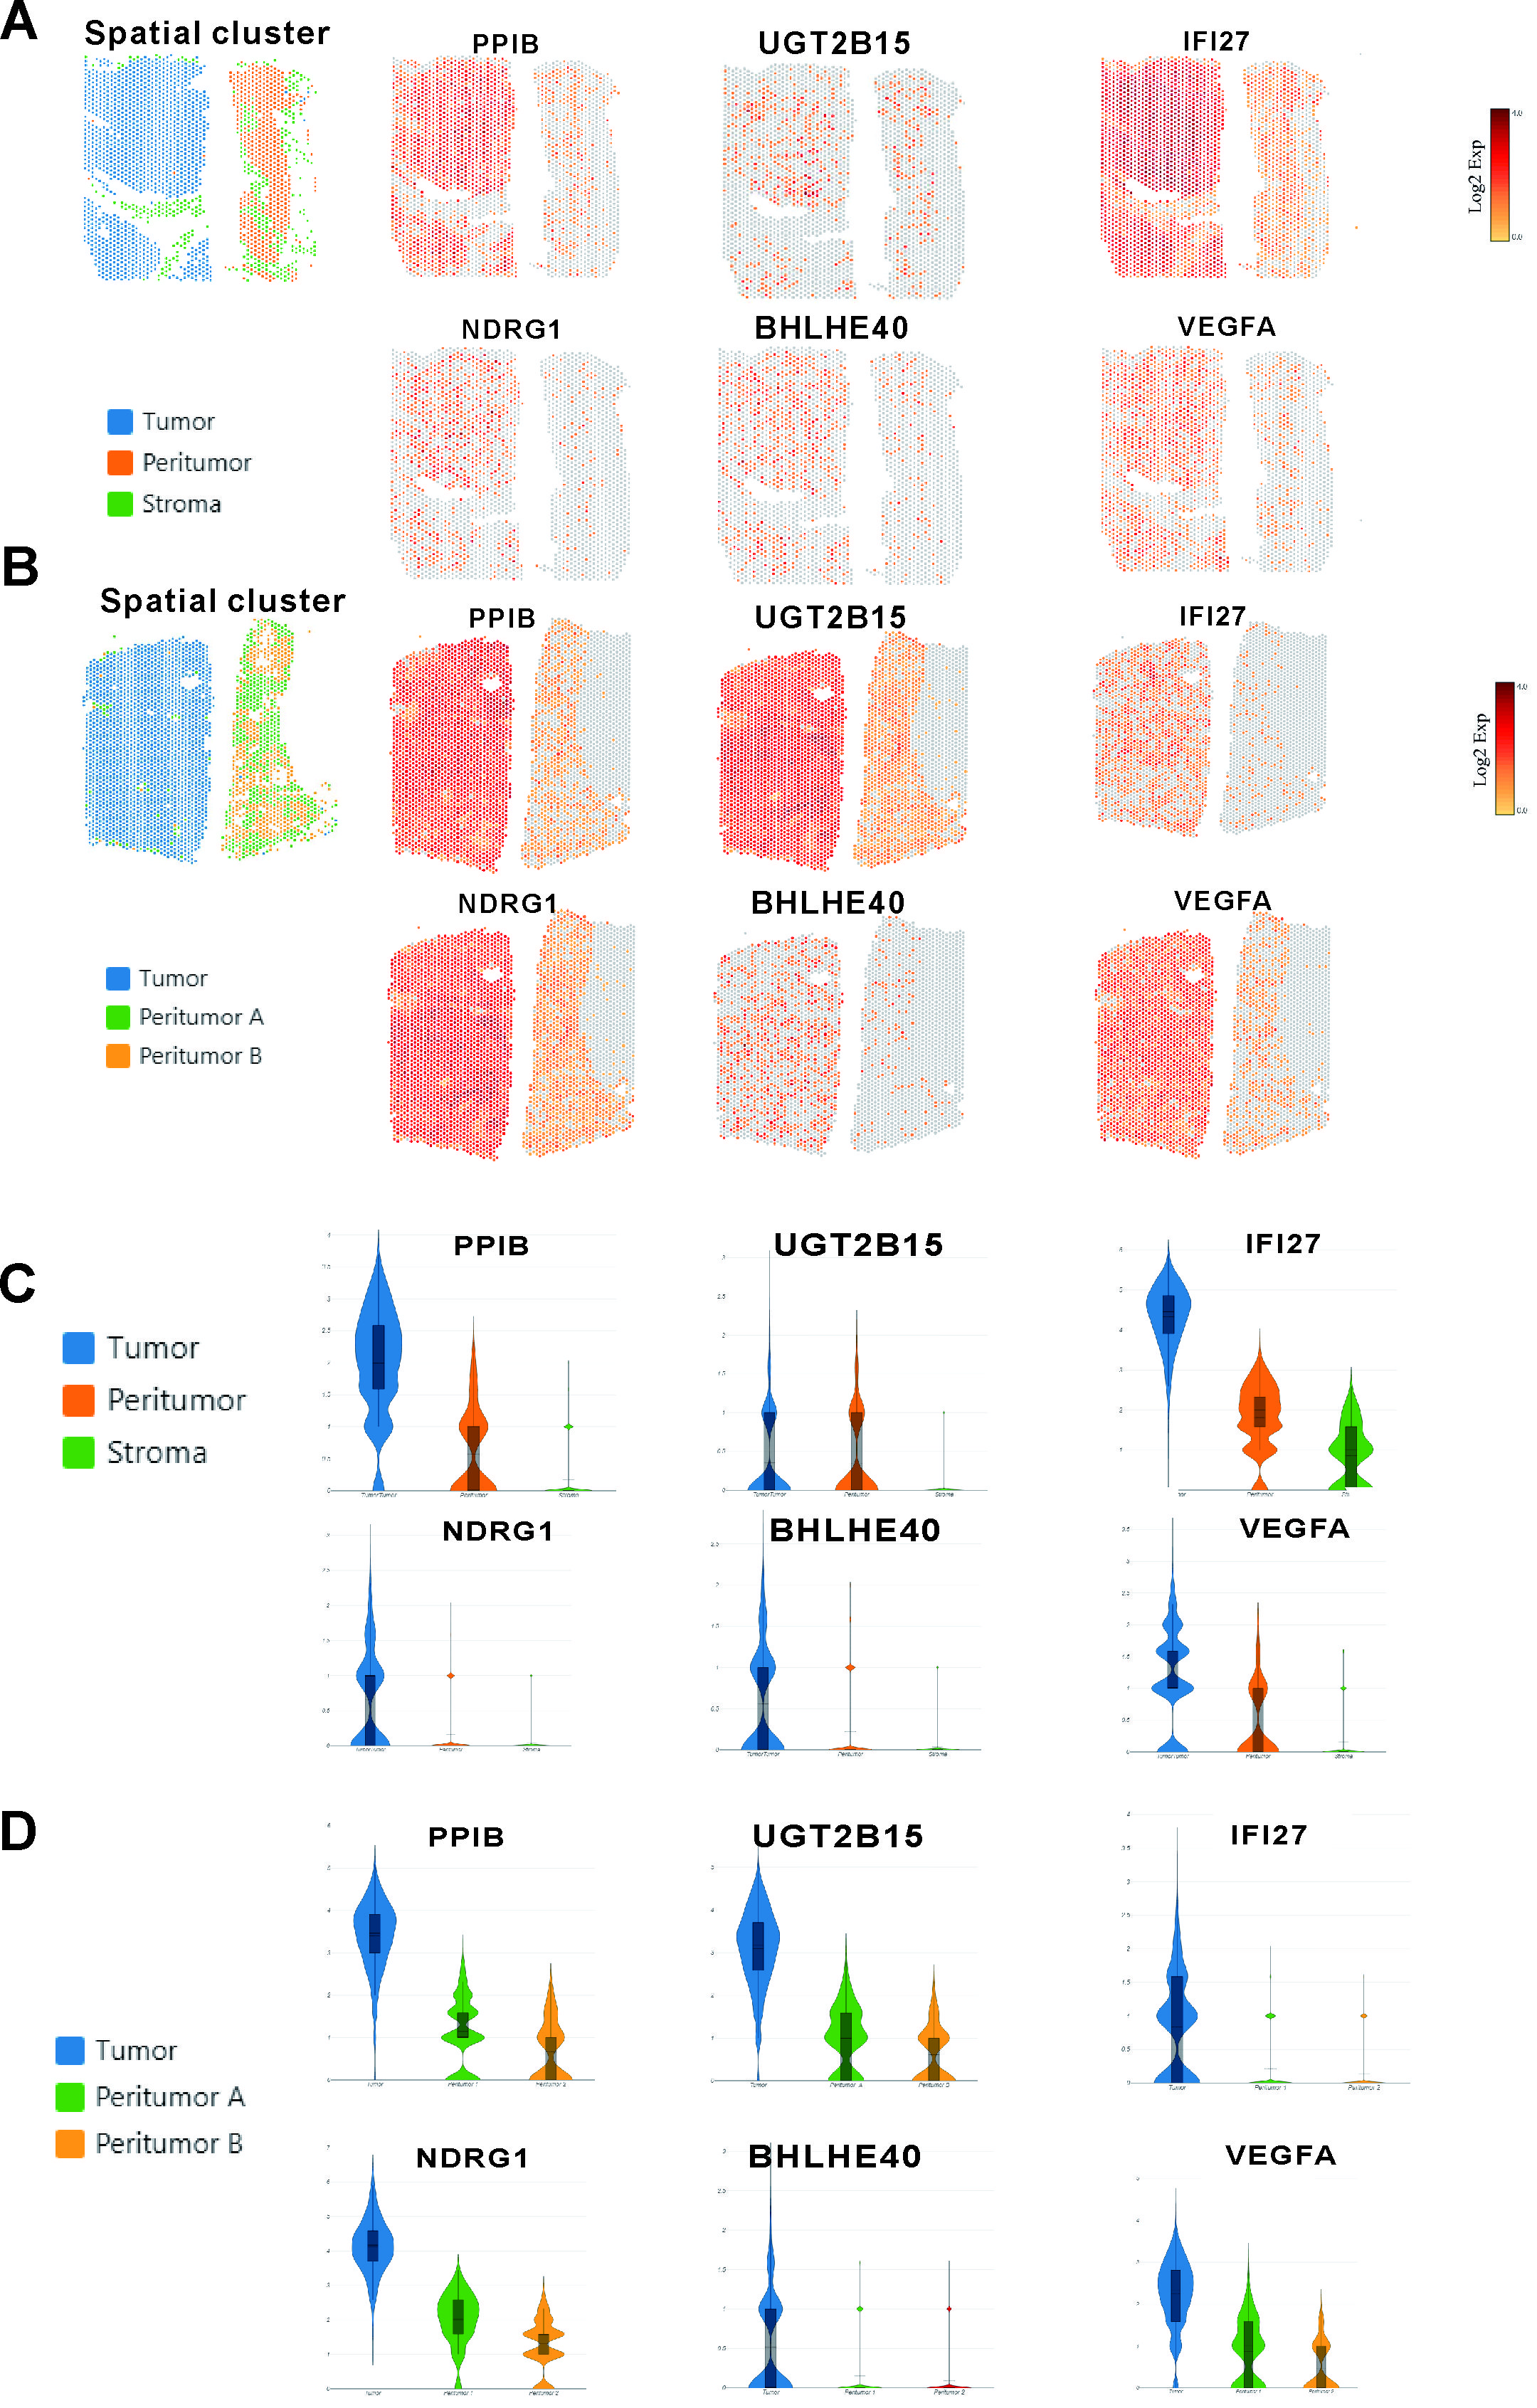
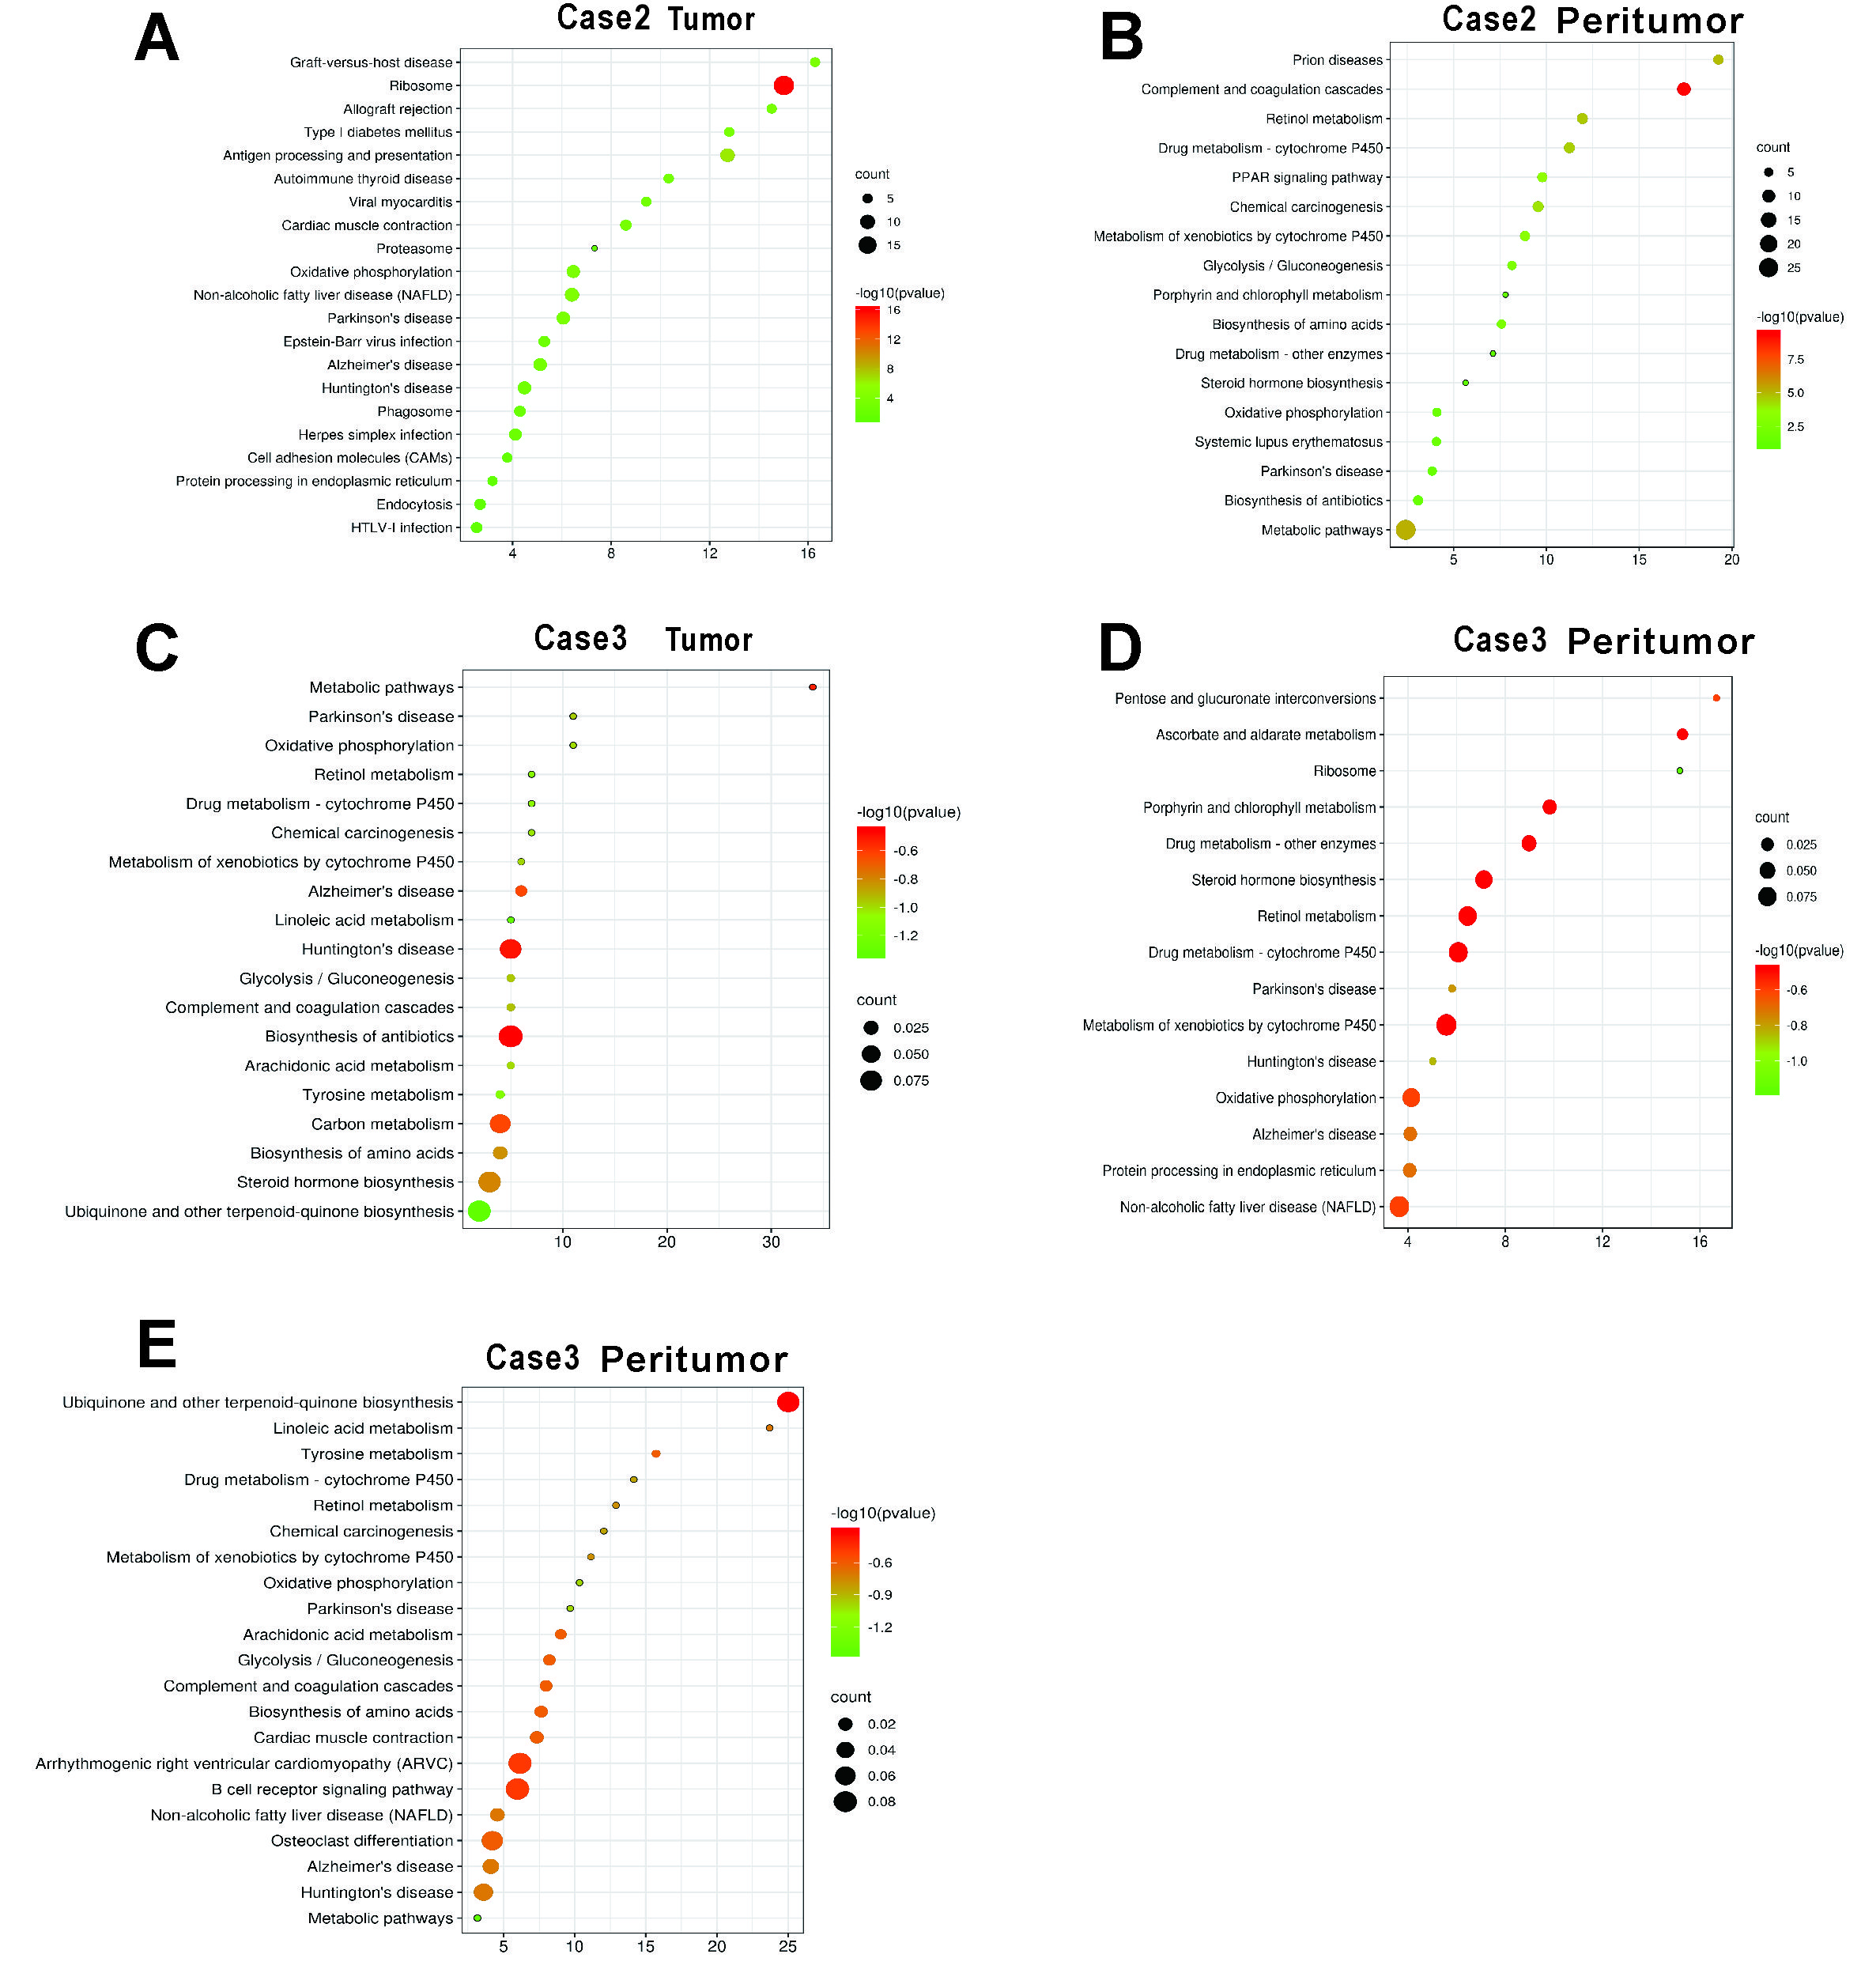
Interestingly, there were two tumor clusters in case 1, which had satellite nodules, while there was only one tumor cluster in the other two cases, which did not have satellite nodules. To understand the possible molecular mechanism of intrahepatic metastases, we sought to investigate functional differences in gene expression between these two tumor clusters in more detail.In tumor cluster A, PPIB, UGT2B15 and IFI27 were among the most highly expressed genes (Fig 3 A and C), and their functions were related to cell survival and apoptosis. In tumor cluster B (Fig 3 B and D), NDRG1, BHLHE40 and VEGFA, all of which have functions related to metastasis and invasion, were among the most highly expressed genes. Besides our gene expression analyze, pathways in two tumor clusters were investigated(Fig 3E). The pathways activated in tumor cluster A are mainly linked to altered cellular metabolism (metabolic pathways, drug metabolism, ascorbate and aldarate metabolism and steroid biosynthesis). Metabolic alteration is a hallmark of cancer[7] and clearly characterizes HCC[8]. A large number of clinical parameters are used to evaluate liver function reflecting changes in both enzyme activity and metabolites. On the other hand, we found that Gene Ontology (GO) categories linked to transcriptional misregulation in cancer and the MAPK signaling pathway to be enriched in tumor cluster B of case 1, possibly reflecting increased cell proliferation and malignancy.
1.3 Spatial expression patterns common to HCC samples
Next, gene expression analyses for another two cases were performed. The resulting gene expression profiles of tumor and nonneoplastic tissues were similar (Supplementary Fig. 1). The gene expression within each region (tumor, peritumor and stroma) obtained from the previous results was used to determine region-specific markers. The expression of some specific genes were observed in the tumor than in nonneoplastic tissues in each case. Specifically, in the tumor region, we observed enrichment of PPIB and UGT2B15 and IFI27, NDRG1, BHLHE40 and VEGFA (Supplementary Fig. 2).
We then investigated more functional differences in pathways between the tumor and the peritumor region(Supplementary Fig.3). Consistent with the pathway analysis in case 1, enrichment analysis indicates that the pathways activated in the tumor (for example, genes involved in chemical carcinogenesis and metabolic pathways) are differentially expressed in comparison to the peritumor.
In a word, the gene profiles obtained from the ST analyses may reflect the different status of the HCC and can manifest intertumoral heterogeneity between patients at the gene expression level.
1.4 The effect of marker gene expression in tumor clusters on HCC patient prognosis
To evaluate the clinical significance of marker genes of tumor clusters, the KM plotter website was used to analyze these gene markers. According to 155 HCC samples in the KM Plotter database, high expression levels of PPIB, UGT2B15, IFI27, NDRG1, BHLHE40 and VEGFA were associated with poor prognosis in HCC (Figure 4).
2. The construct of prognostic Gene Signature for survival
The flow chart of second part is shown in Supplementary Fig. 1 A total of 361 HCC patients from the TCGA-LIHC cohort and 260 HCC patients from the ICGC (LIRI-JP) cohort were finally enrolled. The detailed clinical characteristics of these patients are summarized in Table 1.
2.1 Identifiation of prognostic spatial clusters specific marker genes (DEGs) and construction of a prognostic model in the TCGA cohort
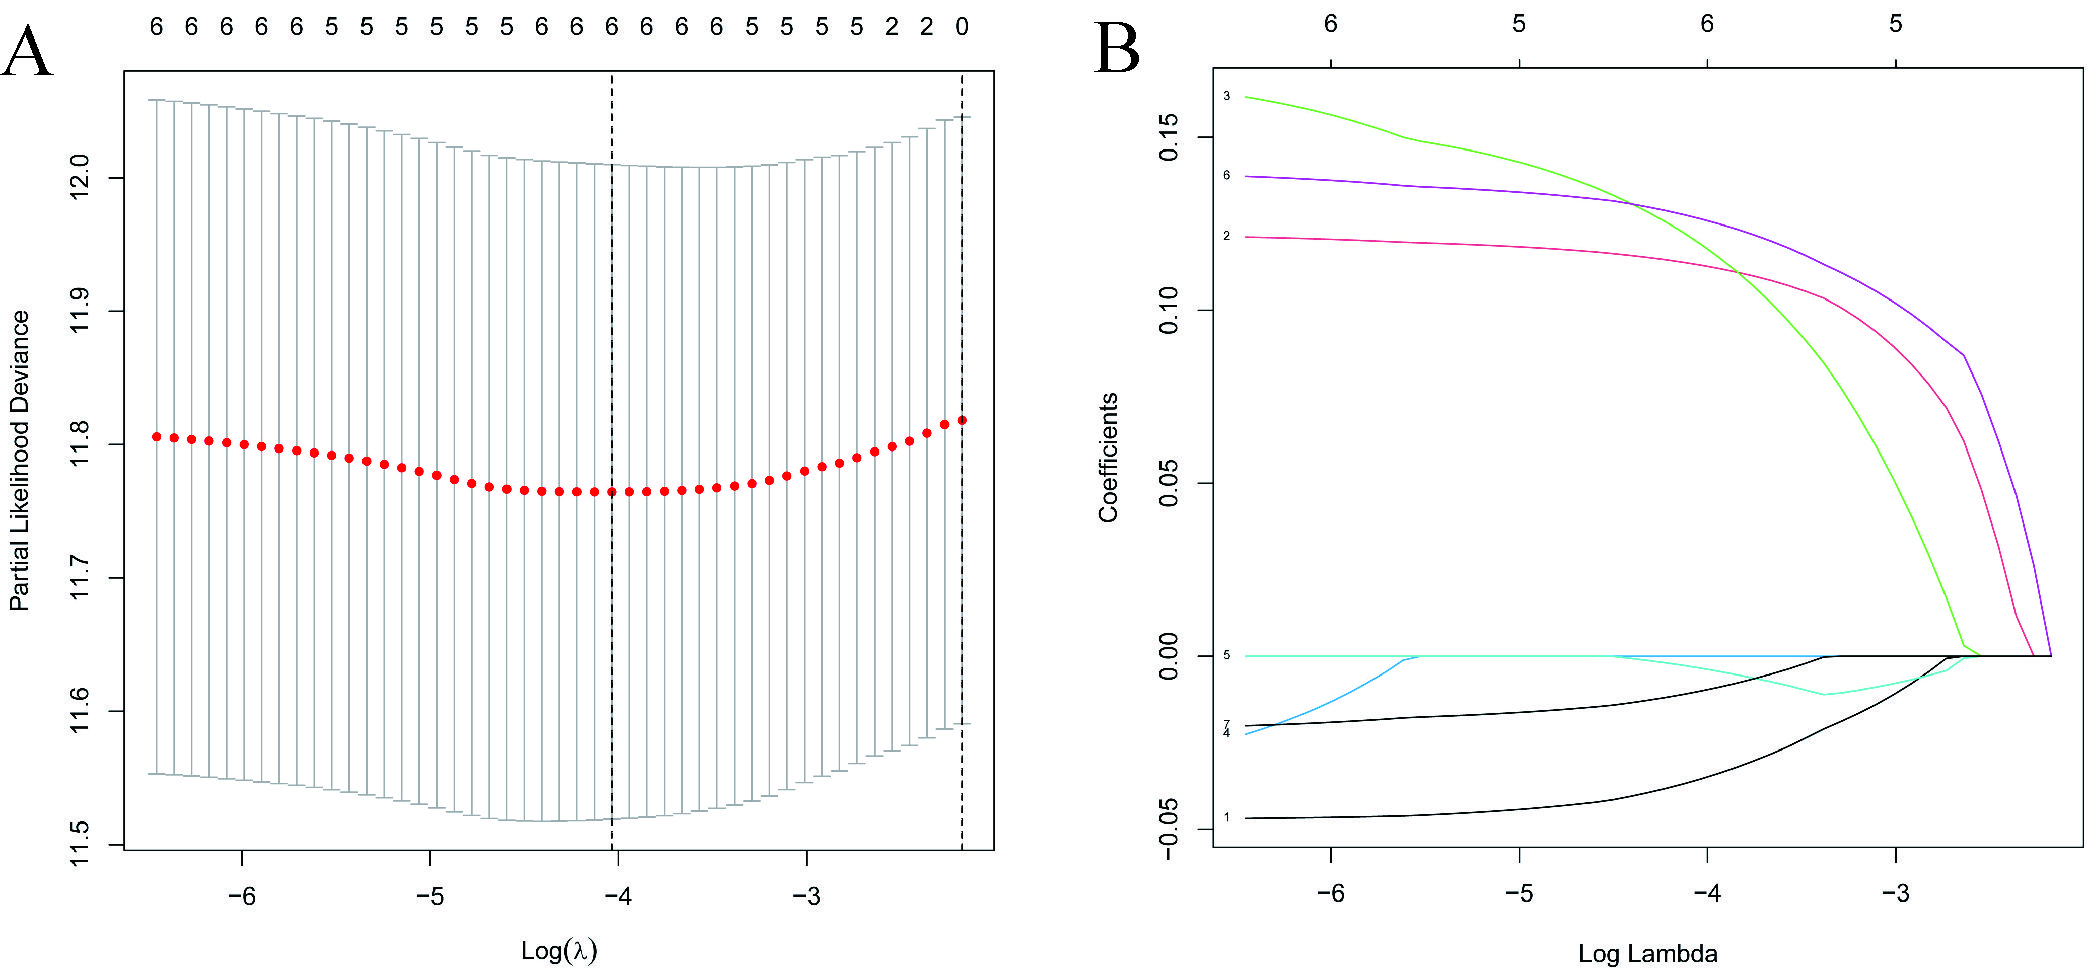
Spatial clusters specific marker genes (DEGs) were differentially expressed in tumor tissues and adjacent non-tumorous tissues, and 7 of them were correlated with OS in the univariate Cox regression analysis (Fig. 5A). The expression profiles of the above 7 genes were analyzed by LASSO-Cox regression analysis, and the prognostic model was established. RPS7 was excluded from this analysis because its lasso coefficient was un available. A 6-gene signature(ADH1A,ADH1B,CYP3A4,FCGBP,PABPC1, NDRG1) was identified based on the optimal value of λ (Supplementary Fig. 5). The risk score was calculated as follows: score = -0.0354*expression level of ADH1A -0.0035*expression level of ADH1B-0.0100*expression level of CYP3A4 + 0.113*expression level of FCGBP+0.119*expression level of PABPC1 +0.126*expression level of NDRG1. Fig 5B showed that the expression of those 6 genes was significant different in HCC tissues and adjacent normal tissues. The risk ratio of NDRG1, one of important markers from tumor cluster B, is 1.309(95% CI=1.147-1.493, P<0.001, Fig.5C). Figure 5D showed the relationship of those 6 genes. The result showed that these 6 spatial clusters specific marker genes can be used as prognostic indicators. Based on the median cut-off value, we divided the patients into a high-risk group (n=182) or a low-risk group (n=183) a (Fig. 6A). We found that the higher risk group was correlated with higher tumor grade (Table 2). We can see that patients with low risk were less likely to die earlier than those with high risk from the scatter chart (Figure 6B). We can see that patients were distributed in the two subgroups according to they are in high or low risk group through PCA analysis and t-SNE analysis (Figures 6E–F). On the other hand, the survival analysis showed that the patients with low risk had a better OS than those with high-risk within 5 years(Figure I, P<0.05). Time-dependent ROC curves were performed for displaying sensitivity and specificity of survival prognostic model, and the area under the curve (AUC) reached 0.700 at 1 year, 0.647 at 2 years, and 0.606 at 3 years (Figure 6J).
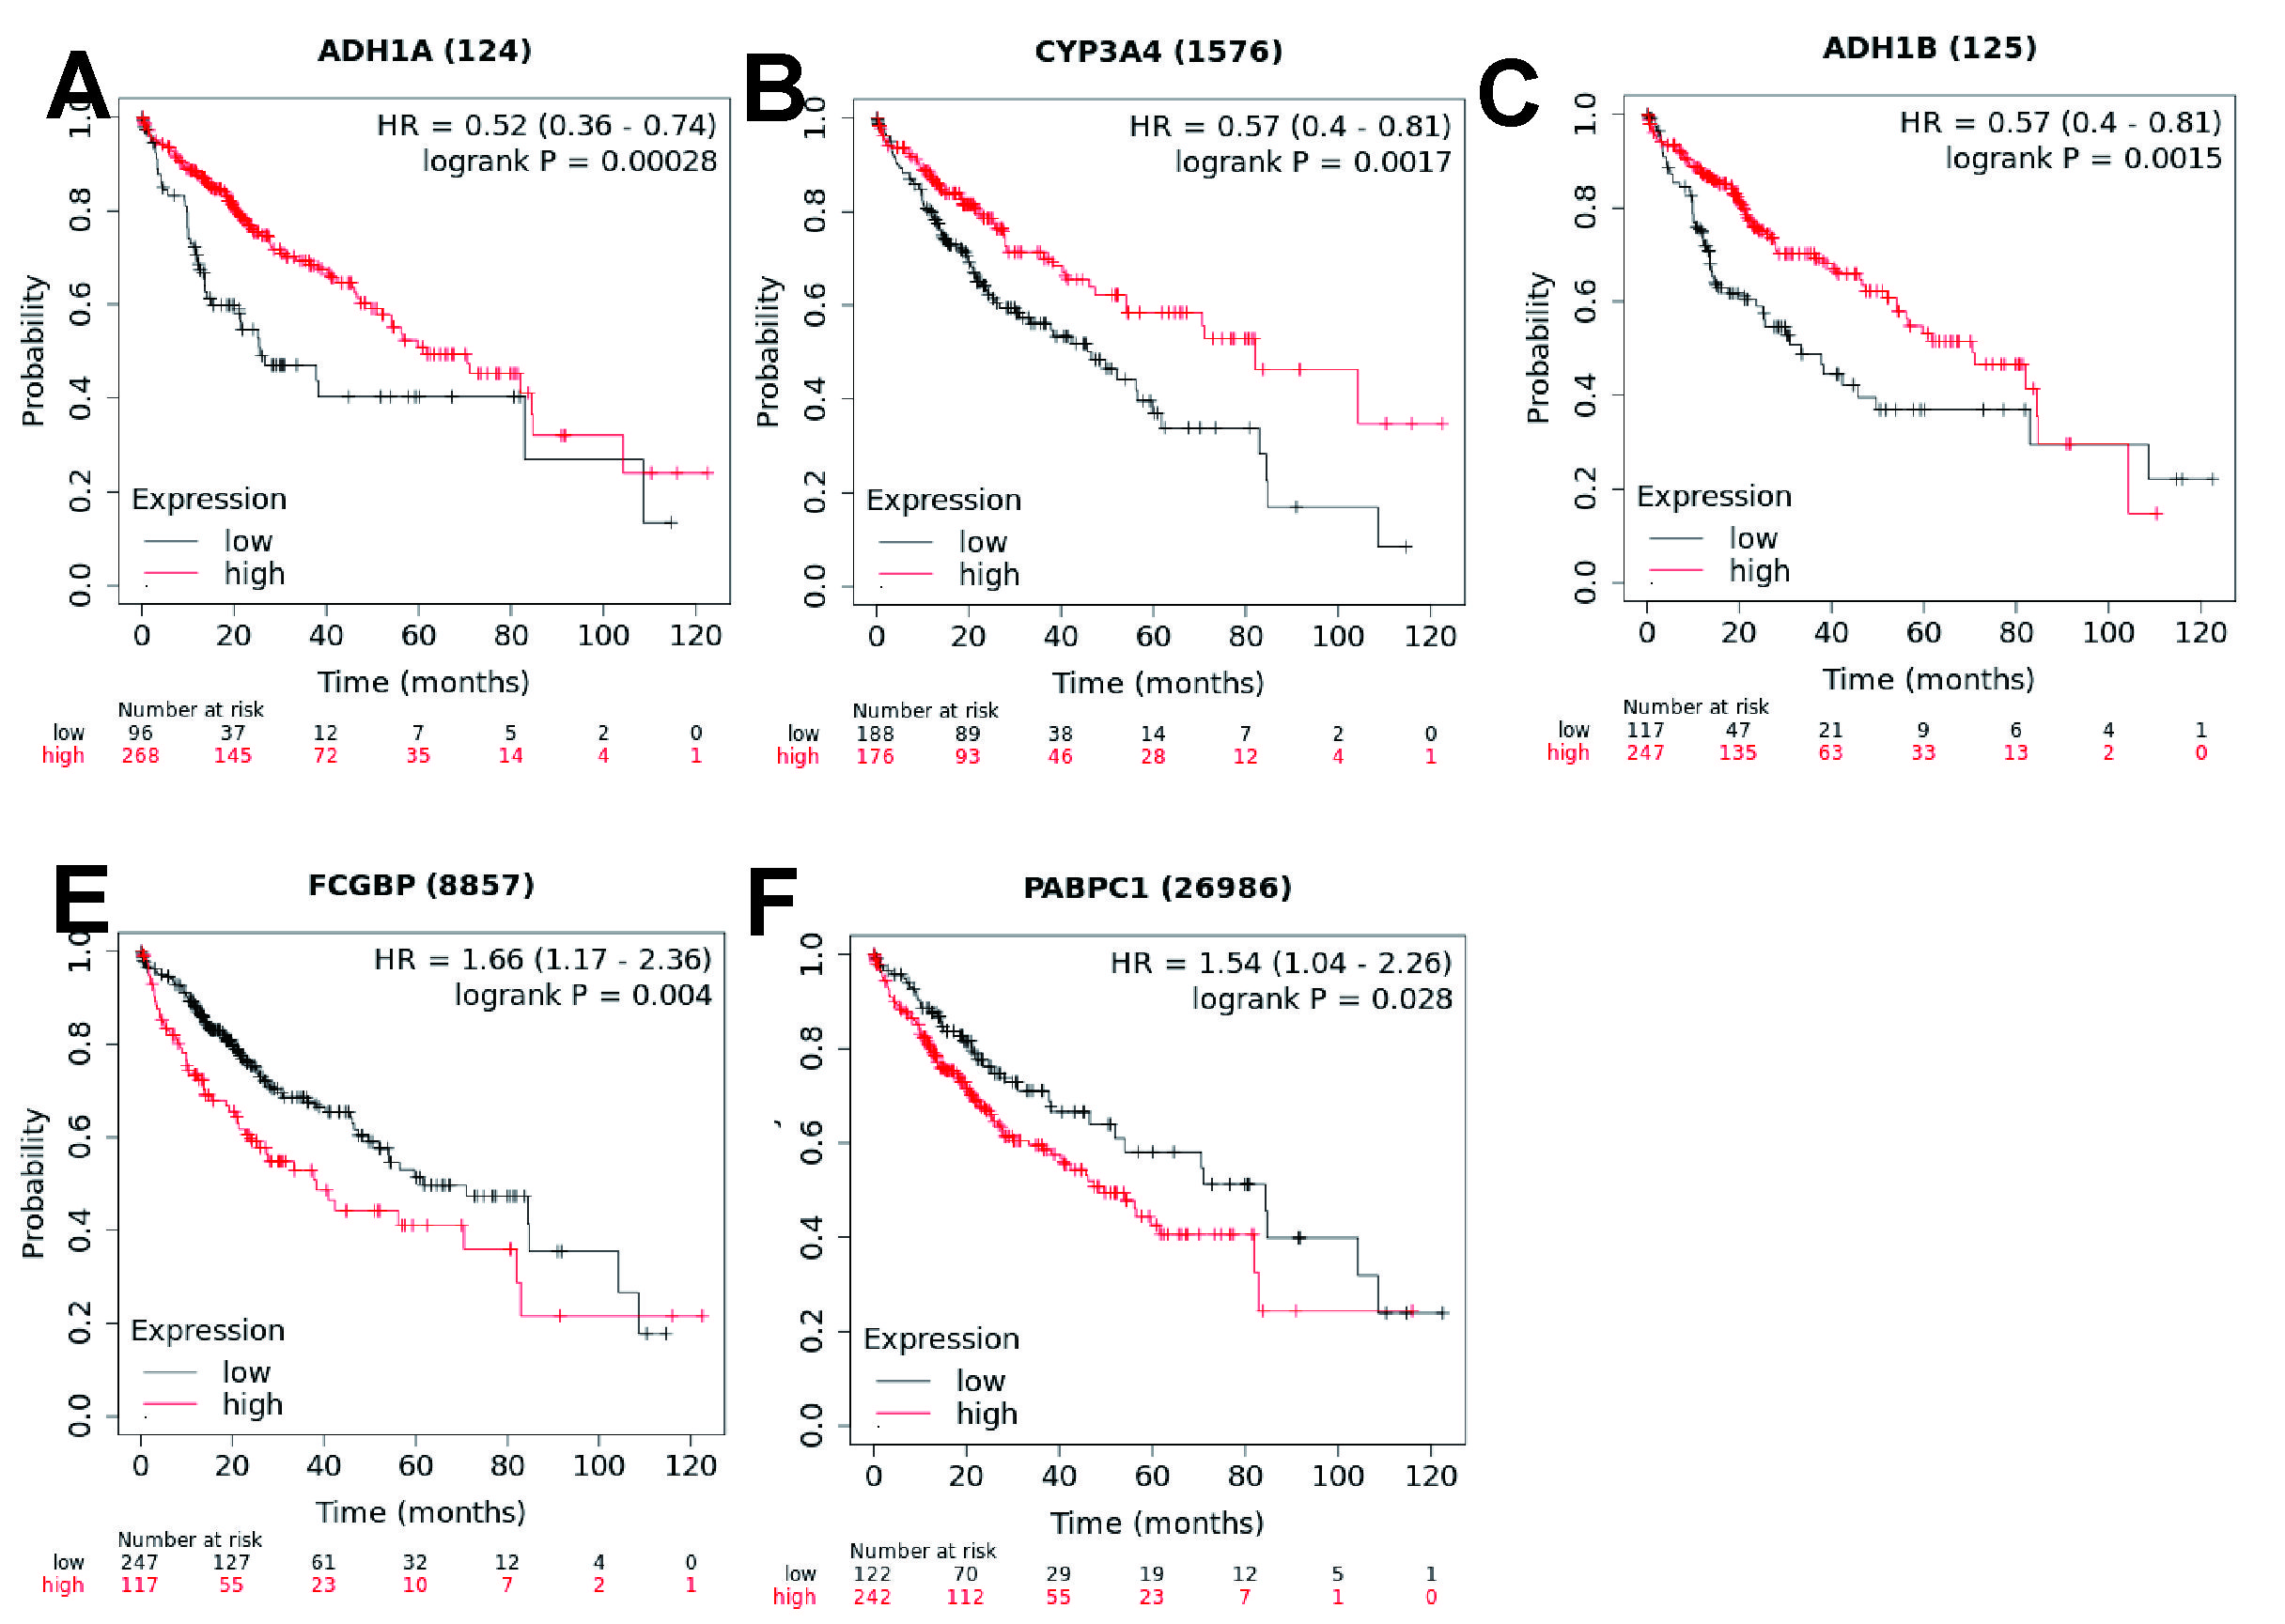
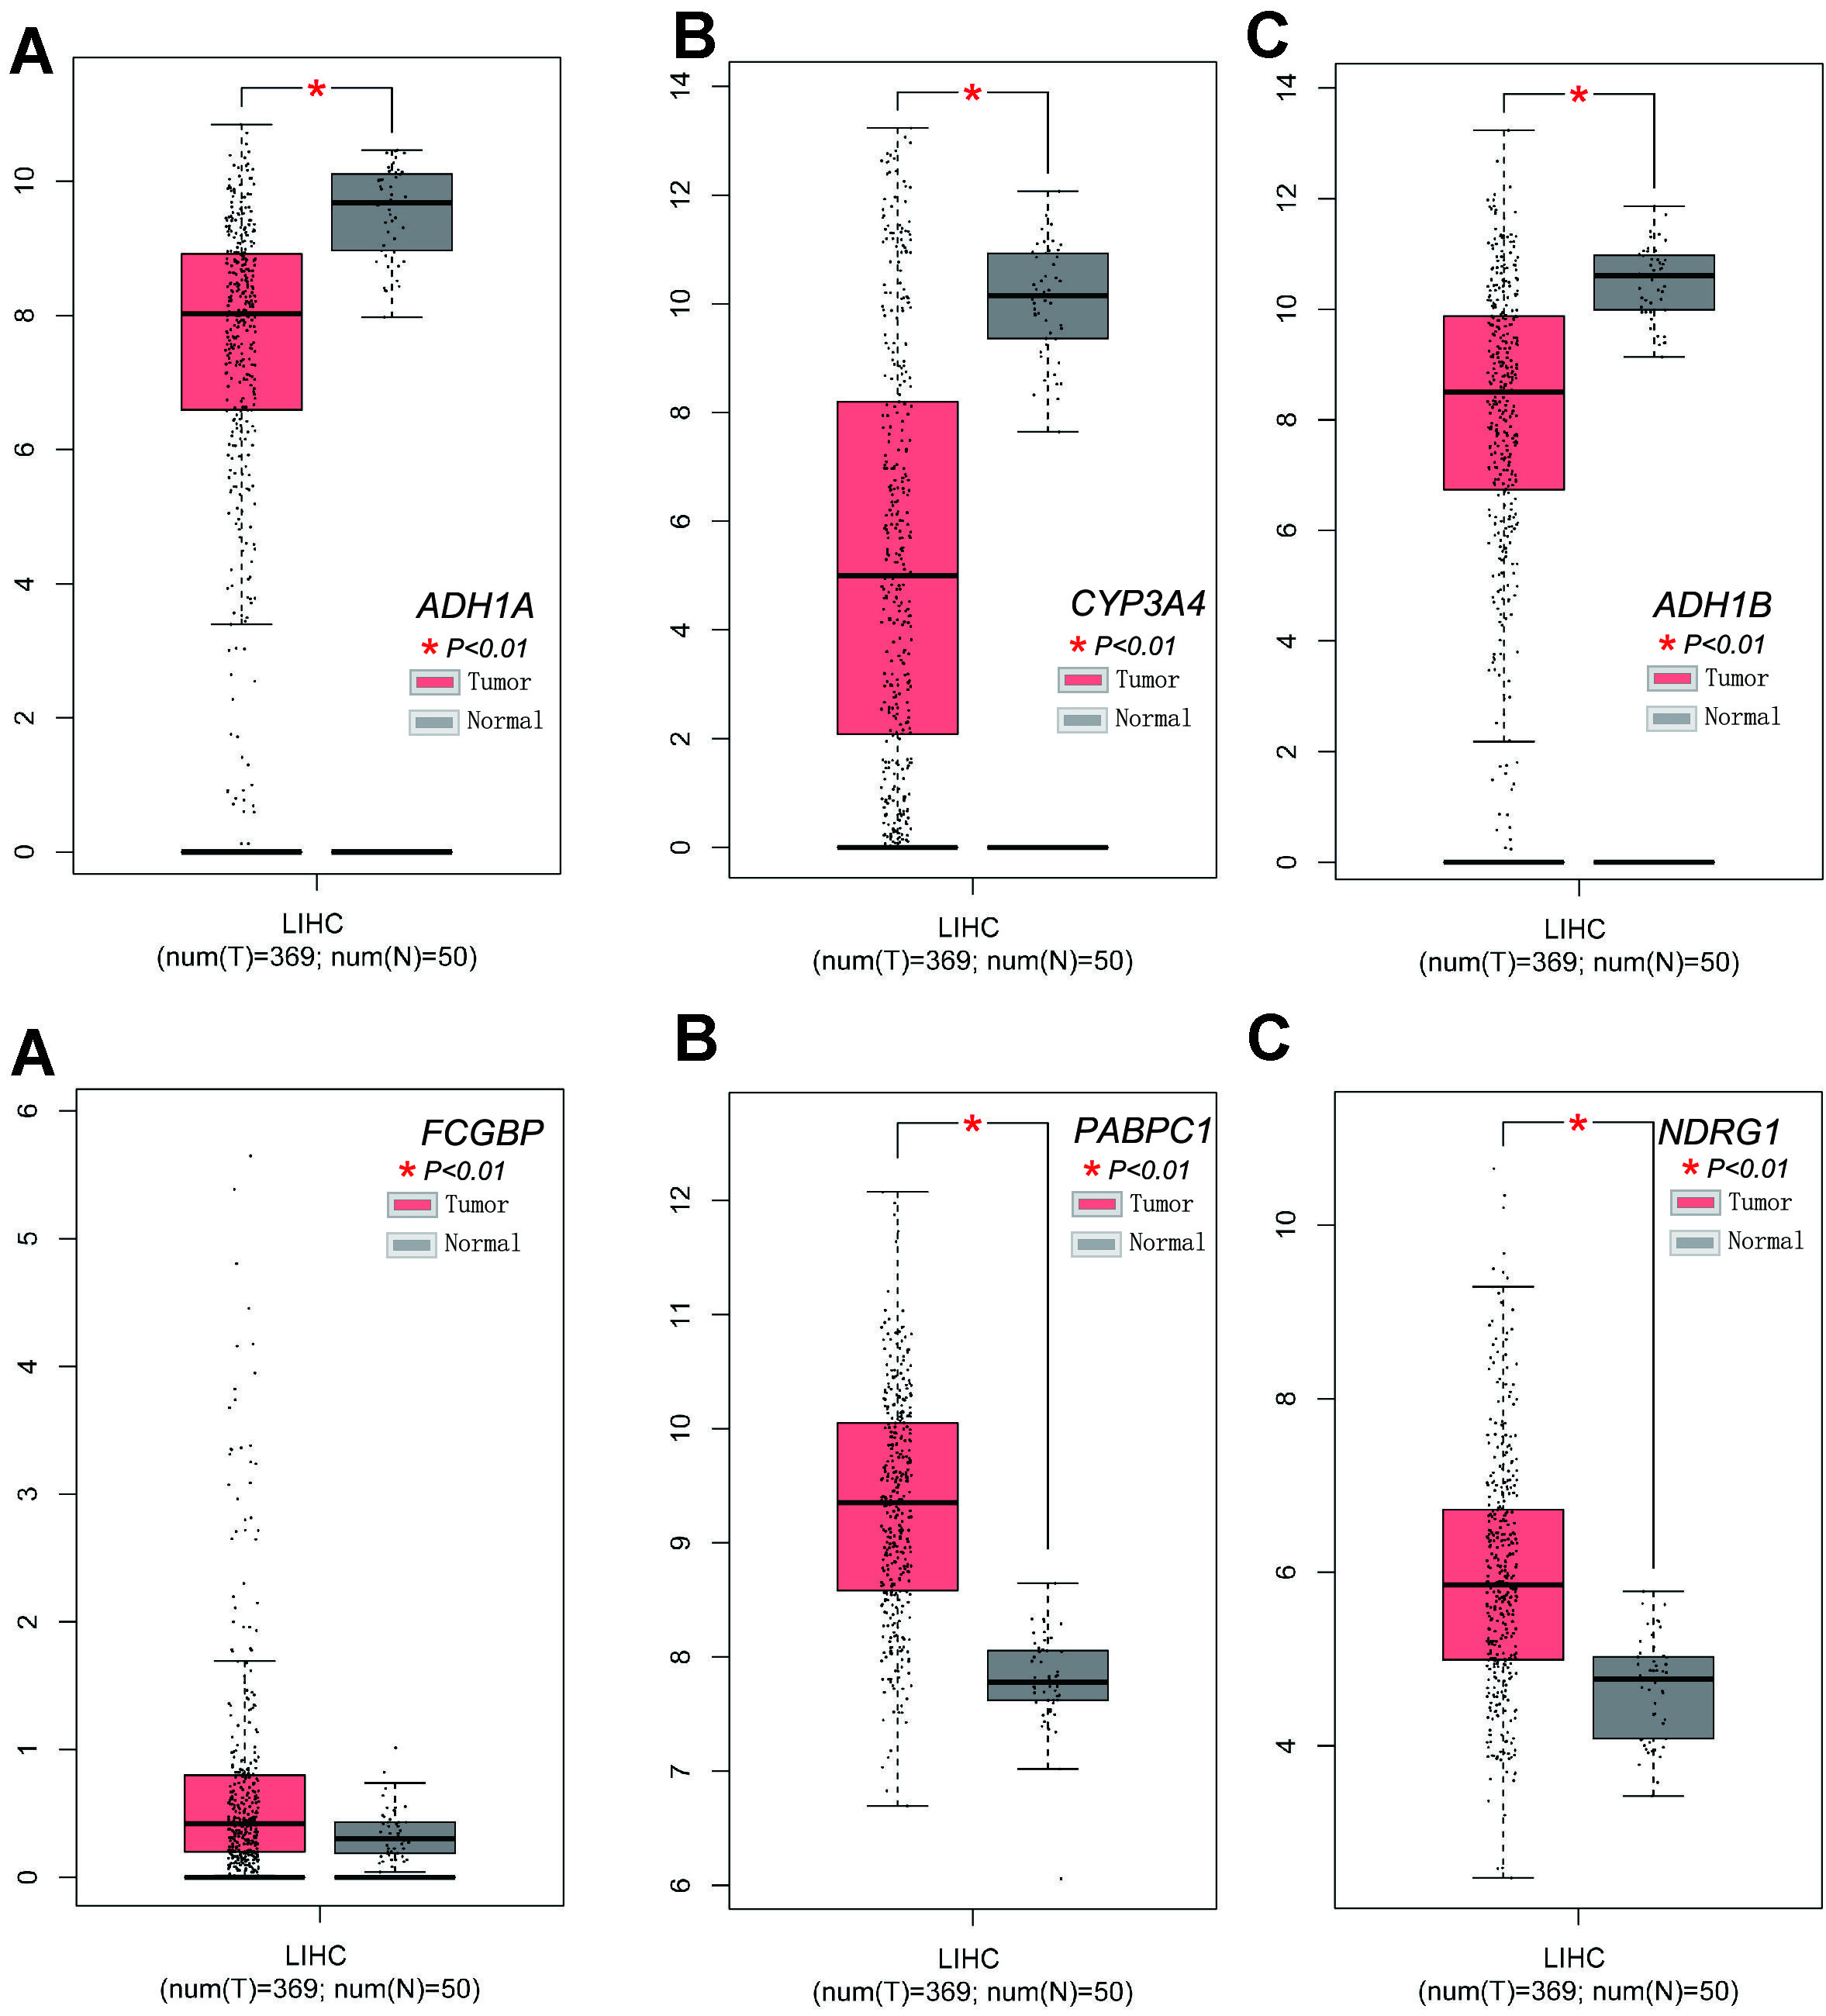
To explore the relationship between each prognostic gene and prognosis, survival analysis was performed. The result indicated that low expression of ADH1A,CYP3A4 and ADH1B was significantly correlated with poor OS (Supplementary Fig.6, A-C, P < 0.01) and high expression of FCGBP, PABPC1 and NDRG1 was significantly correlated with poor OS (Supplementary Fig. 6D-E and Fig4.D, P < 0.05). The expression levels of FCGBP, PABPC1 and NDRG1 were higher and the expression of ADH1A,CYP3A4 and ADH1B were lower in tumor tissues compared with adjacent non-tumorous tissues (Supplementary Fig. 7).
2.2 Validation of the 6 Gene Signature in the ICGC Cohort
To further validate the stability of the model based on TCGA cohort, we performed the same analysis with ICGC cohort. Refer to the median value obtained from the TCGA cohort,patients from ICGC cohort were also divided into two groups with high or low-risk.Consistent with the results from the TCGA cohort, PCA and t-SNE analyses confirmed that patients were separated in two directions (Figures 6G, H). Meanwhile, patients in the low-risk group were less likely to die earlier (Figure 6D) and had a longer survival time compared with the high-risk group (Figure 6K). Moreover, the AUC of the 6-gene signature was 0.819 at 1 year, 0.764 at 2 years, and 0.759 at 3 years (Figure 6L).
2.3 Independent Prognostic Value of the 6 Gene Signature
To validate whether the risk score was an independent prognostic factor for OS, we carried out univariate and multivariate Cox analyses. In both TCGA and ICGC cohorts, the risk scores were significantly correlated with OS according to univariate Cox analysis (TCGA cohort: HR = 2.994, 95% CI = 1.892-4.736, P < 0.001, ICGC cohort: HR = 5.358, 95% CI =2.818-10.188, P < 0.001) (Figures 7A, C) . Even after correcting for other factors, the risk score was still an independent predictor for OS based on multivariate Cox analysis (TCGA cohort: HR = 2.546, 95% CI = 1.617-4.008, P < 0.001, ICGC cohort: HR =3.780, 95% CI = 1.879-7.604, P =0.001) (Figures 7B, D).
2.4 Functional analyses in the TCGA and the ICGC cohort
The association of risk score with the clinical characteristics of HCC patients was analyzed. The result showed that the risk score was significantly higher in tumor tumor stage III-IV (P < 0.001) or grade 3-4 (P < 0.001) compared with tumor stage I-II (Figures 7G, H) or tumor grade 1-2. The same analysis in the ICGC dataset confirmed that the risk score was definitely higher in tumor stage III-IV compared with tumor stage I-II(P < 0.001) (There was no data about the grade of HCC in the ICGC dataset) (Figures 7K).
To detect whether the risk score was associated with immune components, we analyzed the relationship of risk score and immune infiltrates.
We can see that the factors such as DCs, iDCs, APC-co-stimulation, HLA, MHC class1 which were important for antigen presentation process were significantly induced in the high-risk group in the TCGA cohort (all adjusted P < 0.05, Figures 8A, B). Besides, the scores of macrophages or Treg cells were higher in the high risk group, while the score of type II IFN response and mast cells were just the opposite (adjusted P< 0.05, Fig. 8 A, B).Consistent with the analysis from TCGA cohort, comparison between high and low risk groups of ICGC cohort showed the similar result(adjusted P < 0.05, Figures 8C, D).
Six types of immune infiltrates were identified in human tumors, namely C1 (wound healing), C2 (INF-g dominant), C3 (inflammatory), C4 (lymphocyte depleted), C5 (immunologically quiet) and C6 (TGF-γ dominant) [9]. C5 and C6 immune subtypes were not included in the study because that no patient sample belonged to C5 immune subtype and C6 immune subtype in HCC. We analyzed the relationship between the immune infiltration and the risk score.We can see the high risk score was significantly associated with C2, while low risk score was significantly associated with C3 (Figure 8E).We also detect tumor stemness with RNA stemness score (RNAss) based on mRNA expression and DNA stemness score based on DNA methylation pattern (DNAss) [10]. We estimated tumor immune microenvironment with stromal score and immune score. We also performed the correlation analysis to explore the relationship between tumor stem cells and the immune environment. Base on the results, we can see that the risk score was positively significantly correlated with DNAss and ImmuneScore, while significantly negative associated with RNAss and StromaScore (P < 0.05) (Figure 8F).
The relationship between the expression of prognostic genes levels and drug sensitivity was performed too. The results showed that all prognostic genes were correlative to some chemotherapy drug sensitivity (P < 0.01) (Figure 9). For example, increased expression of NDRG1 with JNJ-42756493, Simvastatin and Cabozantinib.