Acute toxicity
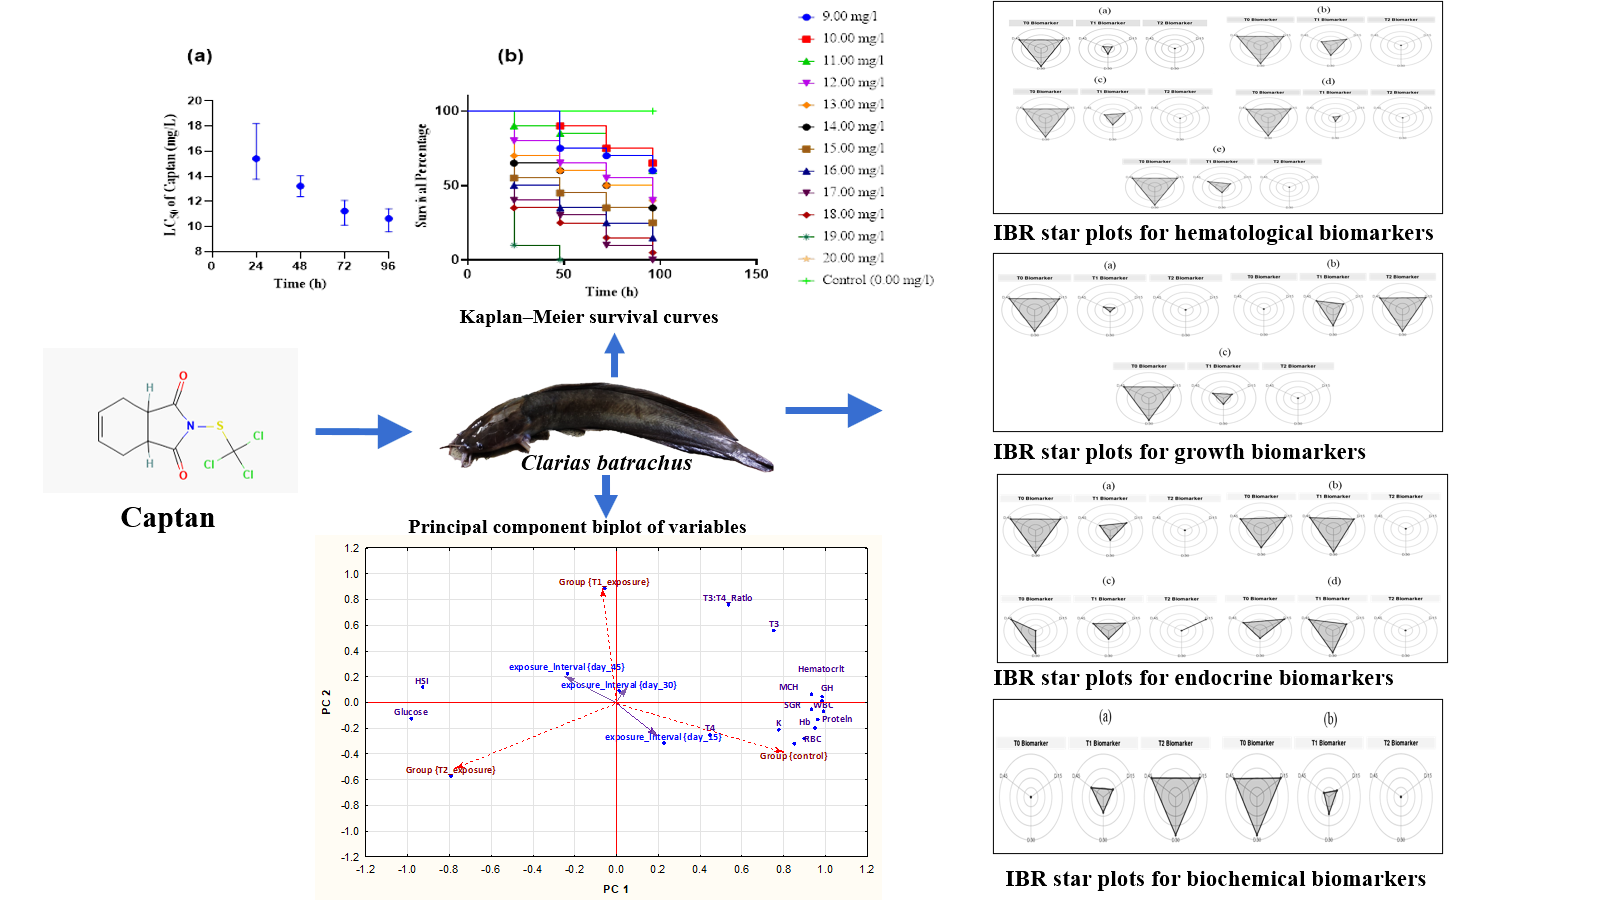
The Kaplan–Meier curve demonstrates that Captan® had a concentration and duration-dependent adverse impact on the overall survival rates of Clarias batrachus compared with the control group (Mantel-Cox log-rank test; p < 0.05) (Figure 1a-b). From the 96h LC50 curve, it is observed that higher concentration of Captan® is required to achieve 50% mortality within 24h. It further reveals that this concentration to achieve 50% mortality in exposed population decreased gradually with increasing duration. This is a strong indication that Captan® is more lethal with increased exposure duration. The relationship between the 24h LC50 and 96h LC50 indicates the toxicity of Captan® increases by a factor of 0.73 within 96 hours of exposure (Figure 1a). However, the wider error bar for 24-hour LC50 indicates a wider possibility of responses that could lead to varied mortality patterns (higher or lower than 50% mortality). The smaller error bars for LC50 at higher exposure duration i.e., 48, 72 and 96 h LC50 indicate limited variations in mortality patterns (Figure 1a). From the survival curve, there was a 100% survival likelihood Clarias batrachus at control and at the lower exposure concentrations i.e., 9 mg/L (Figure 1b). The survival curve also depicts that the likelihoods of survival was higher at lower Captan® exposure concentrations for both shorter (< 50 hours) and longer exposure durations (>100 hours) (Figure 1b) (Mantel-Cox log-rank test; p < 0.05).
Hematological profiles and indices
Assessment of Hb concentration in serum of fish across exposure concentrations revealed that across exposure intervals, i.e., 15days, 30days and 45days revealed a linear decrease in Hb levels with increased exposure of Captan® from control to T2 exposure group (fig 2). Similar trends were observed for haematocrit (Hct) levels, TWBCC, TRBCC, and MCH levels in the control group and across exposure concentrations. Blood parameters are reliable indicators for fish health and physiology because they directly reflect the relationship between habitat quality and health status (Adeogun et al., 2015; Burgos-Aceves et al., 2019). This study showed significantly lower hemoglobin and hematocrit levels in all treatments after exposure to Captan® compared to the control group (P < 0.05). This reduction in hemoglobin may be due to the destructive effects of pesticides on tissues that produce hemoglobin, which could impact the transport and distribution of dissolved oxygen to the tissues for metabolism and induce respiratory distress in affected fishes (Saravanan et al., 2011).
Along with the hemoglobin (Hb) content and the leukocyte count, the hematocrit is regarded as a key indicator of the secondary stress response, and non-physiologically low hematocrit values are considered hallmarks of anemia, a specific pathophysiological stress response (Rebl et al., 2021). From this study, the changes in the levels of white blood cells following exposure to Captan® may be due to disturbances in the process of hematopoiesis and subsequent reduction or non-specific immune weakening in fish (Kumar et al., 2011). This study also revealed that the number of red blood cells (TRBCC) in all treatments after exposure to Captan® was less than the control group (P < 0.05). A decline in the number of red blood cells primarily indicates the severe anemia caused by herbicide exposure, which reduces the total protein in blood plasma and has significant implications on the total energy balance of the body (Ramesh et al., 2009). The lower values of MCH in exposed fishes compared to the control group (P < 0.05) indicate a reduction in size and quantity of hemoglobin of red blood cells, which is diagnostic of anemia in fish (Rebl et al., 2021). The reduction of MCH could also reflect a large percentage of immature red blood cells in the bloodstream.
Growth biomarkers
Assessment of growth biomarkers and indices showed that irrespective of exposure intervals, condition factor (K) was significantly higher in control, followed by T1 and T2. HSI also differed in a linear pattern from control, followed by T1 and T2, however HSI was higher at highest Captan® exposure concentrations at T2 and least in control group. SGR on the other hand was significantly higher in control group and least in T2. The condition factor is an organism-level response, with factors such as nutritional status and toxic chemical exposure causing greater- than-normal and less-than-normal weights (Adeogun and Chukwuka, 2011; Ibor et al., 2019). However, the higher condition index values in control compared to the Captan® exposed fish is considered a reflection of depletion in energy reserves because this index is positively related to muscle and liver energy content (Stevenson and Woods Jr, 2006; Adeogun et al., 2013). The HSI on the other hand is one of the various organo-somatic indices and is often associated with contaminant exposure and response (Hismayasari et al., 2015; Pham and Nguyen, 2019). This is because the change in size of the liver is a reflection of its being a target organ for toxicity as well as a primary detoxification organ in fish (Velkova-Jordanoska and Kostoski, 2005; Feist et al., 2015). Thus, the higher HSI in Captan® exposed fish compared to fish in the control group reflects an increase in size (hypertrophy) or increased number of hepatocytes (hyperplasia) due to increased xenobiotic uptake and biotransformation (Adeogun et al., 2016).
The specific growth rate of fish is a tool mostly used in aquaculture for the estimation of fish food conversion rate over a certain period of time, and reduction in SGR can be related to the increase in pollutant-related stress (Sweilum, 2006). The significantly higher values of SGR in control group compared to Captan® exposure groups confirms that this herbicide impacts growth rate of exposed fishes possibly by disrupted metabolism and a resultant lowered food conversion rate.
Endocrine biomarkers
Expression of the pituitary growth hormones (GH) was significantly higher in control group and decreased linearly from T1 to T2. Patterns of decrease from control to highest exposure group was unchanged across exposure intervals (Figure 4a). However, irrespective of exposure intervals Tri-iodothyronine (T3) did not differ significantly between control and T1 (intermediate exposure group), but marked difference was observed between the control group and highest exposure group. At day 15, thyroxine concentration in tissue of control fish was significantly lower than group T1 while levels in group T2 were significantly higher than T1. At day 30 and 45, the trends reversed where T4 showed highest levels in control group with decreasing levels from T1 group to T2 group.
The concentration-dependent down-regulation of the pituitary growth hormone in Captan® exposure groups is depictive of toxic effects. Studies have demonstrated negative effects of pollutants, including xenoestrogens and heavy metals on GH-mediated mechanisms, via interference with the GH receptor and/or GH transcription (Deane and Woo, 2009). Furthermore, the lower level of T3 in fish exposed to Captan® compared to control group could be attributed to decrease in T3 plasma concentration due to an inability of the organism to produce the optimal level T3 or hypothalamus, pituitary and ovary interaction (Ruby et al., 1993).On day-15, the elevated levels of T4 level recorded in exposure- group is s consistent with other species exposed to pesticide (Liu et al., 2011). The increased activity of T4 in exposure groups compared to control group on day 15 may be indicative of sub-chronic adaptive response in exposed fish, and deployment of growth factors for repair and turnover of somatic cells. Thyroid hormones play important roles in multiple physiological functions in aquatic animals including development, growth, and reproduction (Leatherland, 2000). Another possible explanation is the disrupted synthesis of the circulating thyroid hormones, or disrupted secretion and eventual conversion of T4 to T3 conversion in exposed fish (Movahedinia et al., 2018). T4 generally represents >95% of the thyroid hormone output and it is typically present in higher quantities than T3 in the blood circulation, with the higher T4 concentrations serving as a pool of prohormone that can be converted into T3 by 5-iodothyronine deiodinases in target tissues (Eales, 2006; Zoeller et al., 2007).
Biochemical biomarkers
The changes associated with GCSS and PCSS levels are summarised in Figure 5. Study findings revealed that GCSS increased linearly and significantly from control group to T1 to T2 across all exposure concentrations. However, PCSS increased linearly and significantly from control group to T1 to T2 across all exposure concentrations. The significant differences in glucose concentrations in plasma (p < 0.05) between the control and treatment fish, following the action of Captan®, may be considered to be the manifestation of stress. Reports show that marked glucose increase is a general response of fish experiencing pollutant effects, because fish challenged by environmental pollution may have a higher turnover of glucose, and more glucose may be produced from non-carbohydrate substrates (Levesque et al., 2002). Hepatic synthesis of detoxifying enzymes under stress conditions requires high energy levels that necessitates documented depletion of hepatic glycogen stores and increased deployment of glucose (Begum and Vijayaraghavan, 1995; Ceron et al., 1997). The observed decreased protein levels may be seen in starvation, and malabsorption or malnutrition (Pagana and Pagana, 1998) following extended exposures to stress. Concurrent decrease in total serum protein and a decrease in the haematocrit values implicates chronic exposures to pollutant toxicity (Adeogun et al., 2015). Change in protein synthesis is reflective of severity in cellular damage (Osman and Kloas, 2010) and may have dire implications on physiological activities and effectiveness of the immune system (Svoboda et al., 2001).
Integrated Biomarkers Response (IBR)
In order to compare the overall stress on C. batrachus, the IBR index was applied. From Table 1, control exposure group showed higher values of the IBR index for all biomarker parameters compared to T1 and T2 exposure groups. Reverse trends where IBR index was higher in Captan® exposure groups compared to fish in control group was observed for HSI and GCSS (Table 1). This is because, unlike the case for other biomarkers, higher IBR index values for HSI and GCSS indicate adverse reaction from toxicity. As such, evident from this index, the rank of toxic effects due to Captan® exposures can be ordered as: T2>T1>T0 (control).
The transformed data of all the studied biomarkers are presented as star plot for each site in Figure 6(a-d). The star plots showing progressive increase in reduction or increase in size of shapes obtained for each experimental group inherently reflects a gradient in toxic responses. From the size and shape of the grey area within the star plot, it is clear that T2 Captan® exposure group with the smallest sized star plot and grey area was the most impacted group, followed by T1, while the control group with the largest shape and grey area was the least impacted. The reverse trends explained above where large grey areas for some biomarkers indicate adverse impact is also applicable.
The IBR approach provides a simple tool for a general description of the ‘‘health status’’ of populations, by integrating different biomarker signals (Leiniö and Lehtonen, 2005). Other studies that utilized this IBR index also demonstrated consistent indications of adverse toxicity impacts regardless of the considerable variability in the biomarker sets used for the index calculations (Broeg and Lehtonen, 2006; Damiens et al., 2007).
Table 1. Summary of IBR mean values of different biomarkers to different Captan® concentrations
|
Biomarkers
|
Control (T0)
|
T1
|
T2
|
|
Hb
|
4.75
|
0.0
|
0.0
|
|
HCT
|
5.09
|
1.47
|
0.0
|
|
TWBCC
|
5.11
|
0.87
|
0.0
|
|
TRBCC
|
4.51
|
0.12
|
0.0
|
|
MCH
|
5.04
|
0.89
|
0.0
|
|
K
|
4.53
|
0.13
|
0.0
|
|
HSI
|
0.0
|
2.01
|
4.92
|
|
SGR
|
5.02
|
0.60
|
0.0
|
|
GH
|
5.11
|
1.27
|
0.0
|
|
T3
|
3.60
|
4.02
|
0.0
|
|
T4
|
1.69
|
1.54
|
0.0
|
|
T3:T4
|
2.21
|
3.57
|
0.0
|
|
GCSS
|
0.00
|
0.97
|
5.15
|
|
PCSS
|
4.96
|
0.54
|
0.0
|
Multivariate analysis: PCA
The PCA presents the association between dependent variables (haematological, endocrine, growth and biochemical parameters) and independent or effect variables (exposure interval and exposure group) within ordination space (fig 7). Two principal components were extracted with PC 1 axis accounting for 64.7% of the total variance between parameters. From PC1, we infer that irrespective of exposure interval, that fish from the control group show significant positive association with hematological parameters (Hb, RBC, WBC, MCH, haematocrit), biochemical (total protein), growth (condition factor, K, SGR), and endocrine parameters (T3, T4, T3:T4 ratio and GH). This positive association implies that these parameters generally showed patterns of higher concentration in fish from the control group compared to fishes exposed to Captan®. On the negative axis of PC 1, the T2 exposure group showed a positive association with glucose and HSI. This indicates that these parameters showed significantly higher values in fish from the T2 exposure group than the T1 exposure group and fishes from the control group. These findings readily corroborate depictions from the difference in means of these parameters across exposure groups and control.
From PC 2, the T2 exposure group showed a negative association with the T3:T4 ratio and T3 (fig 7). This indicates that T3:T4 ratio, and concentrations of T3 were markedly lower in the highest Captan® exposure concentration compared to fishes in intermediate exposure concentrations (T1). The significant decrease in plasma T3 and T3/T4 ratio in fish exposed at highest concentrations of Captan® suggests the inhibitory effect of this herbicide on extrathyroidal conversion of T4 to T3 (Eales et al., 1999; Brar et al., 2010). Quantifying T4 and T3 levels has been recommended as a good approach for detecting most xenobiotic effects on the peripheral thyroid system (Zoeller, 2010). The thyroid system plays a pivotal role in the body homeostasis and functioning of the nervous, cardiovascular and reproductive systems, and of body growth control (Danzi and Klein, 2012), and the effects of thyroid hormones mainly depend on intracellular concentrations of its biologically active and most circulated form T3 (Buha et al., 2018). As such, the depleted levels of T3 in the highest Captan® exposures portend significant impairments in physiological homeostasis.