Characterization of nanomaterials
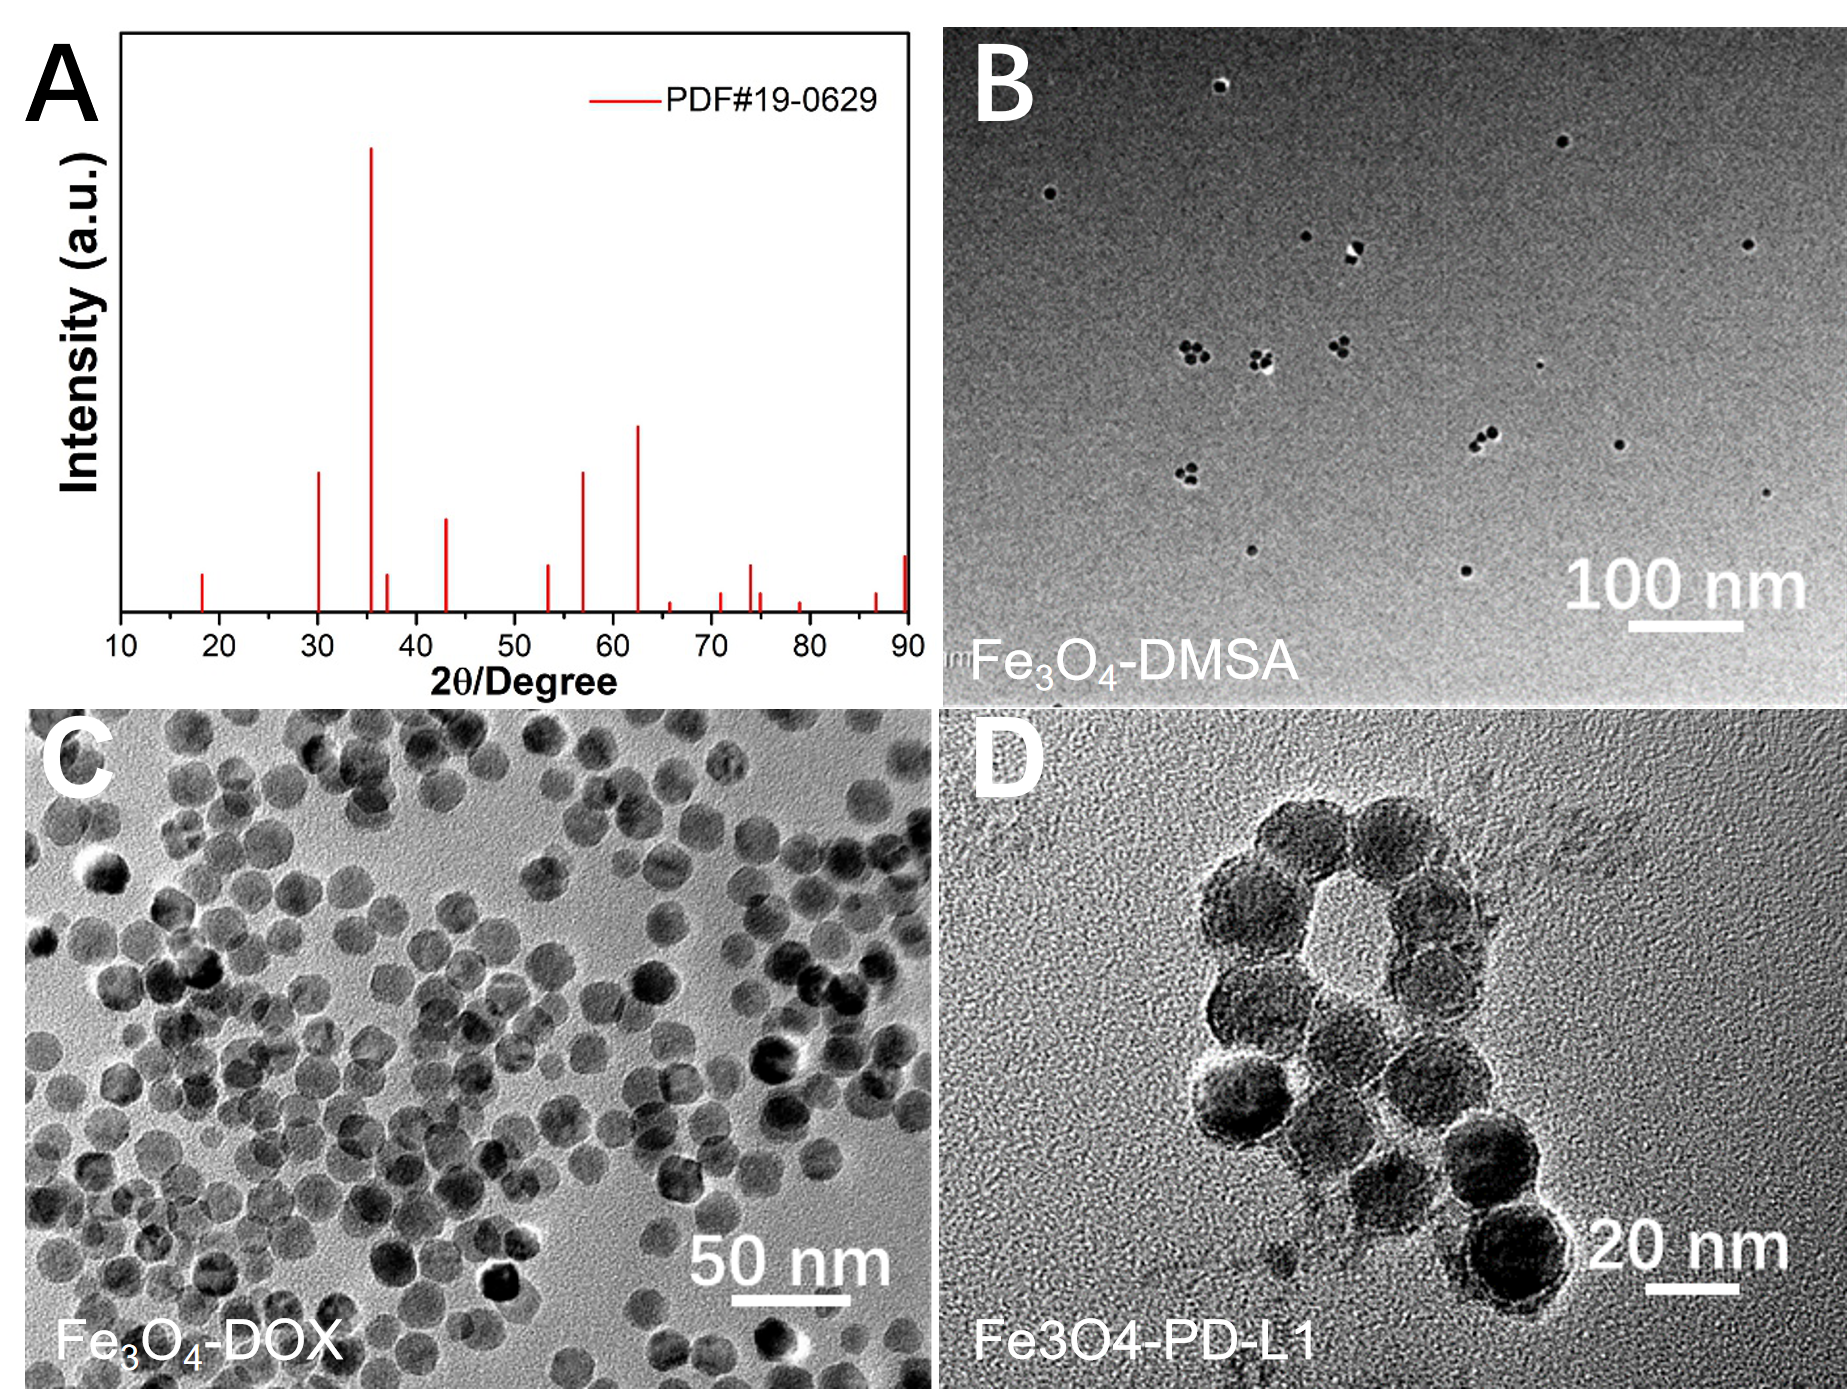
The morphological characteristics and crystal structural features of synthesized nanoparticles were investigated by TEM and HRTEM, respectively. As shown in Fig. 2A, the nanoparticles were of uniform shape with the size of ~ 20 nm. The HRTEM image (Fig. 1B) of the obtained nanoparticles showed that the nanoparticles were of high crystallinity with the crystal plane spacing (d = 0.29 nm) corresponding to the (422) crystal face. After the modification by the DMSA molecule, the Fe3O4-DMSA showed high monodispersity in water (Fig. S1B) due to the abundant carboxyl group on the surface of Fe3O4 nanoparticles. The morphological observations of the Fe3O4 nanoparticles after the conjugation with DOX molecule, PD-L1 antibody, and both DOX molecule and PD-L1 antibody on the surface of Fe3O4-DMSA nanoparticles were shown in Fig. S1C, Fig. S1D, and Fig. 1C, respectively. The conjugation of DOX molecule showed no evident effect on the morphology of the Fe3O4 nanoparticles (Fig. S1C). However, after the conjugation of PD-L1 antibody, the surface of Fe3O4 was coated by a layer of organic component, probably due to the PD-L1 antibody with high molecular weight (Fig. S1D). Similarly, after the conjugation of both DOX molecule and PD-L1 antibody, the Fe3O4 nanoparticles were also coated by an organic layer (Fig. 1C). The XRD pattern showed that the synthesized nanoparticles corresponded to the standard PDF card (19–0629) (Fig. 1D; Fig. S1A), indicating that the nanoparticles were the pure Fe3O4 phase with high crystallinity. These results were consistent with those of the HRTEM observations. The superparamagnetic property of the synthesized Fe3O4 nanoparticles was measured through the saturation magnetization curve based on a vibrating sample magnetometer with the saturation magnetization at room temperature confirmed as large as 53 emu/g (Fig. 1E). To confirm the modification of DMSA molecule on the surface of Fe3O4 nanoparticles, the FTIR spectra were analyzed (Fig. 1F). For the sample of Fe3O4, the strong peaks located at 2916 and 2847 cm− 1 corresponded to the C-H stretching vibration of methylene due to the remained oleic acid molecule on the surface of Fe3O4 nanoparticles, while the broad peak around 2037 cm− 1 corresponded to C-O stretching vibration. For the samples of Fe3O4-DMSA, the sharp peaks at 1569 and 1360 cm− 1 corresponded to the abundant symmetric and asymmetric stretches of carboxylate (COO-), while the broad peak at 3243 cm− 1 were caused by the O-H stretching vibration. The peaks located at 1046 cm− 1 corresponded to the C-O stretching vibration. These peaks indicated the abundance of DMSA molecules. The FTIR results confirmed that the DMSA molecules were successfully modified on the surface of Fe3O4 nanoparticles. The UV-Vis absorbance spectrum of Fe3O4-DMSA, Fe3O4-DOX, Fe3O4-PD-L1, and Fe3O4-PD-L1/DOX were shown in Fig. 1G. The results indicated that the conjugation of PD-L1 antibody showed no effect on the absorbance spectrum, whereas the conjugation of DOX molecule largely increased the absorption from the wavelength of 600 nm to 1000 nm, strongly confirming the conjugation of DOX molecule on the surface of Fe3O4 nanoparticles. The zeta potential values of Fe3O4-DMSA, Fe3O4-DOX, Fe3O4-PD-L1, and Fe3O4-PD-L1/DOX were − 59.4 ± 6.6 mV, − 42 ± 10.2 mV, − 28.7 ± 4.63 mV, and − 38.9 ± 7.18 mV, respectrively (Fig. 1H). The large negative value of Fe3O4-DMSA aqueous was due to the abundant carboxyl group of DMSA molecule on the surface of Fe3O4 nanoparticles, attributing to the high monodispersity of the aqueous. After the conjugation of PD-L1 antibody and DOX, the zeta potential increased, probably due to the consumption of carboxyl group on the surface of Fe3O4 nanoparticles. The size distribution of these samples were investigated. Results showed that the Z-Average sizes of Fe3O4-DMSA, Fe3O4-DOX, Fe3O4-PD-L1, and Fe3O4-PD-L1/DOX were 35.7 nm, 61.6 nm, 182.9 nm, and 237.7 nm, respectively (Fig. 1I). These results were consistent with those based on TEM observations.
In vitro imaging
We investigated the feasibility of imaging protein targets PD-L1 in 4T1 cells (Fig. 2A). The results showed that PD-L1 was widely expressed on the surface of 4T1 cells, confirming its feasibility as a target.
To further verify the targeting of nanoparticles and the effectiveness of MRI in 4T1 cells, post-uptake MRI was performed on non-targeted (Fe3O4) and targeted (FP) groups of nanoparticles (Fig. 2B). The results showed that T2WI of the targeted group was significantly lower than that of the non-targeted group, and the signal intensity in the targeted group decreased with the increase of concentration, indicating that the uptake of nanoparticles in the targeted group was more than that in the non-targeted group (P < 0.001) in a concentration-dependent manner (Fig. 2C).
To see the in vitro uptake properties of these nanoparticles, we carried out Prussian blue staining and iron assay on 4T1 cells (Fig. 2D, E). Under the same concentrations (10–40 µg/mL), FPD was stained stronger than Fe3O4 group. ICP-MS was performed to detect the iron content (Fig. 2E). Compared with Fe3O4 group, the FPD group showed significantly higher uptake for iron content (P < 0.001).
The cellular uptake of nanoparticles and ultrastructural features in 4T1 cells were observed using TEM (Fig. 2F). More FP/FPD nanoparticles were internalized compared to Fe3O4 nanoparticles with the nanoparticles gradually peaked at 4 h and dissipated at 24 h.
Therapeutic efficacy of nanoparticles in vitro
The CCK-8 method was used to investigate the toxicity of Fe3O4 nanoparticles to cells. In 6, 12, 24, and 48 h, these nanoparticles did not show noticeable cytotoxicity toward 4T1 and MCF-10A cells (Fig. 3A).
Double staining of Hoechst 33342 and PI was used to evaluate cell apoptosis (Fig. 4B). The results showed that the nuclei of apoptotic cells in FD and FPD groups emitting a shrunken, fragmented with strong blue and red fluorescence. The results of the quantitative assessment showed that the survival rates of normal cells in FPD group were lower than those in FD group (Fig. 3C; P < 0.05).
The ROS level in the FD/FPD group was significantly higher (P < 0.05) than that in the Fe3O4/FP group, indicating that DOX led to elevated ROS levels in the cells, while the ROS level of FPD group was significantly higher than that of FD group (Fig. 3D, E).
MRI imaging in vivo
We measured the relaxation rate of FPD to evaluate the performance of FPD as a contrast agent in MRI. T2WI images and pseudo color map of FPD at 0.025325, 0.05065, 0.1013, 0.2026, and 0.4052 mM were shown in Fig. 5A. The fitting curve (Fig. 4B) obtained showed that the relaxation rate of FPD was 146.43 mM− 1s− 1, which is far high the relaxivities of usual MRI contrast agents, indicating that FPD can be used as a negative contrast agent for T2WI.
Next, T2-weighted MRI scans were acquired before and after the intravenous injection of FPD at different time points (1, 4, 8, and 24 h) for the mice with 4T1 tumor. As shown in Fig. 4C-D, MRI showed that the lowest signal value was achieved in the tumor site at 4 h after probe injection both in Fe3O4 and FPD group, but a more significant decreased MRI signal value in the tumor region was detected in FPD group (P < 0.001). And the signal value at tumor site gradually recovered to its initial state 24 hours after nanoparticles injection. These results were consistent with the results of cell imaging, supporting the specific targeting of FPD to tumors. FPD aggregates much more in tumor sites than Fe3O4, suggesting that FPD can be used as an optimal probe for in vivo MRI to improve the accuracy of biomedical imaging.
Efficacy of combination therapy in vivo
To determine thesynergistic benefit of DOX combined with PD-L1 immunotherapy, we performed the in vivo antitumor experiments.
The mice with 4T1 tumor were divided into 5 groups and treated with PBS, Fe3O4, FP, FD, or FPD, respectively. The body weight and tumor volumes in mice were continuously monitored to assess the antitumor efficacy for a total of 15 days (Fig. 5A). No significant differences in tumor volume were observed between the PBS and the Fe3O4 groups (Fig. 5B, C). The volume of tumor in FD group were significantly smaller than that in the FP group, while the FPD group showed the smallest tumor volume, indicating the highest antitumor efficacy. The survival rate of mice with different treatments was monitored to the end of the experiment. The data suggested that the treatments of DOX and PD-L1 group increased the survival rate compared to other two groups, the increased potential tumor therapeutic effects due to the combination therapy of DOX and PD-L1 immunotherapy (Fig. 5D). Besides, the mouse body weight had no significant difference among the five groups of mice until the end of the trial (Fig. 5E).
Efficacy of in vivo chemotherapy
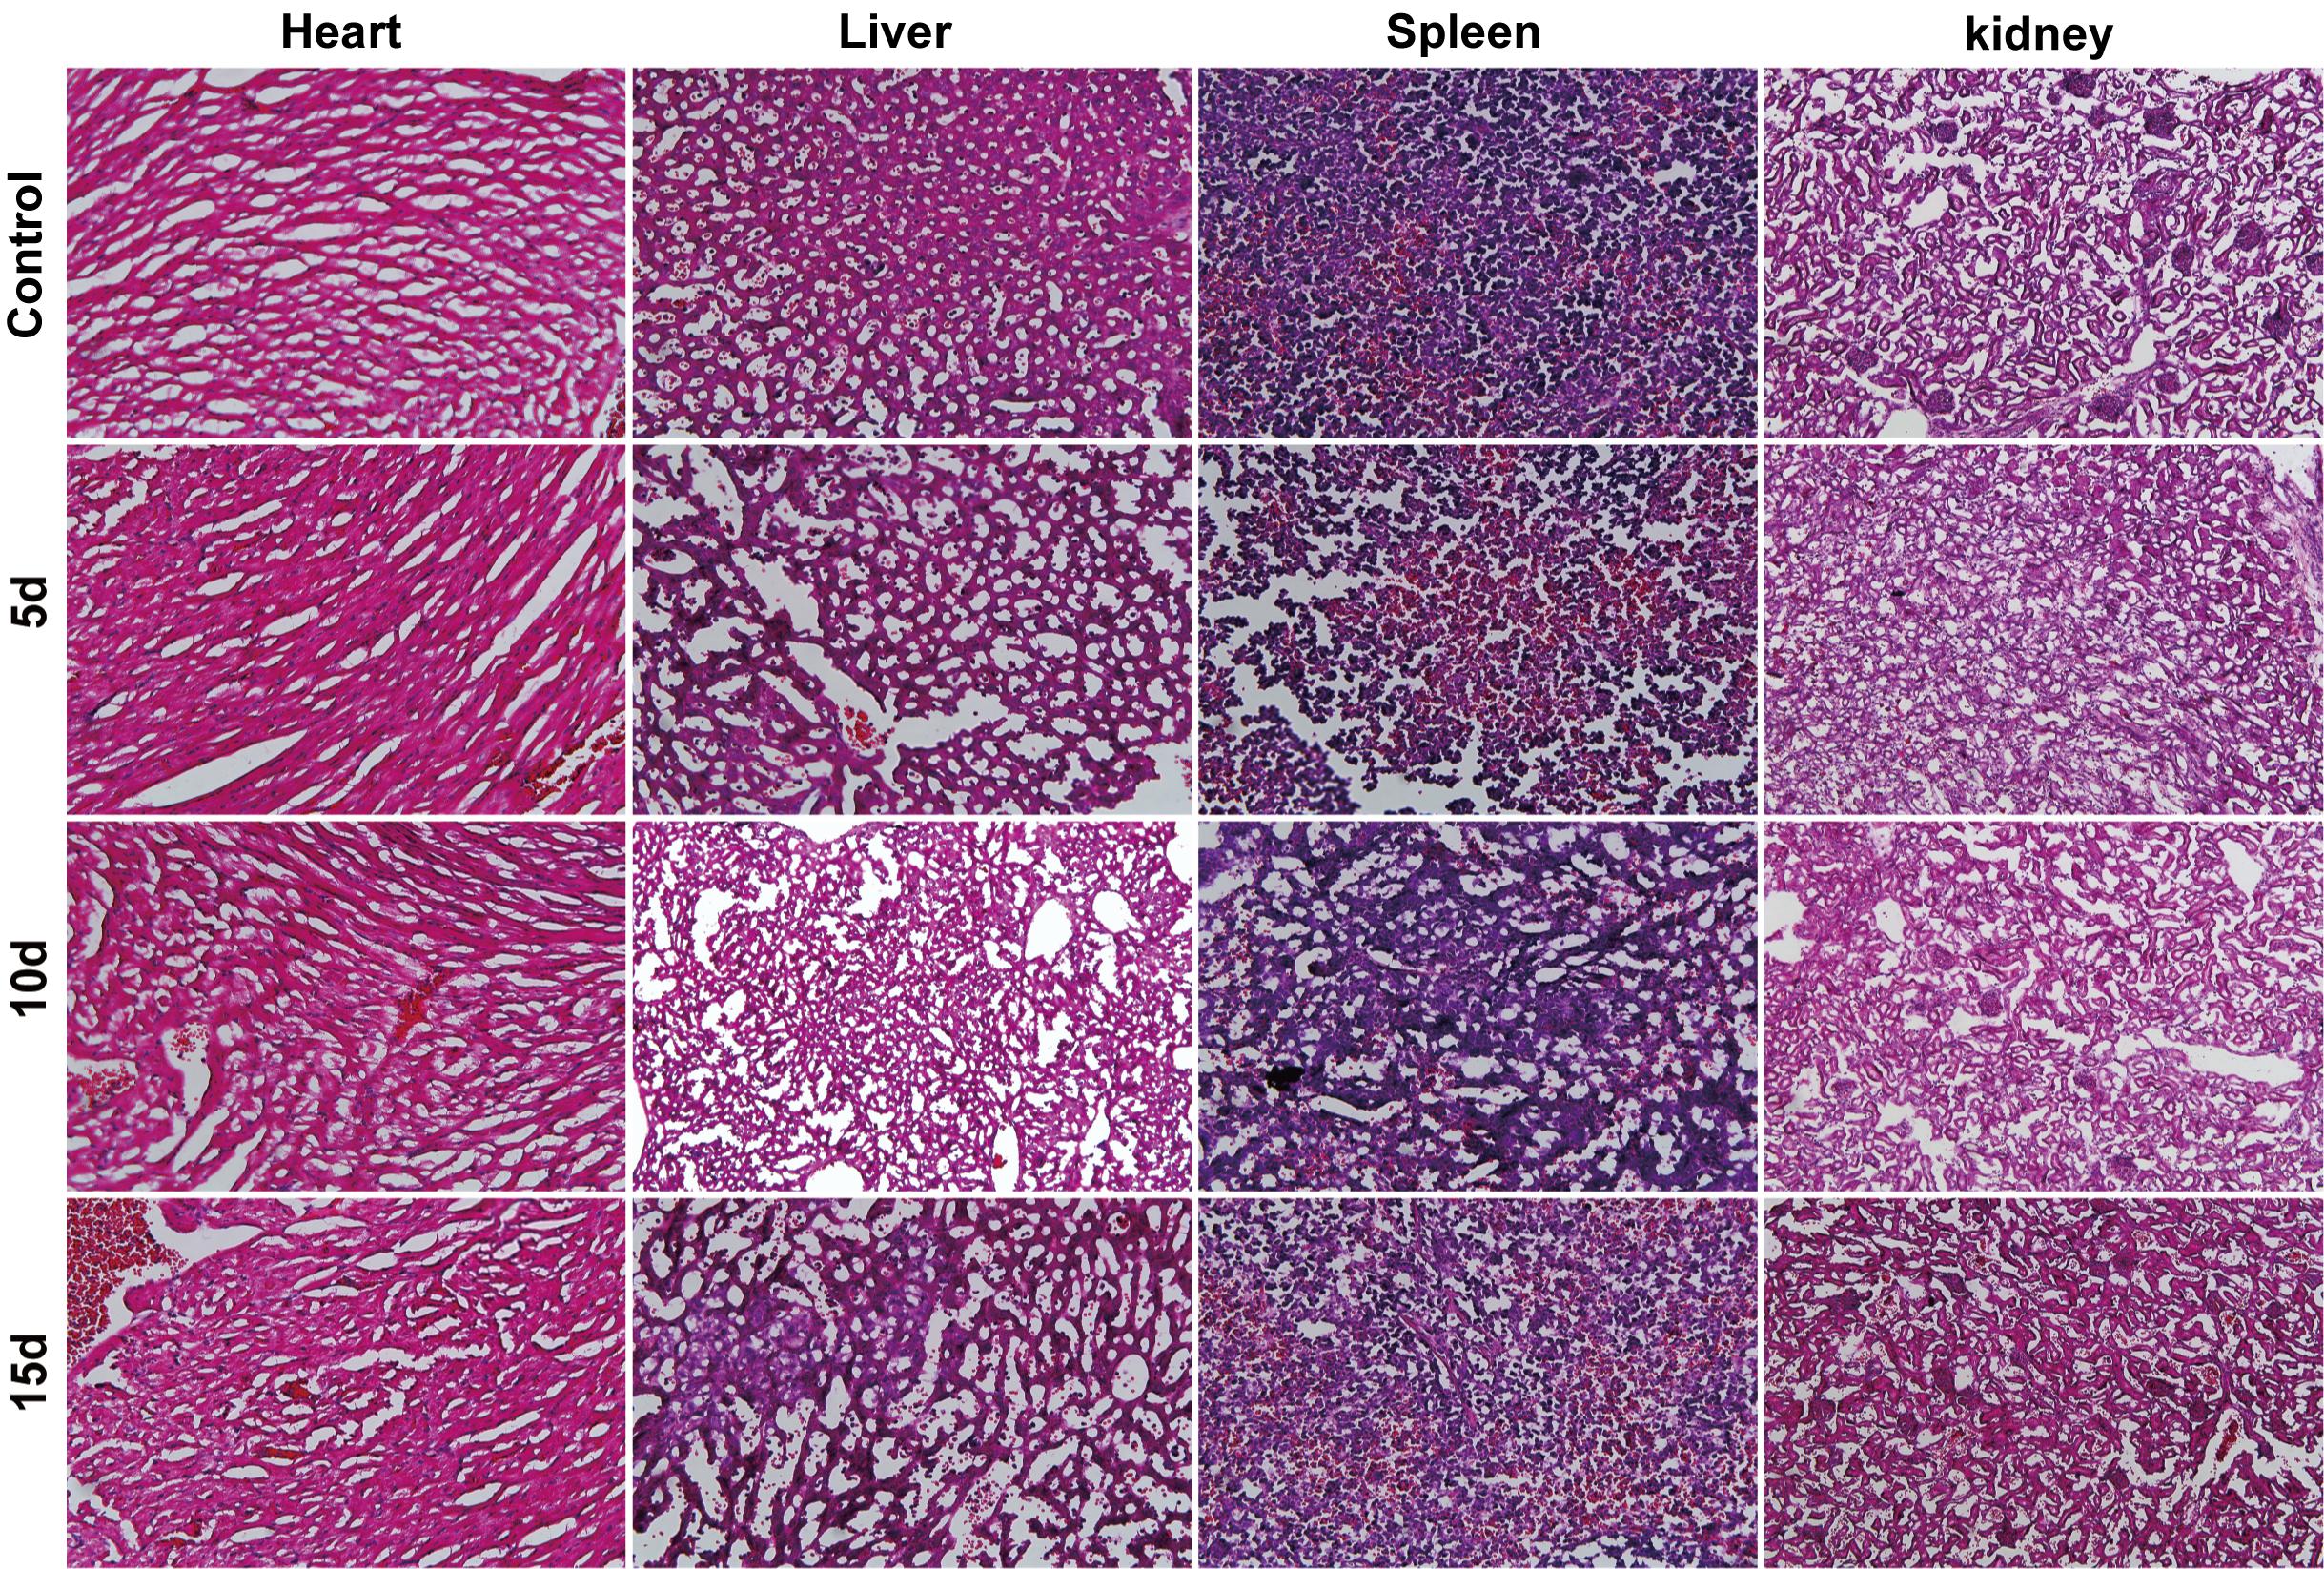
To further verify the therapeutic effect of the nanomaterials on tumor tissue, the TUNEL apoptotic assay was performed on the tumor tissues (Fig. 6A, B). Results showed that the therapeutic effect of FPD on tumor tissues was significantly increased in comparison to that of other groups (P < 0.01). Furthermore, in order to further verify the biosafety of the nanomaterials, we also performed TUNEL staining on the major organs of the mice to mark apoptotic cells. Results showed that few apoptotic cells were observed on the major organs, including the heart, liver, spleen, lung, and kidney (Fig. 6C, D). The qRT-PCR results of three apoptosis-associated genes (Caspase-3, bax and bcl-2) revealed that FPD was not only lethal to the tumor tissue, but also safe compared with the control group (Fig. 6E). Moreover, the results of HE staining also revealed that the nanoparticles showed low organotoxicity (Fig. S2).
Efficacy of in vivo immunotherapy
We performed immunofluorescence on PD-L1 in tumor tissues to further verify the feasibility of PD-L1 as a target of the nanoparticles (Fig. 7A). The results of Prussian blue staining on tumor tissue sections showed that the tumor absorption capability in the FPD group was significantly higher than that in the control group (Fig. 7B).
In order to verify the efficacy of immunotherapy in vivo, the contents of CD3+CD8+ T cells in tumor tissues were measured. Flow cytometry test results showed that the content of CD3+CD8+ T cells in the FPD group was significantly higher than that in the control group and FD group (Fig. 7C, D), while there were more CD3+CD8+ T cells in the FD group than that in the control group, indicating the synergistic effect of chemotherapy and immunotherapy on the tumor.