1. Assessment of pathological response
The examples of Mandard TRG are shown in Fig. 1. Totally, 797 slides indicating surgical specimens were reviewed. The median number of reviewed slides was 4, with an interquartile range from 3 to 5. After revaluation, the number of patients was 10, 48, 57, 50 and 6 in the group of TRG 1-5, respectively. There was no significant difference in survival between TRG 1 and TRG 2 (p=0.374), so these two categories were classified into the responder group. Similarly, no significant difference was found among TRG 3, TRG 4 and TRG 5 (p=0.560), so these two categories were classified into the non-responder group. The survival curves of Mandard TRG were shown in Fig. 2.
2. Expressions Of Biomarkers And Correlations With Pathological Response
Morphologically, CAFs are a group of spindle-shaped cells surrounding the tumor cells. In 171 specimens after treatment, in CAFs, 31 cases were positive for CD10, with a positive rate of 18.1%; 68 cases were positive for FAP, with a positive rate of 39.8%; 21 cases were positive for GPR77, with a positive rate of 12.3%.
Among 171 specimens before treatment, in CAFs, 26 (15.2%) cases were positive for CD10, 34 cases (19.9%) were positive for FAP, and 15 cases (8.8%) were positive for GPR77. Examples of expression of biomarkers were shown in Fig. 3.
The expressions of biomarkers after treatment (post-) and before treatment (pre-) of all 171 patients are shown in Table 1 and Table 2, respectively. For biomarkers after treatment, high expressions of all biomarkers were related to worse pathological response (all p<0.005) (Table 1). However, before treatment, only high expression of pre-CD10 was related to worse pathological response (p=0.030), while pre-FAP (p=0.067) and pre-GPR77 (p=0.233) were not (Table 2). The details of relationships between biomarkers and the TRG were shown in Additional file 1.
Table 1
Correlation between biomarkers after treatment and clinicopathological characteristics
| | CD10 | P-value | FAP | P-value | GPR77 | P-value | No. (%) |
| | - | + | - | + | - | + |
| Gender | | | 0.716 | | | 0.140 | | | 0.221 | |
| Male | 104 | 24 | | 73 | 55 | | 110 | 18 | | 128 (74.9) |
| Female | 36 | 7 | | 30 | 13 | | 40 | 3 | | 43 (25.1) |
| Age (yr) | | | 0.228 | | | 0.793 | | | 0.417 | |
| ༜65 | 113 | 22 | | 82 | 53 | | 117 | 18 | | 135 (78.9) |
| ≥65 | 27 | 9 | | 21 | 15 | | 33 | 3 | | 36 (21.1) |
| Tumor location | | | 0.339 | | | 0.725 | | | 0.255 | |
| Lower third | 74 | 15 | | 51 | 38 | | 74 | 15 | | 89 (52.0) |
| Middle third | 35 | 6 | | 27 | 14 | | 39 | 2 | | 41 (24.0) |
| UGEJ | 22 | 9 | | 18 | 13 | | 28 | 3 | | 31 (18.1) |
| Diffuse | 9 | 1 | | 7 | 3 | | 9 | 1 | | 10 (5.8) |
| Tumor size (cm) | | | 0.006 | | | 0.002 | | | 0.152 | |
| <5 | 60 | 5 | | 49 | 16 | | 60 | 5 | | 65 (38.0) |
| ≥5 | 80 | 26 | | 54 | 52 | | 90 | 16 | | 106 (62.0) |
| ypT | | | 0.047 | | | <0.001 | | | 0.106 | |
| 0 | 7 | 1 | | 8 | 0 | | 8 | 0 | | 8 (4.7) |
| 1-2 | 30 | 1 | | 28 | 3 | | 30 | 1 | | 31 (18.1) |
| 3-4 | 103 | 29 | | 67 | 65 | | 112 | 20 | | 132 (77.2) |
| ypN | | | 0.034 | | | 0.034 | | | 0.118 | |
| 0 | 57 | 6 | | 49 | 14 | | 60 | 3 | | 63 (36.8) |
| 1 | 26 | 5 | | 20 | 11 | | 26 | 5 | | 31 (18.1) |
| 2 | 19 | 10 | | 14 | 15 | | 23 | 6 | | 29 (17.0) |
| 3 | 38 | 10 | | 20 | 28 | | 41 | 7 | | 48 (28.1) |
| ypTNM | | | 0.003 | | | <0.001 | | | 0.014 | |
| Ⅰ | 30 | 2 | | 30 | 2 | | 31 | 1 | | 32 (18.7) |
| Ⅱ | 40 | 3 | | 29 | 14 | | 41 | 2 | | 43 (25.1) |
| Ⅲ | 70 | 26 | | 44 | 52 | | 78 | 18 | | 96 (56.1) |
| Histological type | | | 0.255 | | | 0.961 | | | 0.333 | |
| Adenocarcinoma | 84 | 22 | | 64 | 42 | | 95 | 11 | | 106 (62.0) |
| Poorly cohesive carcinoma | 56 | 9 | | 39 | 26 | | 55 | 10 | | 65 (38.0) |
| Lauren classification | | | 0.006 | | | 0.150 | | | 0.618 | |
| Intestinal | 66 | 23 | | 49 | 40 | | 77 | 12 | | 89 (52.0) |
| Diffuse or Mixed | 74 | 8 | | 54 | 28 | | 73 | 9 | | 82 (48.0) |
| Grade of differentiation | | | 0.116 | | | 0.031 | | | 0.064 | |
| Well | 31 | 3 | | 26 | 8 | | 33 | 1 | | 34 (19.9) |
| Moderate or Poor | 109 | 28 | | 77 | 60 | | 117 | 20 | | 137 (80.1) |
| Vascular or lymphatic invasion | | | 0.327 | | | 0.016 | | | 0.075 | |
| No | 106 | 26 | | 86 | 46 | | 119 | 13 | | 132 (77.2) |
| Yes | 34 | 5 | | 17 | 22 | | 31 | 8 | | 39 (22.8) |
| Nervous invasion | | | 0.219 | | | 0.029 | | | 0.367 | |
| No | 108 | 27 | | 87 | 48 | | 120 | 15 | | 135 (78.9) |
| Yes | 32 | 4 | | 16 | 20 | | 30 | 6 | | 36 (21.1) |
| Adjuvant treatment | | | 0.037 | | | 0.320 | | | 0.693 | |
| No | 13 | 7 | | 10 | 10 | | 17 | 3 | | 20 (11.7) |
| Yes | 127 | 24 | | 93 | 58 | | 133 | 18 | | 151 (88.3) |
| Mandard TRG | | | <0.001 | | | <0.001 | | | 0.003 | |
| 1-2 | 57 | 1 | | 55 | 3 | | 57 | 1 | | 58 (33.9) |
| 3-5 | 83 | 30 | | 48 | 65 | | 93 | 20 | | 113 (66.1) |
| Note: UGEJ, upper third and gastroesophageal junction; TRG, tumor regression grade |
Table 2
Correlation between biomarkers before treatment and clinicopathological characteristics
| | CD10 | P-value | FAP | P-value | GPR77 | P-value | No. (%) |
| | - | + | - | + | - | + |
| Gender | | | 0.450 | | | 0.494 | | | 0.019 | |
| Male | 107 | 21 | | 101 | 27 | | 113 | 15 | | 128 (74.9) |
| Female | 38 | 5 | | 36 | 7 | | 43 | 0 | | 43 (25.1) |
| Age | | | 0.441 | | | 0.692 | | | 0.443 | |
| ༜65 | 113 | 22 | | 109 | 26 | | 122 | 13 | | 135 (78.9) |
| ≥65 | 32 | 4 | | 28 | 8 | | 34 | 2 | | 36 (21.1) |
| Tumor location | | | 0.372 | | | 0.073 | | | 0.496 | |
| Lower third | 73 | 16 | | 66 | 23 | | 81 | 8 | | 89 (52.0) |
| Middle third | 38 | 3 | | 38 | 3 | | 39 | 2 | | 41 (24.0) |
| UGEJ | 25 | 6 | | 26 | 5 | | 28 | 3 | | 31 (18.1) |
| Diffuse | 9 | 1 | | 7 | 3 | | 8 | 2 | | 10 (5.8) |
| Tumor size (cm) | | | 0.032 | | | 0.413 | | | 0.696 | |
| <5 | 60 | 5 | | 50 | 15 | | 60 | 5 | | 65 (38.0) |
| ≥5 | 85 | 21 | | 87 | 19 | | 96 | 10 | | 106 (62.0) |
| ypT | | | 0.411 | | | 0.155 | | | 0.467 | |
| 0 | 8 | 0 | | 5 | 3 | | 7 | 1 | | 8 (4.7) |
| 1-2 | 27 | 4 | | 28 | 3 | | 30 | 1 | | 31 (18.1) |
| 3-4 | 110 | 22 | | 104 | 28 | | 119 | 13 | | 132 (77.2) |
| ypN | | | 0.738 | | | 0.662 | | | 0.420 | |
| 0 | 53 | 10 | | 48 | 15 | | 59 | 4 | | 63 (36.8) |
| 1 | 28 | 3 | | 26 | 5 | | 29 | 2 | | 31 (18.1) |
| 2 | 25 | 4 | | 25 | 4 | | 27 | 2 | | 29 (17.0) |
| 3 | 39 | 9 | | 38 | 10 | | 41 | 7 | | 48 (28.1) |
| ypTNM | | | 0.506 | | | 0.972 | | | 0.014 | |
| Ⅰ | 29 | 3 | | 26 | 6 | | 30 | 2 | | 32 (18.7) |
| Ⅱ | 37 | 6 | | 34 | 9 | | 40 | 3 | | 43 (25.1) |
| Ⅲ | 79 | 17 | | 77 | 19 | | 86 | 10 | | 96 (56.1) |
| Histological type | | | 0.959 | | | 0.248 | | | 0.343 | |
| Adenocarcinoma | 90 | 16 | | 82 | 24 | | 95 | 11 | | 106 (62.0) |
| Poorly cohesive carcinoma | 55 | 10 | | 55 | 10 | | 61 | 4 | | 65 (38.0) |
| Lauren classification | | | 0.293 | | | 0.005 | | | 0.235 | |
| Intestinal | 73 | 16 | | 64 | 25 | | 79 | 10 | | 89 (52.0) |
| Diffuse or Mixed | 72 | 10 | | 73 | 9 | | 77 | 5 | | 82 (48.0) |
| Grade of differentiation | | | 0.091 | | | 0.012 | | | 0.991 | |
| Well | 32 | 2 | | 22 | 12 | | 31 | 3 | | 34 (19.9) |
| Moderate or Poor | 113 | 24 | | 115 | 22 | | 125 | 12 | | 137 (80.1) |
| Vascular or lymphatic invasion | | | 0.637 | | | 0.305 | | | 0.309 | |
| No | 111 | 21 | | 108 | 24 | | 122 | 10 | | 132 (77.2) |
| Yes | 34 | 5 | | 29 | 10 | | 34 | 5 | | 39 (22.8) |
| Nervous invasion | | | 0.187 | | | 0.692 | | | 0.222 | |
| No | 117 | 18 | | 109 | 26 | | 125 | 10 | | 135 (78.9) |
| Yes | 28 | 8 | | 28 | 8 | | 31 | 5 | | 36 (21.1) |
| Adjuvant treatment | | | 0.525 | | | 0.989 | | | 0.836 | |
| No | 16 | 4 | | 16 | 4 | | 18 | 2 | | 20 (11.7) |
| Yes | 129 | 22 | | 121 | 30 | | 138 | 13 | | 151 (88.3) |
| Mandard TRG | | | 0.030 | | | 0.067 | | | 0.233 | |
| 1-2 | 54 | 4 | | 51 | 7 | | 55 | 3 | | 58 (33.9) |
| 3-5 | 91 | 22 | | 86 | 27 | | 101 | 12 | | 113 (66.1) |
| Note: UGEJ, upper third and gastroesophageal junction; TRG, tumor regression grade |
3. Relationships Between Biomarkers And Other Clinicopathological Characteristics
The relationships between biomarkers after treatment and other clinicopathological characteristics are shown in Table 1. Post-CD10 and post-FAP were related to tumor size (p=0.006, p=0.002, respectively), ypT (p=0.047, p<0.001, respectively), and ypN (p=0.034, p=0.034, respectively). Post-CD10, post-FAP and post-GPR77 were related to TNM stage (p=0.003, p<0.001, p=0.014, respectively).
The relationships between biomarkers before treatment and other clinicopathological characteristics are shown in Table 2. Pre-CD10 was related to tumor size (p=0.032), while pre-FAP was not (p=0.413). None of biomarkers before treatment were related to ypT and ypN. Only pre-GPR77 was related to ypTNM (p=0.014).
4. Predictive Value Of Biomarkers To Pathological Response
In univariable analysis for pathological response, for biomarkers after treatment, post-CD10 (odds ratio [OR], 20.602; p=0.003), post-FAP (OR, 24.826; p<0.001), and post-GPR77 (OR, 12.258; p=0.016) were predictors to pathological response. However, for biomarkers before treatment, only pre-CD10 (OR, 3.264; p=0.038) were related to pathological reaction (Table 3).
Table 3
Univariable analysis for pathological response
| Variable | OR (95%CI) | P |
| Gender (Female) | 0.721 (0.353, 1.474) | 0.370 |
| Age (≥65yr) | 0.760 (0.355, 1.626) | 0.479 |
| Tumor location | | 0.444 |
| UGEJ | 1 | |
| Middle third | 0.892 (0.344, 2.313) | 0.814 |
| Lower third | 1.450 (0.618, 3.401) | 0.393 |
| Diffuse | 2.526 (0.457, 13.964) | 0.288 |
| Tumor size (≥5cm) | 6.052 (3.052, 12.101) | <0.001 |
| ypN | | <0.001 |
| 0 | 1 | |
| 1 | 1.429 (0.600, 3.404) | 0.420 |
| 2 | 6.452 (2.012, 20.690) | 0.002 |
| 3 | 4.473 (1.861, 10.753) | <0.001 |
| ypTNM (III) | 6.364 (3.147, 12.869) | <0.001 |
| Histological type | 2.275 (1.135, 4.559) | 0.020 |
| Lauren classification | 1.663 (0.874, 3.162) | 0.121 |
| Grade of differentiation | 4.336 (1.986, 9.599) | <0.001 |
| Vascular or lymphatic invasion | 3.575 (1.400, 9.127) | 0.008 |
| Nervous invasion | 4.007 (1.466, 10.956) | 0.007 |
| Adjuvant therapy | 0.616 (0.212, 1.789) | 0.374 |
| Post-treatment | | |
| CD10 (+) | 20.602 (2.731, 155.415) | 0.003 |
| FAP (+) | 24.826 (7.326, 84.128) | <0.001 |
| GPR77 (+) | 12.258 (1.601, 93.825) | 0.016 |
| Pre-treatment | | |
| CD10 (+) | 3.264 (1.068, 9.976) | 0.038 |
| FAP (+) | 2.287 (0.929, 5.629) | 0.072 |
| GPR77 (+) | 2.178 (0.589, 8.049) | 0.243 |
| Note: UGEJ, upper third and gastroesophageal junction |
For other clinicopathological factors, tumor size (OR, 6.502; p<0.001), ypN (OR, 4.473; p<0.001), ypTNM (OR, 6.364; p<0.001), histological type (OR, 2.275; p=0.020), grade of differentiation (OR, 4.436; p<0.001), vascular or lymphatic invasion (OR, 3.575; p=0.008), nervous invasion (OR, 4.007; p=0.007) were related to pathological response (Table 3).
Four groups of biomarkers were included in multivariable analyses for pathological response respectively, with other statistically significant factors. Post-FAP (OR, 12.805; p<0.001) and pre-FAP (OR, 5.672; p=0.009) were independent predictors for pathological response, respectively, while CD10 and GPR77 were not (Table 4).
Table 4
Multivariable analysis for pathological response
| Variable | OR (95%CI) | P |
| Post-treatment | | |
| CD10 (+) | 8.044 (0.603, 107.347) | 0.115 |
| FAP (+) | 12.805 (3.129, 52.406) | <0.001 |
| GPR77 (+) | 1.694 (0.149, 19.232) | 0.671 |
| Pre-treatment | | |
| CD10 (+) | 1.411 (0.364, 5.473) | 0.619 |
| FAP (+) | 5.672 (1.529, 21.046) | 0.009 |
| GPR77 (+) | 0.920 (0.177, 4.769) | 0.921 |
| Note: All factors with p < 0.05 in univariable analysis except ypTNM were included. Biomarkers after treatment (post-) and before treatment (pre-) were included in multivariable analysis respectively. |
5. Prognostic Value Of Biomarkers
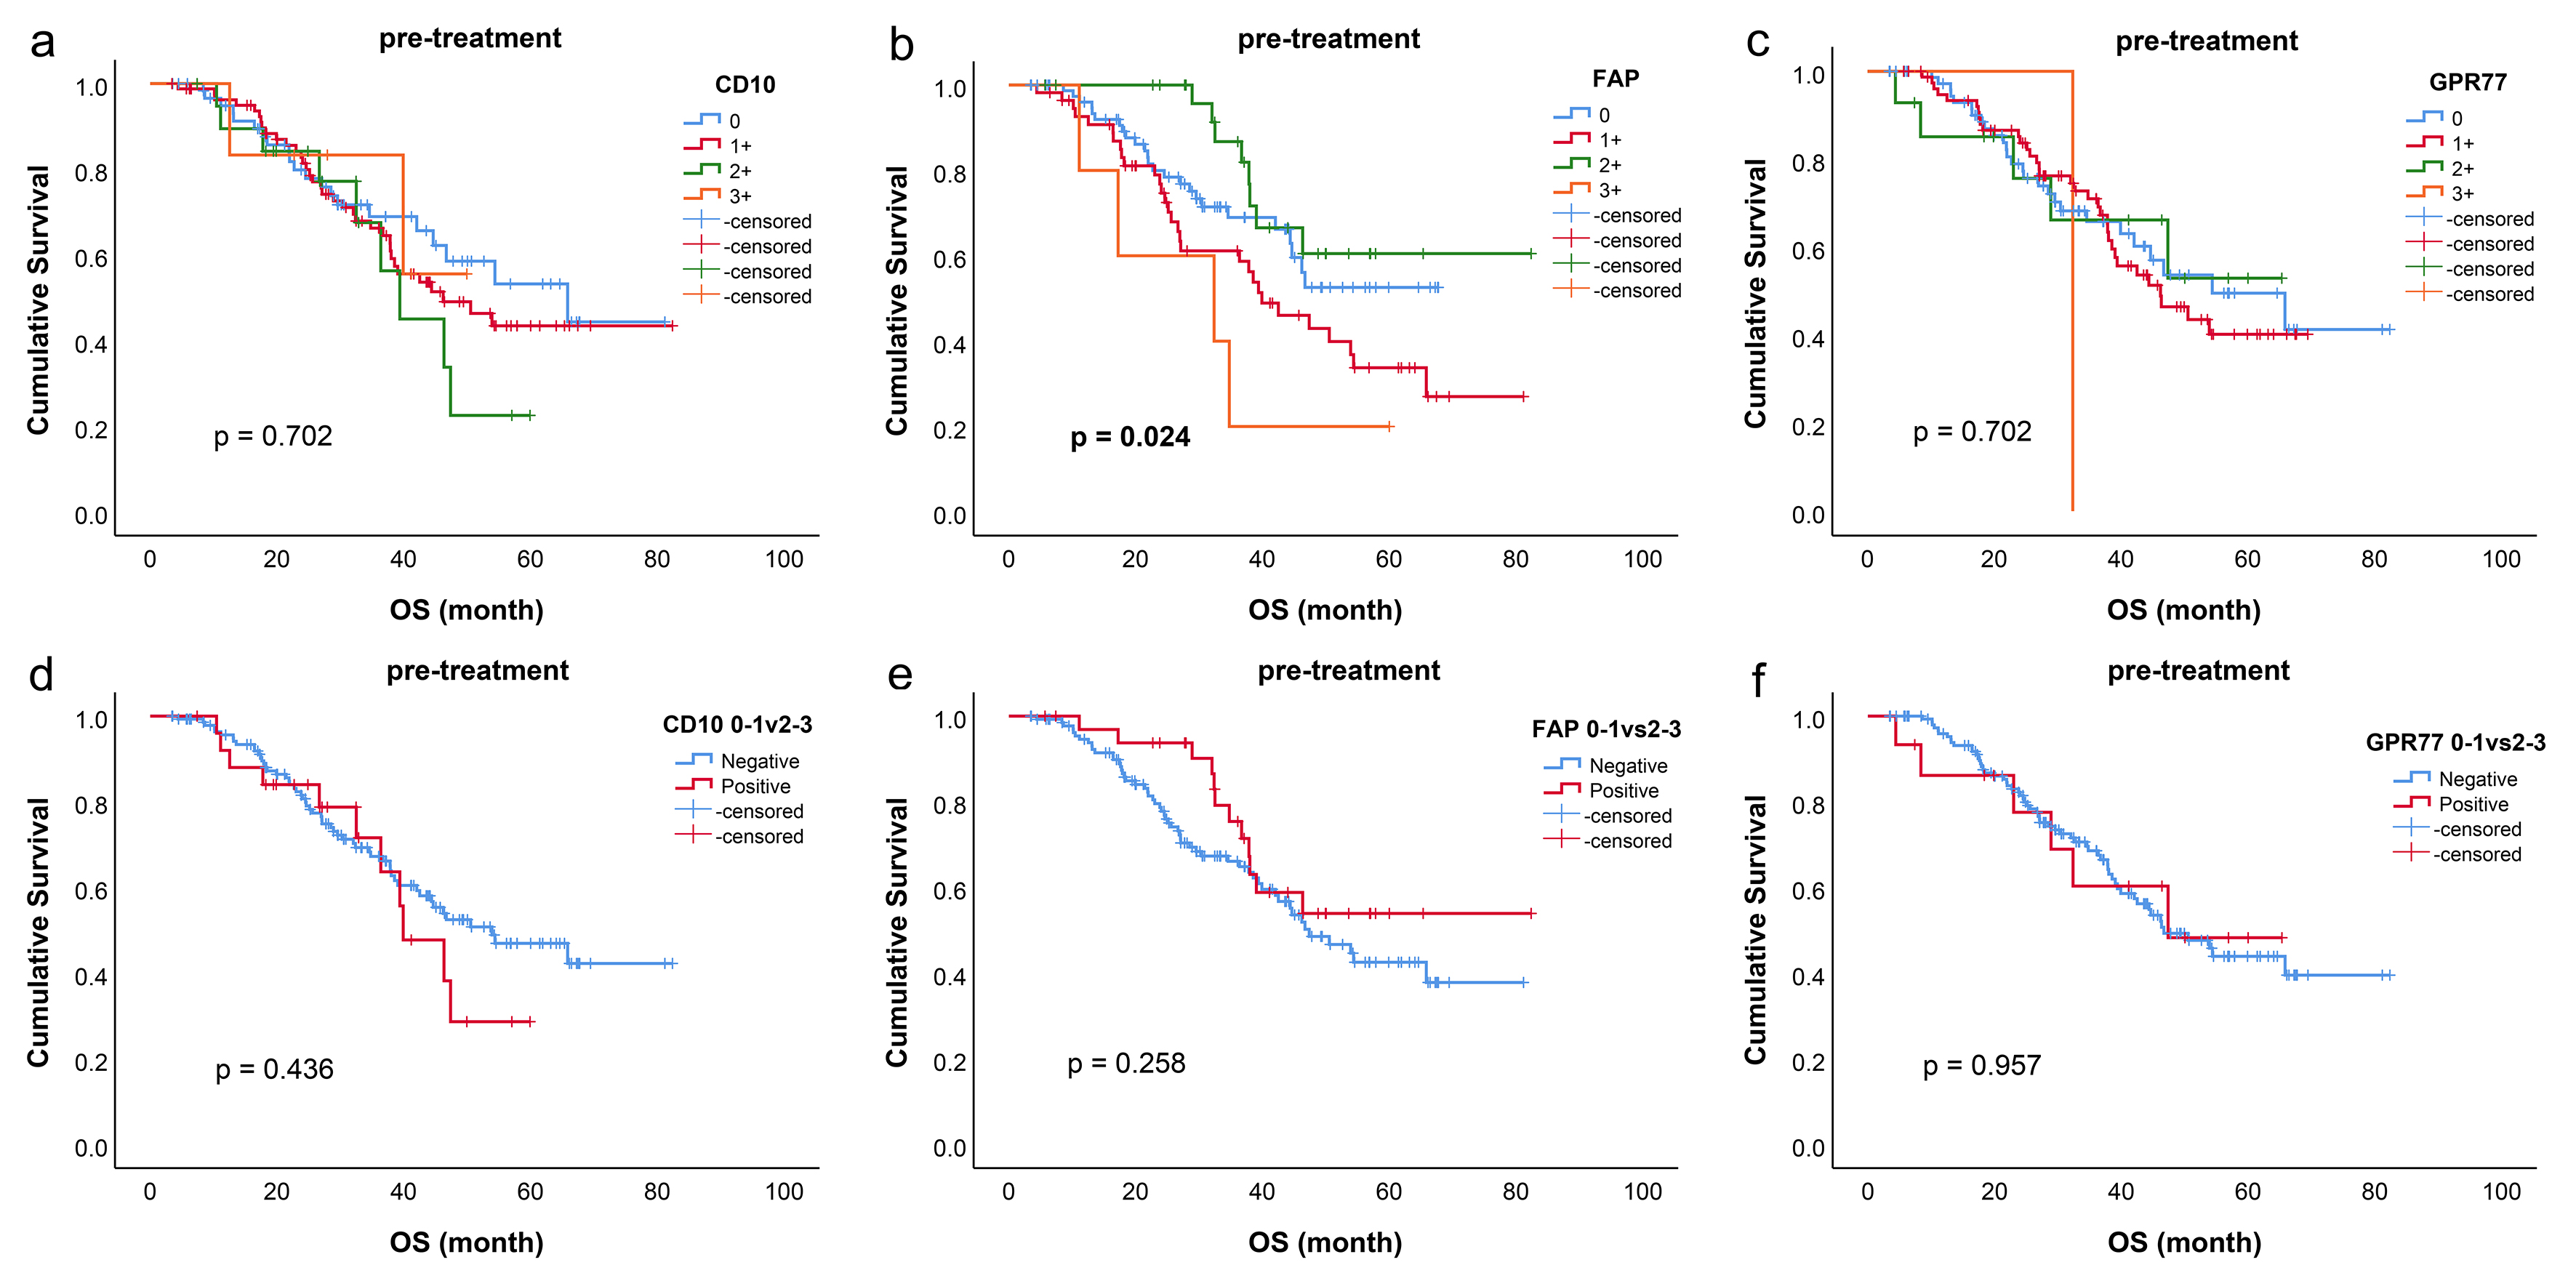
The survival curves of all biomarkers after treatment were shown in Fig. 4. When divided into two groups, post-CD10 (p=0.030), post-FAP (p=0.011) were related to OS (Fig. 4). However, for biomarkers before treatment, only pre-FAP was related to OS (p=0.024) (Additional file 2).
In univariable analysis for OS, post-CD10 (hazard ratio [HR], 1.832; p=0.032), post-FAP (HR, 1.843; p=0.013) were related to the prognosis. None of biomarkers before treatment were related to the prognosis (all p > 0.05) (Table 5).
Table 5
Univariable analysis for overall survival
| Variable | HR (95%CI) | P |
| Gender (Female) | 1.474 (0.852, 2.550) | 0.165 |
| Age (≥65yr) | 1.402 (0.816, 2.406) | 0.221 |
| Tumor location | | 0.008 |
| UGEJ | 1 | |
| Middle third | 2.227 (0.936, 5.301) | 0.070 |
| Lower third | 1.405 (0.619, 3.189) | 0.417 |
| Diffuse | 4.539 (1.637, 12.581) | 0.004 |
| Tumor size (≥5cm) | 3.092 (1.684, 5.680) | <0.001 |
| ypT | | 0.001 |
| 0 | 1 | |
| 1-2 | 0.810 (0.084, 7.791) | 0.885 |
| 3-4 | 6.235 (0.864, 45.012) | 0.070 |
| ypN | | <0.001 |
| 0 | 1 | |
| 1 | 3.280 (1.456, 7.390) | 0.004 |
| 2 | 2.928 (1.264, 6.783) | 0.012 |
| 3 | 8.676 (4.192, 17.956) | <0.001 |
| ypTNM (Ⅲ) | 4.442 (2.456, 8.036) | <0.001 |
| Histological type | 1.167 (0.716, 1.904) | 0.535 |
| Lauren classification | 1.925 (1.178, 3.144) | 0.009 |
| Grade of differentiation | 2.733 (1.303, 5.731) | 0.008 |
| Vascular or lymphatic invasion | 1.901 (1.126, 3.210) | 0.016 |
| Nervous invasion | 1.256 (0.716, 2.206) | 0.427 |
| Mandard TRG (3-5) | 2.861 (1.557, 5.260) | 0.001 |
| Post-treatment | | |
| CD10 (+) | 1.832 (1.053, 3.189) | 0.032 |
| FAP (+) | 1.843 (1.139, 2.983) | 0.013 |
| GPR77 (+) | 1.329 (0.657, 2.690) | 0.429 |
| Pre-treatment | | |
| CD10 (+) | 1.293 (0.676, 2.475) | 0.437 |
| FAP (+) | 0.698 (0.373, 1.305) | 0.260 |
| GPR77 (+) | 0.977 (0.422, 2.265) | 0.957 |
| Note: UGEJ, upper third and gastroesophageal junction; TRG, tumor regression grade |
In multivariable analysis, four groups of biomarkers were included respectively. None of biomarkers were independent factors for OS (all p > 0.05) (Table 6).
Table 6
Multivariable analysis for overall survival
| Variable | HR (95%CI) | P |
| Post-treatment | | |
| CD10 (+) | 1.929 (0.899, 4.140) | 0.092 |
| FAP (+) | 0.755 (0.371, 1.536) | 0.439 |
| GPR77 (+) | 1.007 (0.440, 2.302) | 0.988 |
| Pre-treatment | | |
| CD10 (+) | 1.453 (0.725, 2.910) | 0.292 |
| FAP (+) | 0.604 (0.295, 1.237) | 0.168 |
| GPR77 (+) | 1.099 (0.438, 2.758) | 0.840 |
| Note: All factors with p < 0.05 in univariable analysis except ypTNM were included. Biomarkers after treatment (post-) and before treatment (pre-) were included in multivariable analysis respectively. |