Ischemic stroke induction by MCAO and reperfusion
Male C57BL/6J mice weighing 28–32 g were purchased from the Center for Laboratory Animals, Soochow University (Suzhou, China), and housed in a specific pathogen-free facility under ambient conditions. All procedures were performed according to the guidelines of the Institutional Animal Care and Use Committee of Soochow University. Ischemic stroke was induced by middle cerebral artery occlusion (MCAO) with subsequent reperfusion (MCAO/R) as previously described [13]. Briefly, the mice were anesthetized with an intraperitoneal injection (i/p) of 4% chloral hydrate (350 mg/kg). A 7-0 nylon suture with its tip coated with poly-lysine was inserted into the right common carotid artery and advanced through the internal carotid artery until it occluded the origin of the MCAO. After 90 min of occlusion, cerebral blood flow was reinstated by withdrawing the suture. Body temperature was maintained during and after the surgery within the normothermic range (37±0.5°C) by placing the mice on a heating pad (Institute of Biomedical Engineering, CAMS, BME-412A ANIMAL REGULATOR, 308005669) until the effects of anesthesia wore off. The mice were intraperitoneally injected with anti-TNF-α antibody (20μg/g, #11969, CST, USA) or vehicle at the onset of reperfusion. Behavioral outcomes were evaluated 24h after I/R injury and the mice were euthanized with an intraperitoneal injection of pentobarbital sodium. The brains were removed, and the forebrain region was divided into five coronal sections using a mice brain matrix (Harvard apparatus). The sections were stained with 2% 2,3,5-triphenyltetrazolium chloride (TTC, Sigma) [14], and the infarction volume (% of the ipsilateral volume) was calculated using the Image J system.
Behavioral tests
Neurological function was evaluated by behavioral tests as previously described [14]. The animals were scored on a 6-point scale for neurological deficits [15] as follows: 0 – no detectable neurological deficits, 1 – ptosis of the eyelid ipsilateral to the occluded MCA side and/or failure to extend ipsilateral forepaw, 2 – persistently walking in large circles toward the ipsilateral side, 3 – persistently walking in small circles and/or rolling over repeatedly towards the ipsilateral side, 4 – lying nearly motionless on the contralateral side, and 5 – death post-recovery. Cylinder test was performed to assess the asymmetric use of forelimbs for postural support. Briefly, the mice were placed inside a plexiglass cylinder (HOOFAN, Wenling, Zhejiang) and forelimb use was observed during their vertical movements along the wall. The final score was calculated as (non-impaired forelimb movement – impaired forelimb movement)/(non-impaired forelimb movement + impaired forelimb movement + movement of both forelimbs) [16]. Twenty movements were recorded during the 10-min test.
Whole transcriptome library preparation and RNA-sequencing
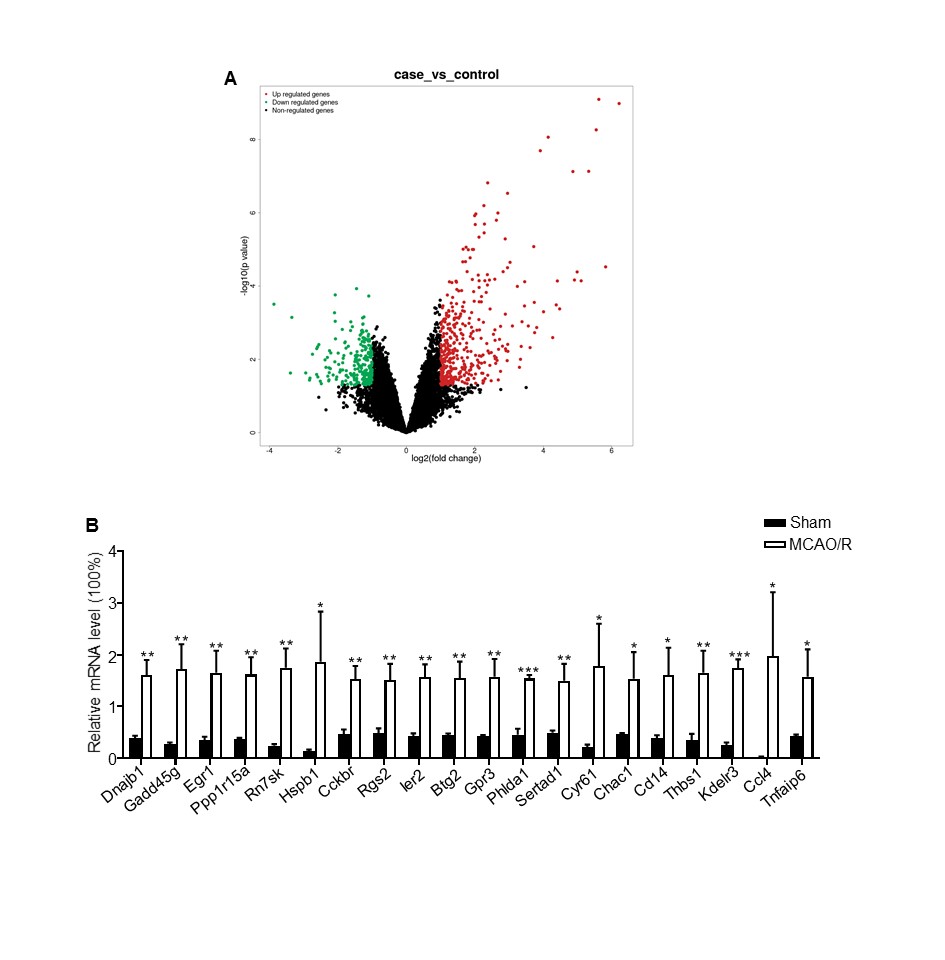
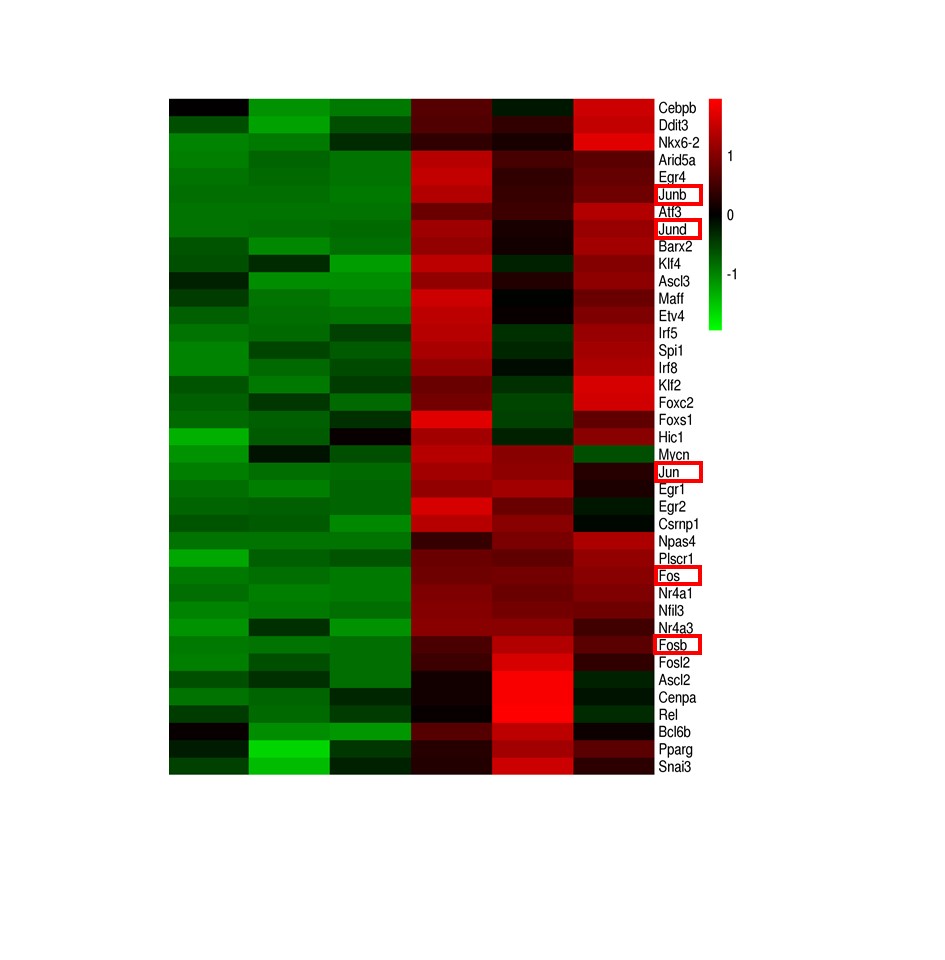
Total RNA was isolated from the ipsilateral and contralateral cortices (n=3) using the RNeasy Plus Mini Kit (QIAGEN), and the quality was assessed by Agilent 2100 BioAnalyzer according to the manufacturer's instructions. Two micrograms of RNA per sample was used for library construction. Ribosomal RNA (rRNA) was first removed by an Epicenter Ribo-zero rRNA Removal Kit (Epicenter, USA) according to the manufacturer's instructions. Subsequently, strand-specific libraries were generated from the purified RNA by the dUTP method using NEB Next Ultra Directional RNA Library Prep Kit for Illumina (NEB, USA) as per the manufacturer's recommendations. RNA-seq was performed on the Illumina HiSeq 2000 platform, and 100-bp paired-end reads were generated according to the Illumina protocol. The adapter sequences were removed from the raw data, and the individual libraries were converted to the FASTQ format. Sequence reads were aligned to the mouse genome (mm10) with TopHat2 (v2.0.9), and the alignment files were reconstructed with Cufflinks (v2.1.1) and Scripture (beta2). All sequences were annotated using the RefSeq database (build 37.3). The read counts of each transcript were normalized to its length and to the total number of mapped fragments per sample, and were expressed as fragments per kilobase million (FPKM). The differentially expressed genes (DEGs) between the treatment and control groups were screened using adjusted P-value < 0.05 (Student's t test with Benjamini-Hochberg false discovery rate (FDR) adjustment) as the cutoff. The DEGs were functionally annotated by gene ontology (GO) analysis using the GO-seq R package [17] after correcting the gene length bias was corrected. The pathways significantly associated with the DEGs were identified by Kyoto Encyclopedia of Genes and Genomes (KEGG) analysis using the KOBAS software.
Quantitative real time PCR (qPCR)
Total RNA was extracted from the ipsilateral and contralateral cortex of three mice using the QIAGEN miRNeasy Mini kit (217004, Qiagen, Germany), and reverse transcribed using the Takara PrimeScript™ RT Master Mix (RR036A, Takara, Japan). The cDNA templates were amplified by qPCR using the brilliant SYBR green PCR master mixture (4913914, Roche, Switzerland) in LightCycler 480 (Roche, Switzerland). The target mRNA expression levels were normalized to that of glyceraldehyde-3-phosphate dehydrogenase (GAPDH) and the relative fold change was calculated by the 2-ΔΔCT method. The primer sequences are listed in Supplementary Table S1.
Primary cortical astrocyte culture
Cortical astrocytes were cultured as previously described [18]. Cerebral cortices were isolated 1- or 2-day-old C57BL/6J mice, mechanically dissociated and digested with trypsin/DNase treatment, and passed through a sterile 40lm Nitex mesh. The astrocytes were suspended in DMEM/F12 (1:1) (GIBCO, 11330) supplemented with 10% heat-inactivated fetal bovine serum (FBS; GIBCO, 10099) and 1% 100 U/ml penicillin/streptomycin (Beyotime, C0222), and seeded into culture dishes or plates coated with poly-L-lysine. The cells were cultured at 37°C in a humidified atmosphere with 5% CO2.
Oxygen and glucose deprivation and re-oxygenation (OGD/R)
OGD/R was used to mimic I/R injury in vitro [18]. Briefly, the cells were washed twice with PBS, and cultured in glucose-free DMEM (GIBCO, 11966) under hypoxic conditions (95% N2 and 5% CO2) for 6h, and then in complete DMEM/F12 under normoxic conditions for 24h. Anti-TNF-α antibodies (10ng/ml, #11969, CST, USA) or vehicle was administrated during reoxygenation.
Enzyme-linked immunosorbent assay (ELISA)
TNF-α levels in culture medium, serum and brain homogenates were measured using the mouse (PT512, Beyotime, China) and human (PT518, Beyotime, China) TNF-α ELISA kits according to the manufacturer’s instructions. The optical densities of the plates were read at 450 nm using a spectrophotometer (Bio-Rad Laboratories, Hercules, CA, USA). All steps were performed at room temperature and samples were analyzed in triplicates.
Immunohistochemistry (IHC)
IHC was performed as previously described [18]. Briefly, the mice were anesthetized with 4% chloral hydrate (350 mg/kg) and perfused with PBS and then 4% paraformaldehyde through the left cardiac ventricle. The brains were removed and fixed in 4% paraformaldehyde at 4°C for 24h, immersed in phosphate buffer containing 20% or 30% sucrose, and sliced into 10-mm-thick sections using a cryostat. The sections were rinsed with PBS for 15 min, blocked with 1% bovine serum albumin (BSA) in 0.3% Triton X-100 for 1h, and then incubated overnight with mouse anti-CD42d (1:100, AF6990, R&D, USA), mouse anti-TNF-α (1:100, ab1793, Abcam, USA) and rabbit anti-GFAP (1:500, AB5804, Millipore, USA) antibodies. After washing with PBS, the sections were incubated with Alexa Fluor 488 donkey anti-sheep IgG(H+L) (1:200, A-11015, Invitrogen, USA), Alexa Fluor 488 sheep anti-mouse IgG (H+L) (1:500, AB150113, Abcam, USA) and Alexa Fluor 647 donkey anti-rabbit IgG(H+L) (1:500, AB150063, Abcam, USA) secondary antibodies for 1h at room-temperature in the dark. The sections were counterstained with DAPI (1: 10,000, D9564, Sigma), dried and mounted with coverslips. Images were obtained with a confocal microscope (LSM 710, Carl Zeiss Co. Ltd., Oberkochen, Germany).
Platelet isolation and aggregation
Mouse blood was diluted 1:5 with an anti-coagulant (65 mM Na3 citrate, 70 mM citric acid, 100 mM dextrose, pH 4.4), and centrifuged at 900 rpm for 20 min to obtain the platelet-rich plasma (PRP) [19]. The PRP was then loaded into SepharoseTM2B column, the platelets were eluted using Tyrode’s buffer [16]. The gel-filtered platelets were pooled, and the count was adjusted to 2.5×10⁸/mL in Tyrode’s buffer. Platelet aggregation was performed in a ChronoLog aggregometer (Havertown, PA, USA). Aggregation studies were performed using washed platelets prepared and suspended in Tyrode’s buffer to which calcium (1 mM) was added as described previously. The percentage of aggregation was calculated using thrombin (1060240001, Sigma, USA) or U46619 (538994, Calbiochem, USA) from the amplitude of the tracings at 5 minutes and normalized to the response of the untreated control within an individual experiment.
Platelet spreading on immobilized fibrinogen
Chamber slides with microtiter wells were coated overnight with 10μg/mL human fibrinogen (F4884, Calbiochem, USA) in 0.1M NaHCO3 (pH 8.3) at 4°C. Washed platelets (2×10⁷/mL) were allowed to adhere to and spread on fibrinogen-coated wells at 37°C for 2h in the presence of thrombin (1060240001, Sigma, USA). The cells were washed once, fixed, permeabilized, and stained with Alexa Fluor 488-conjugated phalloidin (A12379, Life Technologies, USA). The adherent platelets were viewed with an Olympus FluoView FV1000 confocal microscope, and images were acquired. The area traversed by individual platelets was measured using ImageJ2x software, with pixel number as the unit of size. Ten randomly selected fields from at least three different tests were used for statistical analysis.
Clot Retraction
Washed mouse platelets (4×10⁸/mL) were resuspended in modified Tyrode’s buffer in unused aggregometer tubes and mixed with 150μg/mL purified human fibrinogen. Clotting was initiated in the presence of 1 U/mL thrombin at 37°C for 60 min. Clot retraction was monitored every 5 min and photographed, and clot size was measured using Image J2x software.
Immunoblotting
Protein was extracted from platelets or brain homogenates using RIPA buffer supplemented with protease inhibitor, and quantified using the bicinchoninic acid (BCA) (23227, Thermo, USA) kit. Equal amounts of protein per sample were separated by 8% SDS-PAGE, transferred to a nitrocellulose membrane, and incubated overnight with antibodies targeting p-RIP1 (Ser166, 1:1000, 53286, CST, USA) , RIP1 (1:1000, ab202985, Abcam, USA) p-RIP3 (Ser232, 1:1000, ab195117, Abcam, USA), RIP3 (1:1000, ab62344, Abcam, USA), p-AKT (Ser 473, 1:1000, 4060T, CST, USA), AKT (1:1000, 4691S, CST, USA), Fosb ( 1:1000, ab11959, Abcam, USA), Jun (1:1000, ab40766, Abcam, USA), Jund (1:1000, ab181615, Abcam, USA), Fos ( 1:1000, ab222699, Abcam, USA), Junb (1:1000, 128878, Abcam, USA) and β-actin (1:5000, A5441, Sigma) in Tris buffered saline containing 0.2% Tween-20 (TBST) and 5% nonfat dry milk at 4°C. After washing with TBST, the membranes were incubated with 1μg/ml goat anti-rabbit IRDye 800CW or goat anti-mouse IRDye 800CW (Licor Odyssey, USA). The positive bands were detected using the Odyssey infrared imaging system (LI-COR Biosciences, USA), and the signal intensity was quantified using Image J software and normalized to that of β-actin.
Luciferase reporter assay
HEK293T cells (Cell Bank of Chinese Academy of Sciences, Shanghai, China) were cultured in DMEM supplemented with 10% FBS (HyClone, Utah, USA) at 37°C in a humidified incubator under 5% CO2 (Thermo Forma Electron Co., Ohio, USA). The −2000/−1 bp region of TNF-α gene was cloned into the luciferase reporter vector (Luc) GV238 into the Xho I and Kpn I sites. HEK 293 T cells were seeded in 96-well plates, and co-transfected 12h later with 0.1μg TNF-α pro-Luc or empty Luc plasmid (empty-Luc) and 0.1μg Fos-GV230), Jund-GV230, c-Jun-GV230 or empty-GV230 in the presence of Lipofectamine 3000 (Cat#L3000150, Invitrogen, California, USA). The signals were measured using the dual luciferase reporter assay system (Cat#E1500, Promega, Wisconsin, USA).
Online database analysis
Sequencing results of TNF-α gene were analyzed using the BLAT Tool (UCSC Genome Browser, http:// genome-euro.ucsc.edu/). The putative transcription factors of TNF-α were predicted using the PROMO alggen database (http://alggen.lsi.upc.es/cgibin/promo_v3/promo/promoinit.cgi?dirDB=TF_8.3/) within a dissimilarity margin ≤5%.
Statistical analysis
GraphPad Prism 5 was used for statistical analysis. Data are expressed as the mean ± standard deviation (SD) of at least three independent experiments unless otherwise indicated. One-way ANOVA and Tukey’s test were used to compare multiple groups, and two-tailed Student’s t test for used for comparing two groups. P < 0.05 was considered statistically significant.