G-quadruplex-forming motifs in all Laveranian genomes are associated with var genes
In the P. falciparum genome, a search for putative quadruplex-forming sequences (PQSs) using QGRS Mapper was published in 2016, finding 80 PQSs, of which 35 were var-associated [21]. We repeated the search for PQSs in all members of the Laveranian subgenus, including P. falciparum, using two PQS prediction tools, QGRS Mapper and G4 Hunter (Fig. 2a). For QGRS Mapper, we used the same parameters as the previous publication (regex: , max length: 45, min G-group: 3, loop size: 0-11). Thus, only ‘canonical’ sequences were identified, with a moderately relaxed loop size of up to 11 nucleotides. For G4 Hunter, we used the following parameters: threshold: 1.7, window size: 25, csv data: grouped. This is considered a stringent threshold, at which the ‘precision’ of G4 Hunter (i.e. the proportion of genuine G4-forming sequences that are designated as such) should be similar to that of QGRS Mapper; the false positive rate is extremely low and the false negative rate is accordingly high (~50% of 392 experimentally-confirmed G4-forming sequences were identified at this threshold) [25].
Consistent with the methodology of the 2016 study, we then sought PQSs that were either inside a var coding sequence or within 2 kb upstream or downstream of a var gene (and with no other nearer gene): these were defined as var-gene-associated PQSs. PQSs found in telomere repeats (GGGTT(C/T)A), which comprise the majority of PQSs in any Plasmodium genome, were treated separately and never considered var-associated.
Despite having similar genome sizes and similar G/C contents (Additional file 1: Table S1), the numbers of PQSs in the Laveranian genomes varied widely: 60±32 with QGRS Mapper and 138±91 with G4 Hunter (Fig. 2a, Additional file 2: Table S2). Importantly, this was not simply due to differences in how extensively telomere repeats had been assembled in the different genomes, because these repeats were excluded. On average, the Clade B Laverania had more PQSs than the Clade A species (Welch’s t-test, two-tailed, QGRS Mapper: t-stat=6.03, p=0.0025; G4 Hunter: t-stat=2.63, p=0.047). Members of the subgenus differed in their proportions of var-associated PQSs (QGRS Mapper: 23±11.2%, G4 Hunter: 43±14.9%) (Fig. 2b), but these differences did not seem to map onto any particular evolutionary pattern. The differences could not be accounted for by differential G/C content within the var families, as this was similar throughout the subgenus (Additional file 1: Table S1). Despite the differences, however, all Laveranian species demonstrated a significant co-distribution of PQSs and var genes, compared to the expected distribution in a simulated genome in which var genes and PQSs occur at random (Additional file 3: Table S3). Indeed, in P. falciparum the QGRS Mapper algorithm found PQSs associated with 43% of var genes and the G4 Hunter algorithm (which tends to find more PQSs than QGRS Mapper) found PQSs in 70% of all var genes – even when very stringently applied. This percentage would rise markedly if less stringent thresholds were applied so the great majority of var genes might reasonably be predicted to encode putative G4(s).
Overall, this confirms that the co-distribution of PQSs with var genes, previously reported only in two closely related Laveranian species separated by ~0.19 million years, P. falciparum and P. reichenowi [21], is actually conserved across all available Laveranian genomes, spanning at least 1 million years of evolutionary time [5]. Furthermore, in P. falciparum it was clear that many more PQSs were maintained in real var genes than in pseudogenes (Additional file 2: Table S2), adding further weight to the hypothesis that PQSs are positively selected in functional var genes.
Some arrangements of var-associated PQSs are conserved in Laveranian genomes, but PQSs in upsB-var promoters are unique to P. falciparum
We further investigated the relationship between PQSs and var genes in the Laverania by searching for conserved arrangements of PQSs in and near var genes. First, we noted that in all genomes, the majority of var-associated PQSs were within coding regions (Fig. 3a and 3b, orange bars), though this proportion varied from approximately 60% in P. falciparum to nearly 100% in other species (QGRS Mapper data, Fig. 3a). This bias towards the coding regions of var genes was stronger than the genome-wide bias for PQSs to appear in coding regions (Fig. 3a and 3b, blue bars). Additionally, most of the coding var-PQSs were on the antisense strand (Fig. 3c). Given that there was no apparent strand bias for PQSs overall – either in the genomes as a whole, or in the non-coding UTRs of var genes – this pattern appeared to be specific to the coding location within the var gene.
Next, we analyzed the per-var distribution of PQSs, since it was clear that some var genes contained more than one PQS (this is statistically unlikely in these extremely PQS-poor genomes, and emphasizes the apparent evolutionary pressure to maintain PQSs associated with var genes). We therefore determined whether var genes were more likely to have multiple PQSs within them in some species than in others (Fig. 4). Most species tended to have one or two PQSs per var, and G4 Hunter predicted more PQSs per var than QGRS Mapper, in line with the general trend (seen in figure 2). Furthermore, the data from G4 Hunter suggested that the Laveranian species may be evolving towards having more PQSs per var, as the majority of vars in the Clade A Laverania had one PQS, whereas the Clade B Laverania had a higher proportion of several-PQS var genes. P. blacklocki, which falls within Clade B but is the most evolutionary ancient in this clade, and thus ‘closest’ to Clade A, has a PQS distribution more closely resembling that seen in the Clade A var genes.
In their previous search for PQSs in P. falciparum and P. reichenowi, Stanton et al. reported that almost half of the var-associated PQSs in P. falciparum were located upstream of upsB-type var genes (an observation first made by Smargiassio et al. [15]), whereas this group was entirely absent in P. reichenowi, and almost all of the var-associated PQSs in P. reichenowi were coding [21]. We repeated this analysis for the newly published Laveranian genomes to determine whether the clustering of PQSs in upsB-var promoters was unique to P. falciparum. In our analysis, most var-PQSs in P. falciparum were indeed associated with upsB-type genes (62% and 44% of the total var-PQSs with QGRS Mapper and G4 Hunter, respectively), in concordance with the findings of Stanton et al. [21]. Other Laveranian species, including P. reichenowi, did have some upsB-var-PQSs, but they constituted less than 20% of the total (Additional file 4: Figure S1), and were usually in coding regions rather than 5’ UTRs (Fig. 5). Finally, we noticed a prominent cluster of PQSs in most Clade-B species that was located ~5kb downstream of upsB-var start codons (Fig. 5). Thus, there is evidently a conserved bias in the location of PQSs within the coding sequences of these genes, but the non-coding PQSs are not conserved and appear to be unique to P. falciparum.
G-quadruplex-forming motifs in Laveranian genomes are not strongly associated with other multigene families
Stanton et al. previously reported an association between PQSs and pir genes in P. berghei [21], suggesting that PQSs could be co-distributed with variantly expressed virulence gene families in addition to var. The var gene family is uniquely present among Laverania, but other more ancient multigene families including pir, which may also have roles in virulence, have not been lost in these species: they still exist in varying numbers alongside the var genes. These other gene families are also highly variable in number: for example, some early Laverania have very few pirs, whereas P. falciparum has several hundred, but the early species instead have 30+ clags, whereas P. falciparum has only five [5]. We sought to establish whether any of these other families might be associated with G4s, and whether any evolutionary pattern could thus be discerned.
We searched the Laveranian genomes for co-distributions of PQSs with other multigene families, including clag, PHIST, pir, rifin, and stevor. Surprisingly, we found very few PQSs in these gene families (Additional file 5: Figure S2 and Additional file 6: Table S4). Neither algorithm predicted any PQSs in stevor genes. The clag family showed a weak association with PQSs in P. blacklocki, which has a large clag family (2 out of 35 clags, i.e, 6%, had PQSs), and also in P. billcollinsi and P. reichenowi, which have smaller clag families (1 PQS amongst 7 and 6 clags respectively), while the PHIST family was moderately associated with PQSs in P. gaboni, P. adleri, P. billcollinsi, and P. praefalciparum (PQSs were found in 1 or 2 genes, representing 12.5%, 22%, 20%, and 8% of the total PHIST genes in each species, respectively). Additionally, some species had PQSs in a few pir genes and/or rifin genes, but the proportions were always small compared to the total sizes of the gene families. In all cases, the PQSs found in non-var multigene families were almost all found by G4 Hunter but not by QGRS Mapper, indicating that they are probably of non-canonical types. This is in contrast to the var-associated PQSs, many of which are canonical (Fig. 2).
Numbers and distributions of G-quadruplex-forming motifs vary significantly in non-Laveranian Plasmodium genomes
In addition to studying the Laveranian subgenus of Plasmodium, we analyzed the genomes of two more distantly related outgroups: species infecting rodents (P. berghei, P. chabaudi) and birds (P. relictum, P. gallinaceum). These species do not have vars, but do have varying numbers of the other multigene families. We found significantly fewer PQSs in P. relictum and P. gallinaceum as compared to the Laverania (Welch’s t-test, two-tailed, QGRS Mapper: t-stat=3.92, p-value=0.00718; G4 Hunter: t-stat=4.35, p-value=0.00355), while P. berghei and P. chabaudi had approximately the same number of PQSs as the Clade A Laverania (Fig. 2a). P. gallinaceum was unique in not having more PQSs found by G4 Hunter than QGRS Mapper.
By searching these genomes for associations between PQSs and multigene families (clag, PHIST, pir, rifin, stevor, reticulocyte-binding (Fig. 6), we confirmed the co-distribution of PQSs with pirs in P. berghei that was reported by Stanton et al. [21]: 37 of 217 pir genes had PQS(s) according to QGRS Mapper, i.e. ~17% of all pirs, and this constituted over 50% of the total genomic, non-telomeric PQSs. A significant, but markedly weaker, co-distribution was also seen in P. chabaudi, with 11 of 208 pir genes having PQS(s) (Additional file 3: Table S3). Thus, this association may be common to pir genes of rodent malarias, but it is clearly weaker that that seen in var genes, and unlike the var genes it does not segregate with ‘real’ pir genes versus pir pseudogenes (pseudogenes are common in the P. berghei genome and do encode many PQSs). Nevertheless, there is a contrast to the Laveranian genomes, where pirs rarely, if ever, encode PQSs, co-associating spatially with PQSs simply due to the proximity between pir and var genes. Notably, in both P. berghei and P. chabaudi, pir genes were exclusively associated with canonical PQSs as found by QGRS Mapper: the types of PQSs found by G4Hunter showed no association with pir genes. No other gene families harboured large numbers of PQSs in P. berghei, P. chabaudi, P. relictum, or P. gallinaceum (in P. berghei, one clag gene out of 4 harboured a PQS (Fig. 6), but given the small size of the gene family, this may be of limited relevance).
Some non-var-G4s are conserved in Laveranian genomes
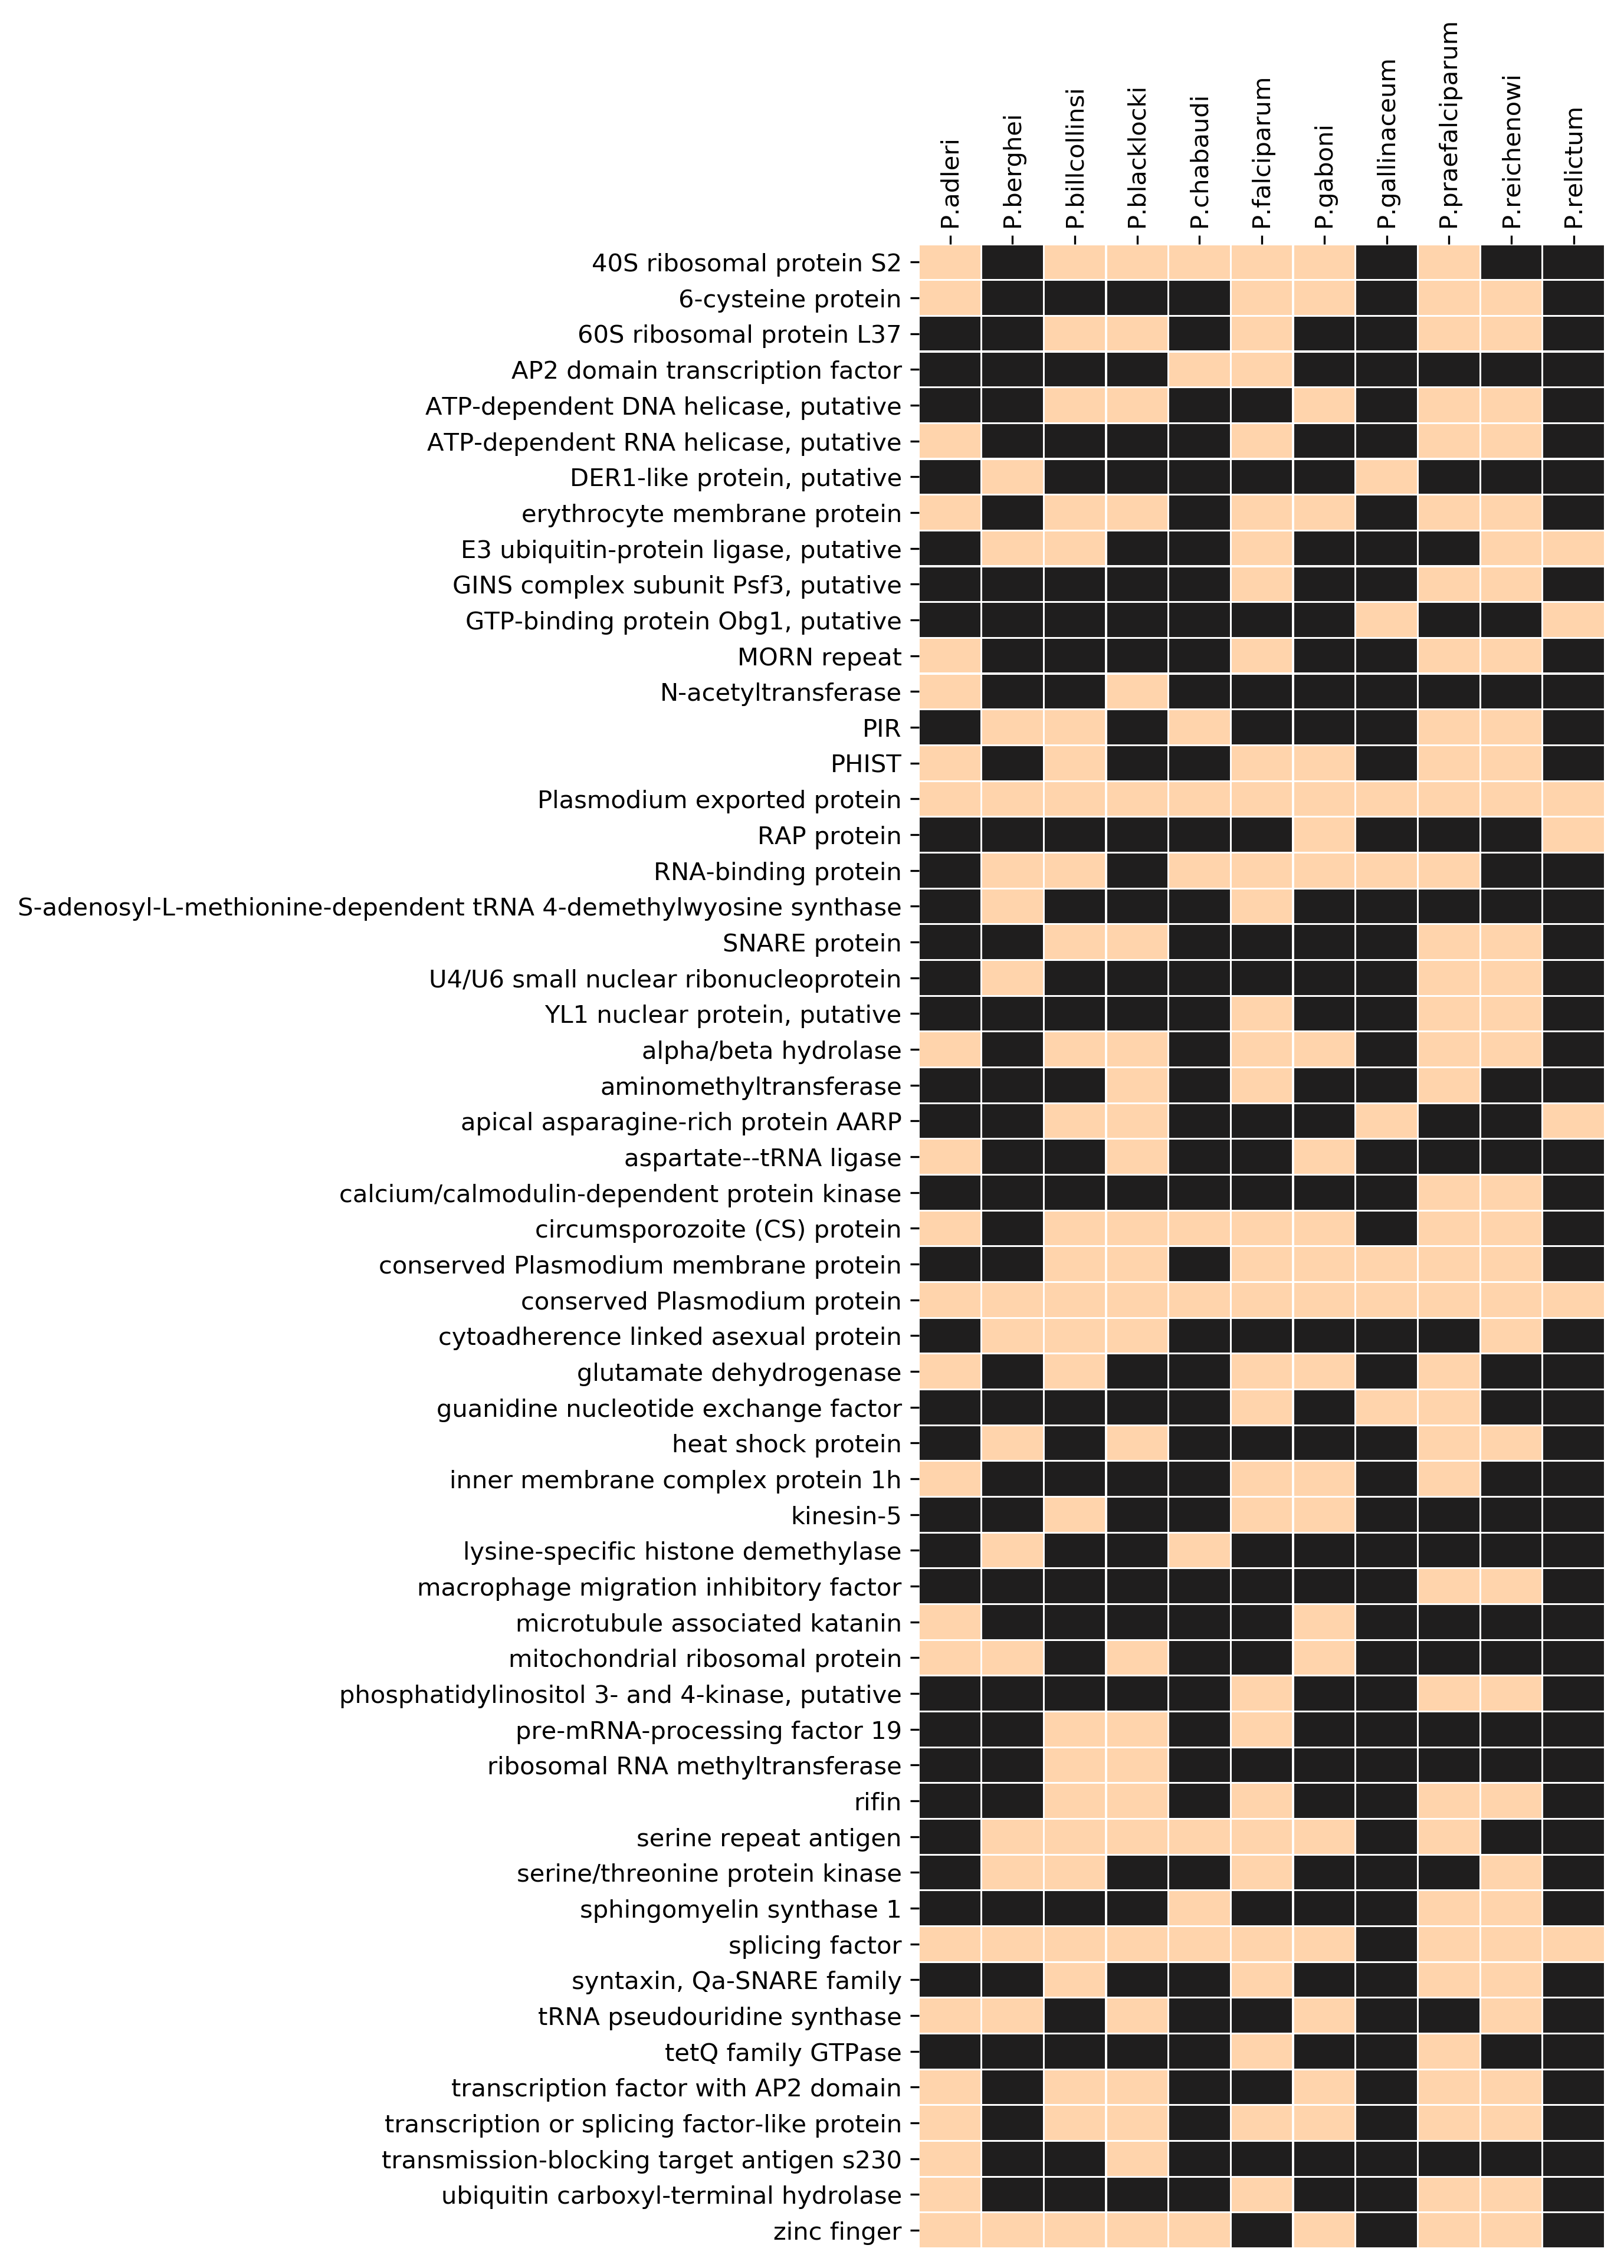
Since the Laveranian genomes did not show strong associations between PQSs and multigene families other than var, we analyzed the degree to which non-var PQSs found anywhere else in these genomes might be conserved. We found that several PQS-gene associations were conserved (Additional file 7: Figure S3): for example, all Laverania possessed at least one PQS in the genes encoding circumsporozoite protein, alpha/beta hydrolase, AP2 domain transcription factor(s), and SNARE proteins, whereas these associations were absent in the avian- and rodent-infecting Plasmodiums. Additionally, all Laverania except P. reichenowi possessed at least one PQS in the 40S ribosomal protein S2-encoding gene, and all Laverania except P. blacklocki had at least one PQS in a PHIST gene. PQS-encoding genes were then clustered by GO-terms to seek any functional groups that might be particularly enriched in PQSs. Figure 7 shows that the most prominent PQS-encoding genes were clearly the adhesin-encoding genes – i.e. primarily vars. A second group of helicase-encoding genes also contained conserved PQSs in all Laverania except P. falciparum (Fig. 7 and Additional file 8, Table S5).
QGRS Mapper, G4 Hunter and G4-seq all give markedly different results on AT-rich Plasmodium genomes
Finally, having conducted all the foregoing analyses with two different PQS-prediction algorithms, we compared their concordance. QGRS Mapper searches for sequences that match the general motif favorable for G4 formation, , whereas G4 Hunter does not require this ‘canonical’ form but considers additional factors such as G-richness and G-skewness to calculate a score that reflects the propensity of a sequence to form a G4. G4 Hunter can therefore detect the “non-canonical” types of G4s that do not match the stereotypical pattern and would be overlooked by QGRS Mapper. By using both algorithms, we sought to characterize the proportions of canonical and non-canonical PQSs in Plasmodium genomes, and to compare the performance of the algorithms in general on AT-rich genomes. For all species except P. gallinaceum, G4 Hunter found more PQSs than QGRS Mapper, though this difference varied among species and did not track with any evolutionary pattern (Fig. 2a). Next, we investigated the degree of concordance between the two algorithms: for each species, we counted the number of PQS motifs, and also the number of unique PQS-containing genes, that were detected by both algorithms. We found a surprising lack of concordance (Fig. 8): only a minority of motifs were found in common. The percentage of common genes was somewhat greater, indicating that although both algorithms might find a PQS in the same gene, they usually did not find exactly the same motif. Concordance also varied considerably between genomes, being relatively high in several Clade B Laverania and particularly low in the rodent and avian malaria genomes.
Finally, we compared the PQSs found by each algorithm with the locations of G4s that were experimentally observed in G4-seq on the P. falciparum genome – this being the only Plasmodium genome for which G4-seq has been performed [27]. G4-seq identified a total of 173 sites when the genome was sequenced in potassium-containing conditions, and twice as many, 326, in potassium-plus-pyridostatin conditions (pyridostatin is a small molecule that stabilizes G4s and can thus increase the number of G4s that are detectable by sequencing [23]). It is clear that the overall number of sites detectable by G4-seq was greater than the number of unique (non-telomere) PQSs predicted by either in silico algorithm, but in fact >80% of all sites found by G4-seq in the P. falciparum genome proved to be in telomeres, so only a small fraction of the predicted non-telomeric PQSs were actually found by sequencing. Fewer than one third of the total G4-seq sites had the potential to be predicted by QGRS Mapper using a loop size of 0-11, because only 32.5% of the sequenced sites were canonical (defined by Marsico et al. as containing a , motif) [27]. In fact, QGRS Mapper predicted 24 unique, non-telomere-repeat sites that appeared in G4-seq (it did also predict a further 244 sites containing telomere repeats that were also picked up by G4-seq). Excluding telomere repeats, however, only 22% of the total QGRS Mapper predictions for canonical G4s were verified by G4-seq. G4 Hunter, by contrast, could potentially have predicted any of the sequenced sites, but in fact predicted only 18 of them, so just 8.1% of G4 Hunter predictions were verified by G4-seq (Additional file 9, Table S6).