Animals
All experiments were conducted according to European Community for experimental animal use guidelines (EC2010/63), and have been approved by the Ethical committee of University Paris Descartes (CEEA 34) and the French Ministry of Agriculture (agreement 17112). To investigate the effect of dyslipidemia on tumor development, we implanted the murine cancer lines in female C57BL/6J (River). OT-mice were also purchased from Charles River. IL-1β-/- mice were kindly given by Pr Yoichiro Iwakura (Tokyo University of Science, Japan). LysMCre-/-VEGFf/f (WT) and LysMCre+/-VEGFf/f (VEGF-ADLysM) mice were provided by Dr Christian Stockmann. All mice were on C57BL/6J background.
Mouse breeding occurred in our animal facility in accordance with local recommendations. Control mice were matched with littermates of the appropriate, age, sex, and genetic background to account for any variation in data, when specified. Mice received a standard chow diet (Safe, A03) or pro-atherogenic high fat/high cholesterol diet (Ssniff, 15% cocoa butter and 1.25% cholesterol) and water ad libitum. Mouse euthanasia was performed by cervical dislocation after anesthesia with 4% isoflurane (IsoVet 100%; Centravet, France) in 100% oxygen in an anesthetic chamber which was not prefilled to prevent distress.
Total Cholesterol assay
Plasma cholesterol was measured using a commercial kit (DiaSys Cholesterol FS*, Germany).
Cell line and tumor challenge
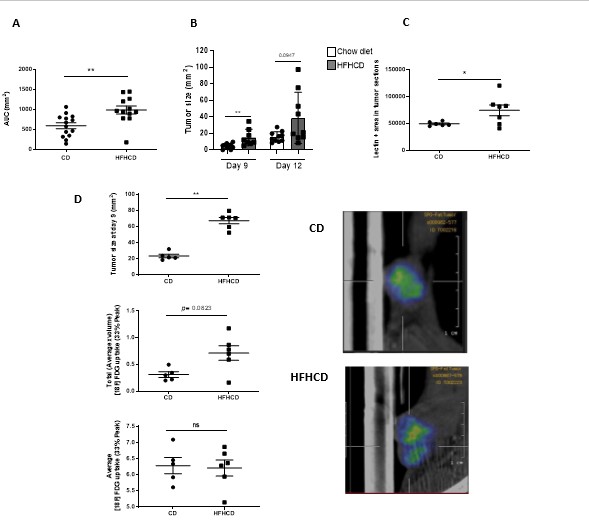
The B16F10 and TC1 cells were purchased from ATCC (CRL6475, CRL2493). Cells were cultured in RPMI supplemented with 10% fetal bovine serum (FBS), 2 mM glutamine, 50 U/ml penicillin and 100μg/ml streptomycin (RPMI complete medium). Mice were subcutaneously (s.c) injected with 0.25x10⁶ B16-F10 or TC1 cells in 100µl of saline buffer in the shaved abdominal flank. Tumor growth was monitored every 2–3 days using a caliper until 15 days post-injection. Tumor size was calculated as: Width x Length in mm2.
Cells isolation, staining and flow cytometry
Blood samples were collected by submandibular punction with 20-gauge needle under isofluorane anesthesia. Spleens were dissected and pressed through a 40‐μM cell strainer, red blood cells were lysed with osmotic lysis buffer. Tumor were isolated from mice, minced and placed into GentleMACS C-tube with PBS-FCS 2%, dissociated mechanically with GentleMACS dissociator (Miltenyi) according to manufactor’s standard protocol, then filtered on 70um strainer.
Single cell suspensions were first blocked with anti-CD16/32 antibody (93; eBioscience) and stained for surface molecules with the following antibodies in PBS-FCS 2%:
CD45 (30-F11 ; eBioscience), F4/80 ( BM8;biolegend); CD11b (M1/70; eBioscience)
Ly6C (HK4.4; eBioscience), Ly6G (1A8, BD Biosciences), GR-1 (RB6-8C; Biolegend), CD8a (53-6.7; eBioscience), CD4 ( GK1.5; eBioscience ), CD3 (145-2C11; eBioscience), CD25 (PC61.5; eBioscience), NK1.1 (PK136; Biolegend). For intracellular staining of FoxP3, after surface staining, cells were permeabilized using the FoxP3/transcription Factor staining buffer set(eBioscience ) according to manufactor’s protocol, then stained with FoxP3 mAb ( FJK-16S; eBioscience). Dead cells were excluded using live/dead fixable aqua dead cell kit (Invitrogen). Samples were acquired on Fortessa X20 and on a Fortessa Analyser (BD Biosciences) and analyzed with FlowJo software.
For Dimensionality reduction using t-SNE and automatic clustering : CD45 live cells were manually gated from multicolor flow cytometry and exported in a FCS file. t-Distributed Stochastic Neighbor Embedding (t-SNE) dimensionality reduction was performed using bh tsne, an implementation of t-SNE via Barnes-Hut approximations. 20 000 events were used for t-SNE dimensionality reduction.
Gene expression analysis
For the transcriptomic analysis, 4 tumors per group were harvested from mice fed with CD or HFHCD at Day 9 post injection of B16-F10 melanoma cells. Tumors were minced and lysed into RLT buffer containing 1% β-mercaptoethanol. RNA was extracted using Qiagen RNeasy kit according to the manufacturer’s instructions.
Analysis of gene was done by affymetrix microarrays at de GENOM’IC core facility (Cochin Institute)
In vivo cells labelling
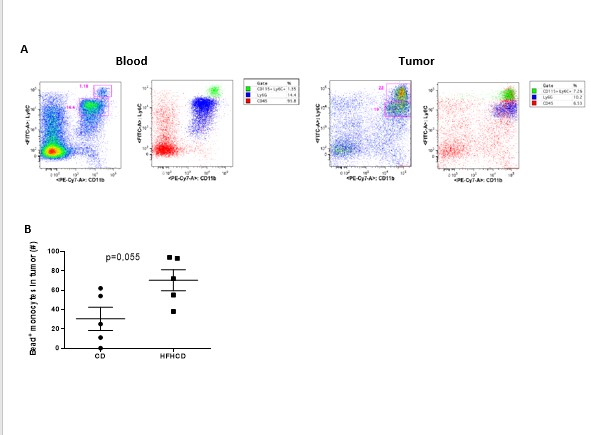
A bead labeling technique was used to label monocytes in vivo, by retro-orbital i.v. injection of 1 μm fluorescent latex microbeads (YG, Polysciences) diluted 1⁄4 in sterile PBS, on day 8 post tumor injection. Mice were sacrificed 24h later.
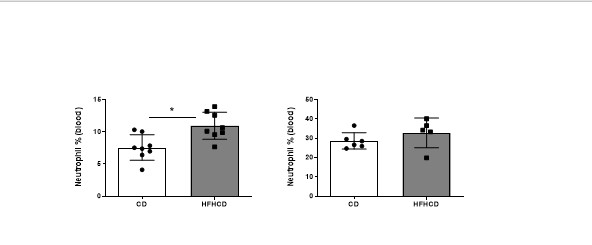
For intravital neutrophil and monocyte labeling, mice were retro-orbitally injected i.v with anti-Ly6G PE and anti-CD115 APC (5ug each) on day 8 post tumors injection. 6h later mice were sacrificed. Labeled cells were analyzed in blood and tumors by flow cytometry.
Culture in vitro
Bone marrow cells were collected from femurs and tibias by insertion of a needle into the bone and flushing with RPMI supplemented with 0.2% BSA and 1% FCS as previously described. Macrophages were differentiated after culture for 9 days with 20% L929 conditioned medium.
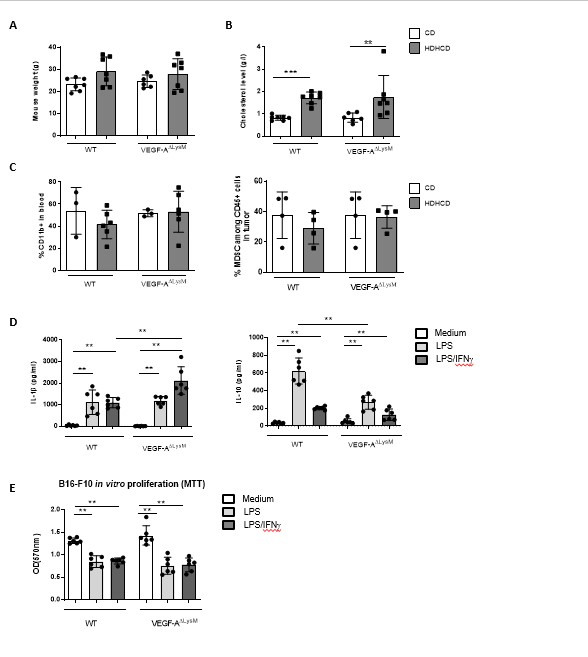
Splenocytes or BM-DM were cultured in RPMI 1640 supplemented with Glutamax, 10% FCS, 0.02 mmol/L β‐mercaptoethanol and antibiotics Penicillin and Streptomycin. Cells were stimulated in RPMI complete medium with LPS (10µ g/ml, Sigma Aldrich)± mIFNg (100U/ml) then supernatent was harvested. IL-1b, IL-10, IL-12 or TNFa was measured by ELISA (R&D Systems).
For B16-F10 in vitro proliferation, 10 000 B16F10 cells were co-cultured with 2 500 CD45 cells isolated from tumors or with BM-DM, in RPMI complete medium. 24h later, B16F10 proliferation was measured by 3T-Thymidine incorporation or MTT assay (Sigma). For Thymidine incorporation one ìCi [3H] thymidine was added to each well during the last 18 h. Thymidine incorporation was assessed using a TopCount NXT scintillation counter (Perkin Elmer).
Cytokines and chemokines assay, ELISA
Total protein from tumors was extracted using Bio-plex lysis buffer (Bio-Rad) according to manufactor’s instructions, and concentration was determinated with BCA assay (Pierce).
CD45+ cells were isolated from fresh tumors by magnetic sort (Mojosort mouse CD45 nanobeads, Biolegend). Cells were cultured for 24h in RPMI complete medium then supernatent were harvested.
The bead-based multiplex immunoassay was used to measure the levels inflammatory and angiogenesis mediators from tumors protein lysates or from supernatant of CD45+ cells isolated from tumors. A 23-plex inflammatory immunoassay panel (IL-1α, IL-1β, IL-2, IL-3, IL-4, IL-5, IL-6, IL-9, IL-10, IL-12 (p40), IL-12 (p70), IL-13, IL-17A, Eotaxin, G-CSF, GM-CSF, IFN-γ, KC, MCP-1 (MCAF), MIP-1α, MIP-1β, RANTES, TNF-α) ( Bio-Rad) and 5-plex angiogenesis immunoassay panel ( PDFG-a, Endoglin, VEGFR2, Fas-L, ICAM-1)( R&D systems), were performed according to manufactor’s protocol and analyzed on Bio-Plex 200 ( Bio-rad). The analytes concentration was calculated using a standard curve (5 PL regression), with Bio-Plex manager software.
VEGF-a concentration was evaluated by ELISA (mouse VEGF DuoSet, R&D system) in tumors lysates and in plasma.
MDSC suppressive activity assay
MDSC (CD11b+ Ly6C+ Ly6G+) enriched cells were obtained from spleen of tumor bearing mice by magnetic sort (Myeloid-Derived Suppressor Cell Isolation Kit, Miltenyi). CD8 T cells were isolated from spleen of OT-I mice by magnetic sort (CD8a+ T Cell Isolation Kit, Miltenyi), and labeled with 5uM CFSE (Vybrant™ CFDA SE Cell Tracer Kit, Invitrogen). OT-I CD8 T cells were incubated with OVA 257-264 (SIINFEKL) at 0.1ug/ml (Polypeptide) with various ratio of MDSC for 72h. On day 3, CFSE dilution was analyzed by flow cytometry.
The percentage of proliferating cells was then used to calculate the percent suppression of proliferation. Percent suppression of proliferation was calculated using the following formula: (1 - (% proliferation with MDSC /% proliferation without MDSC) )* 100.
Lectin immunostaining
Tumors were frozen in OCT compound, then prepared in 10 µm sections on a cryostat microtome. Lectin staining was done with Griffonia Simplicifolia Lectin I (GSL I) isolectin B4 Fluorescein (Vector Laboratories) according to manufactor’s protocol. Quantification was done with Image J.
Doppler imaging and quantification
Mice were shaved, anesthetized with isoflurane and kept under monitored temperature during the time of imaging. Vessel density was evaluated by laser-Doppler perfusion imaging to assess in vivo tissue perfusion in the tumor (Moor Instrument). Quantification of the vessel density was performed with MoorLDIReview V6.1 software.
2’-deoxy-2’-[18F]fluoro-D-glucose (FDG) positron emission tomography–computed tomography (PET-CT) imaging
Prior to each imaging session, mice were fasted overnight with water ad libitum. Mice were anesthetized with isoflurane (IsoVet 100%; Centravet, France) in 100% oxygen (4% isoflurane for induction; 1–2% for maintenance). Mice were weighted, and placed on a heated plate (Minerve, France). Glycemia was measured in blood drawn from the caudal ventral artery using an Accu-Chek® Aviva Nano A (Accu-Chek, France). A customized catheter with a 29 G needle (Fischer Scientific, France) connected to a 5-cm polyethylene tubing (Tygon Microbore Tubing, Cole-Parmer0.020” × 0.060“OD; Fisher Scientific, France) was installed in the lateral tail vein of the mice. 10 MBq of FDG ([Gluscan, Advanced Applied Applications, France) in 200 µl of saline solution were injected in the mice. The mice were then put back in their cages and left awake for 30 min. Mice were anesthetized again and installed in prone position in the imaging bed of the camera (NanoScan PET-CT, Mediso Medical Imaging Systems, Hungary). Respiration and body temperature were registered. Body temperature was maintained at 37°C and anesthesia was controlled on the breathing rate throughout the entire examination. CT scans were performed first using the following parameters: mode semi-circular, tension of 50 kV, 720 projections full scan, 300 ms per projection, binning 1:4. CT data were reconstructed using filtered back projection (filter : Cosine ; Cutoff : 100%). List-mode PET data were collected between 45 and 60 min post injection of FDG, binned using a 5-ns time window, a 400- to 600-keV energy window, and a 1:5 coincidence mode. In vivo PET acquisitions were reconstructed using the Tera-Tomo reconstruction engine (3D-OSEM based manufactured customized algorithm, Mediso Medical Imaging Systems, Hungary) with expectation maximization iterations, scatter and attenuation corrections. Images were analyzed using the software PMOD (PMOD Technologies LLC, Switzerland). Standardized Volume of Interest (VOI) was drawn in each organ of interest and Standardized Uptake Values (SUV) were calculated by dividing the mean tissue radioactivity concentration by the whole body concentration of the injected radioactivity. The Peak value was calculated as the maximum average SUV within a 1-cm3 spherical volume of interest and the tumor volume was automatically segmented at 33% of this value. Total FDG uptake was estimated as the product from the volume by the mean uptake of the segmented region.
Statistics
Graphs were generated and statistical analysis were performed with Prism software (GraphPad software, La Jolla). Results are expressed as means ± SEM. The Mann-Whitney t- or ANOVA tests were used as specified in the legends. Comparison between tumor growth curves have been performed using a two-way ANOVA test, and multiple comparisons have been corrected with the Bonferroni coefficient. The association between two variables was done by spearman correlation. P values less than 0.05 was considered significant