Cell culture and reagents
The human NSCLC/ADC H1650 cell line with EGFRdelE746-A750 mutation and A549 cell line with EGFRwt were obtained from the Committee on Type Culture Collection of Chinese Academy of Sciences (CTCCCAS, Shanghai, China). H1650 and A549 cells were chosen because their response to gefitinib have been extensively characterized (primary resistance to gefitinib).
Cell lines were cultured in RPMI 1640 medium (GIBCO) that contained 10% fetal calf serum (FCS), 2 mmol/L L-glutamine and 100 units/mL penicillin and 40 IU/mL gentamycin
were maintained at 37°C in a humidified atmosphere of 5 % CO2 and 95 % air. Subconfluent cells (80%) were passaged with a solution containing 0.25 % trypsin-0.5 mmol/L Ethylenediaminetetraacetic acid (EDTA). Cell lines were tested for mycoplasma and confirmed to be negative.
Gefitinib (N-[3-Chloro-4-fluorophenyl]-7-methoxy-6-[3-morpholinopropoxy]quinazolin-4- amine, CAS 184475-35-2, MF C22H24ClFN4O3, MW 446.907g/mol, HPLC>98%) and all-trans retinoic acid (ATRA, [2E,4E,6E,8E]-3,7-dimethyl-9-[2,6,6-trimethylcyclohexen- 1-yl] nona-2,4,6,8-tetraenoic acid, CAS 302-79-4, MF C20H28O2, MW 300.442 g/mol, HPLC>98%) were purchased from Sigma Chemical Co. (St. Louis, MO, USA); ALDEFLUORTM Kit (Cat. No.01700) was purchased from STEMCELL Technologies Inc.; BD Pharmingen™ PE mouse anti-human CD44 monoclonal antibody (Clone 515 Cat No. 550988) and its isotype mouse BALB/c IgG1 were purchased from BD Biosciences (Lake Franklin, NJ, USA).
AmoyDx ARMS EGFR mutation detection kit was purchased from Amoy Diagnostics Co. LTD (Xiamen, China).
Cell viability assay
Cell viability was measured by a colorimetric assay using crystal violet. To a 96-well plate, 5 ×10³ cells/well were pre-cultured for 24 h, and then exposed to varying concentrations of gefitinib and ATRA, and 0.1% DMSO was used as a vehicle in triplicate. After 72 h, the supernatant was discarded as much as possible, and 100μL of crystal violet solution (0.5% crystal violet in 30% methanol) was added to each well for 30 min, and then rinsed with tap water and dried at 40°C. 100μL of 10% SDS solution was added to each well and fully dissolved for 30 min. The absorbance at 595nm was measured spectrophotometrically using a microplate reader (Infinite M200 Pro TECAN-Reader, Switzerland).
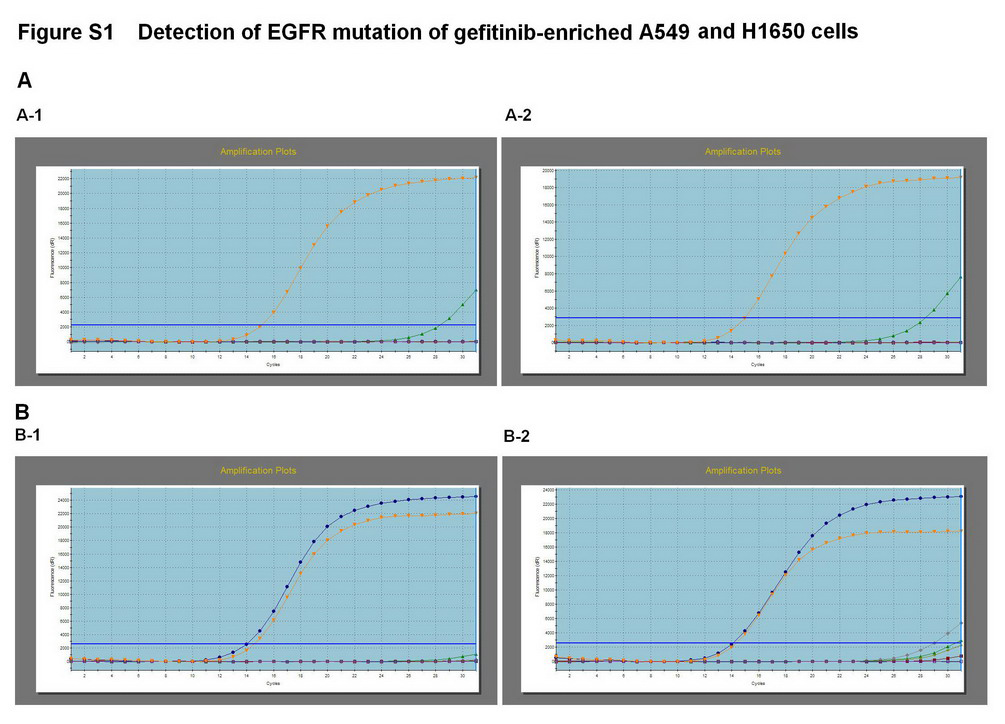
EGFR mutation testing
Genomic DNA from A549 and H1650 cells was manually extracted using a TIANamp Genomic DNA Kit (DP304, TIANGEN, China.) according to the manufacturer’s protocol. DNA was isolated by elution with 50 μl of Tris/Acetate/EDTA (TAE). EGFR mutations were detected with the AmoyDx Human EGFR Gene 29 Mutations Detection kit with fluorescence polymerase chain reaction (PCR) (Amoy Diagnostics, Xiamen, China) and assays were performed on CFX96 Touch (Bio-Rad, USA) real-time fluorescence quantitative PCR instrument according to the manufacturer’s instructions. Positive results were defined as [Ct (sample)-Ct (control)] \ Ct (cut-off).
Gefitinib-induced enrichment of GSC and ATRA treatment
H1650 and A549 cells were passaged with 15μmol/L of gefitinib twice weekly for three consecutive weeks, and the resultant gefitinib surviving cells (A549GSC cells and H1650GSC cells) were incubated with 5μmol/L of ATRA for 1-5 days. These cells were respectively harvested to test the expression of ALDH1A1 and CD44 by flow cytometer (FCM). The GSCs with enhanced expression of ALDH1A1 and CD44 are defined as GSC-enriched gefitinib-resistant cells.
Flow cytometry for ALDH1A1 and CD44 expression
Expression of ALDH1A1 and CD44 by A549 and H1650 cells were determined using ALDEFLUORTM kit (FITC) and CD44 mAb (PE), respectively according to the manufacturer's protocols. Briefly, A549 and H1650 cells (1x10⁶) were harvested and stained with ALDH (DEAB as the negative control) and PE anti-human CD44 mAb (mouse IgG1 as the isotype control) staining. The stained cells were resuspended in 1 ml of Assay Buffer and subjected respectively to flow cytometrical analysis on FACSCanto II Flow Cytometer (Becton–Dickinson).
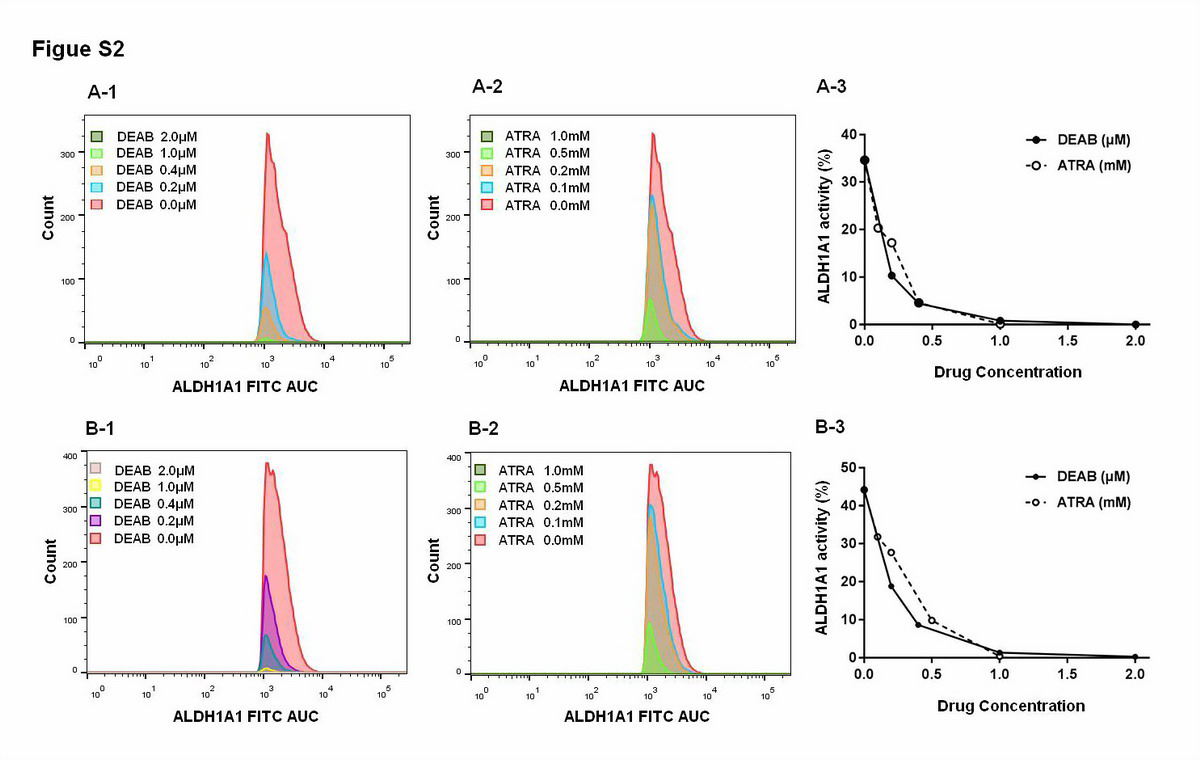
Determination for Inhibition of ATRA on ALDH1A1 Activity
Active ALDH1A1 was determined using ALDEFLUOR assay according to the manufacturer’s protocol. A549 GSCs and H1650 GSCs with ALDH1A1bright (5 ×10⁵ cells/tube) were respectively exposed to varying concentrations of ATRA and DEAB (diethylaminobenzaldehyde, an inhibitor of ALDH1A1 activity), and washed twice with 2 ml ALDEFLUOR buffer and eventually resuspended in 500 μl ALDEFLUOR buffer, and then subjected to flow cytometrical analysis to determine the FITC AUC (area under curve) on FACS Canto II Flow Cytometer (Becton–Dickinson).