Coronary Artery Ligation and Mouse Model
All animal use was performed at the University of Pittsburgh in compliance with the National Institutes of Health Guide for Care and Use of Experimental Animals and was approved by the University of Pittsburgh Animal Care and Use Committee. Previously characterized mice harboring a floxed TFAM gene were crossed with a-myosin heavy chain Cre transgene (MHC-Cre) to generate mice that were MHC-Cre (+) x Flox-TFAM (n=22) and MHC-Cre (-) x Flox-TFAM (n=15). Both males and females were used in this study. Mice were aged to twelve weeks, at which point they underwent baseline echocardiography followed by coronary artery ligation surgery. Mice were anesthetized and ventilated prior to open thoracotomy through the 4th rib followed by opening of the pericardium and coronary artery ligation (CAL) by suture placement around the proximal coronary artery19. All surviving mice underwent follow-up echocardiography at 1 and 4 weeks.
Echocardiography
Mice were anesthetized using isoflurane delivered by nose cone at the following timepoints: baseline (n=37), 1 week following CAL (n=32), and 4 weeks following CAL (n=32). At each timepoint, depilatory cream was applied to the thorax to remove hair. Animals were maintained at 37° C via heating pad and rectal probe and were monitored using surface ECG limb electrodes throughout imaging. Transthoracic echocardiography was performed using the Vevo 3100 imaging systems (FUJIFILM VisualSonics, Toronto, Canada) with a probe attached to a step motor. The Visualsonic MX400 (20-46 MHz, 50 µm axial resolution) linear array transducer was used for all image acquisition. Heart rate was maintained between 400-500 bpm during imaging by adjusting isoflurane concentration to a final concentration of 1-2%. M-mode and B-mode images of the heart were obtained for at least ten cardiac cycles in the parasternal long axis and mid-papillary muscle level short axis views. For 4D image acquisition, the step motor was positioned just below the apex and the motor aligned to take concentric short axis images in 0.2 mm steps. At each position, a complete cardiac cycle was recorded using automated ECG and respiratory gating. 4D images were constructed using Vevo 4D image software. Image analysis was performed independently by two blinded sonographers (CR and BM). End-diastolic volume (EDV), End-systolic volume (ESV), and Ejection Fraction (EF), were calculated using the following formulas:
M-Mode (short-axis):
EDV = [ 7.0 / (2.4 + LVID;d) x LVID;d3] where LVID;d = Left ventricular internal diameter at end diastole
ESV = [ 7.0 / (2.4 + LVID;s) x LVID;s3] where LVID;s = Left ventricular internal diameter at end systole
EF = 100 x ((EDV – ESV)/EDV)
2D-US analysis of the parasternal long-axis was completed using operator-defined LV trace function of Vevo LAB software (v3.2.0) and calculations of EDV, ESV, and EF made by Simpson’s method. 4D-US measurements were calculated directly from volumetric measurements based on operator-defined edge-tracing using Vevo 4D imaging software.
The Vevo Strain software was used to measure both longitudinal and radial strain by using long-axis images and semi-automated border tracking. The LV was visualized during end-diastole and the endocardial and epicardial borders were determined. A minimum of five cardiac cycles were then traced automatically by the speckle-tracking software and reviewed by the user. Respiratory variation was excluded from these cycles. Global peak longitudinal and radial strain were calculated using Vevo Strain software on images taken from the long-axis. Global peak circumferential and radial strain were calculated from images from the short axis. Further, the LV was automatically divided into six segments in the long-axis images by the software. The standard deviation of the strain among the individual segments was calculated as a measure of LV dyssynchrony.
WMSI
WMSI was calculated using a 16-segment model collected from 3 short axis views collected during 4D-US image acquisition (n=32). Short axis views were obtained 1 mm, 3 mm, and 5 mm from the apex for standardization. The most distal image was divided into 4 sections and the remaining sections divided into 6 sections as previously described (Figure 3)20,21. Individual sections were graded as: 1- normal, 2- hypokinetic, 3- akinetic, 4- dyskinetic, 5- aneurysmal. WMSI was calculated as average of all 16-segment motion scores.
CMR
Mice (n=12) were anesthetized with 4% isoflurane mixed with room air in an induction box for 1 to 3 minutes. The depth of anesthesia was monitored by toe reflex, extension of limbs, and spine positioning. Anesthesia was maintained by 1.5 to 2 % isoflurane and 100% oxygen via a nose cone. Respiration waveforms were continuously monitored using a small pneumatic pillow under the animal’s diaphragm connected to a magnet-compatible pressure transducer (SA Instruments, Stony Brook, NY). CMR was performed on a Bruker Biospec 7T/30 system (Bruker Biospin MRI, Billerica, MA) with a 35-mm quadrature coil for both transmission and reception. The Bruker Intragate module was used for image-gated cine MRI with retrospective navigation. Subcutaneous injection of Multi-Hance (Gadobenate dimeglumine, 529 mg/ml, Bracco Diagnostics, Inc, Monroe Twp, NJ 08831) was administered immediately before the CMR acquisition at 0.1 mmol Gd/kg bodyweight. T1-weighted images to highlight LGE were acquired 15-20 minutes after the subcutaneous administration of Multi-Hance. Eight T1-weighted short-axis imaging planes covering the whole ventricular volume with no gaps were acquired with the following parameters: Field of view (FOV) = 2.5 cm X 2.5 cm, slice thickness = 1mm, in-plane resolution = 0.97 mm, flip angle (FA) = 10 degrees, echo time (TE) = 3.059 msec, repetition time (TR) = 5.653 msec. White-blood cine movies with 20 cardiac phases were acquired for each mouse with equivalent temporal resolution for the cine loops was about 16.5 - 21.5 ms per frame. Eight short-axis imaging planes covering the whole ventricular volume with no gaps and one long-axis plane were acquired with the following parameters: Field of view (FOV) = 2.5 cm X 2.5 cm, slice thickness = 1mm, in-plane resolution = 0.97 mm, flip angle (FA) = 30 degrees, echo time (TE) = 1.872 msec, repetition time (TR) = 38.293 msec.
The extent of myocardial infarction was defined by the percentage of the myocardium displaying hyperintensity 15-20 minutes after Gd administration. To obtain the proportion of myocardial infarction, the area of hyperintensity was manually traced by a blinded operator on the Paravision 5.1 Xtip software (Bruker Biospin MRI, Billerica, MA). The extent of myocardial hemorrhage was defined by dark hypointensity on the cine images. To obtain the proportion of myocardial hemorrhage, the area of hypointensity was manually traced by a blinded operator on the software. The left ventricular endocardium and epicardium boundaries of each imaging slice at the end-systole (ES) and the end-diastole (ED) were manually traced by a blinded operator in the software to calculate the following functional parameters: left ventricular blood volume (LVV), left ventricular wall volume (LV wall), LV mass, stroke volume (SV), ejection fraction, heart rate (HR), cardiac output (CO), longitudinal shortening, and radial shortening. LVV is calculated by summation of all the short-axis slices. The EF was calculated using the following equation: , where is the internal left ventricle area of slice at end systole, the internal left ventricle area of slice at end diastole, and is the thickness of each scanned slice.
Tissue Histology
LV tissue (n=16) was fixed overnight in 10% formaldehyde at 4°C. Tissues were then washed with PBS and transferred to 70% EtOH and stored at room temperature. After fixation, tissues were brought to the Department of Pathology Histology Core at the University of Pittsburgh and sectioned into 10 μm slices at 1 mm intervals throughout the myocardium. Sections were stained with hematoxylin and eosin (H&E) or Masson’s Trichrome stains and images obtained on a TissueFAXS Histo (TissueGnostics, Vienna, Austria) upright brightfield microscope utilizing HistoQuest software. Image analysis was performed by automated red and blue channel separation using Image Measurement 9.0 (Bersoft Imaging, Cologne, Germany).
Statistical Analysis
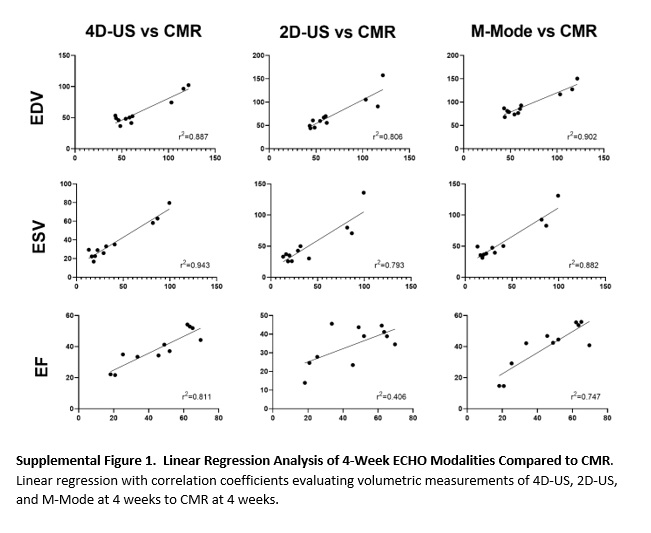
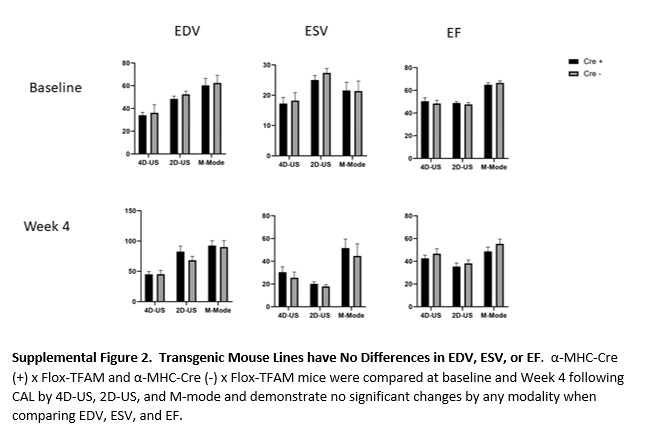
Differences between imaging modalities were evaluated by Bland-Altman analysis and are expressed as % bias and 95% level of agreement (LOA). Bland-Altman percentage bias was calculated as (100*(B-A)/Average vs Average) where “B” represents measurements from 4D-US, 2D-US, or M-mode, and “A” represents measurements from CMR. Intraclass correlation was used to evaluate reliability between single measurements of EDV, ESV, and EF between two users (CR and BM). Normality was assessed using D’Agostino-Pearson omnibus K2 testing for each data set. Regression analysis was performed using Spearman rank correlation to compare scar size among several methods (Figure 4, Supplemental Table 2). Correlation was graded as poor (0.0-0.5), moderate (0.5-0.7), strong (0.7 to 0.9), or very strong (0.9-1.0). Supplemental Figure 2 data are expressed and mean ± standard error. Power analysis was completed based on linear regression analysis to confirm group size (two-sided test, α=0.05, based on values for EDV). For all statistical tests, p ≤ 0.05 was considered significant. All normality, regression and statistical tests were completed using Graphpad Prism 7 software (San Diego, CA) except for ICC, which was calculated using Microsoft Excel (Redmond, WA), and power analysis which was calculated using StataCorp Stata 16.0 (College Station, Texas).