Characterization of CFNs and CFNs-Thiourea
UV − vis absorption and FL spectra were employed for verifying the optical properties of CFNs and modified CFNs. Figure 1a, clearly shows the UV-vi s spectra of the synthesized CFNs and the CFNs modified with the thiourea (CFNs-Thiourea), thiourea, As (III) and CFNs-Thiourea in the presence of As (III). UV − vis absorption spectra in Fig. 1a displayed the strong optical absorption in the UV region (may be corresponding to the π → π* transitions) and a tail covering the visible region (may be due to the n → π* transitions of C = O) [22] for CFNs which have changed and shifted after the modification of the CFNs with thiourea ligand verifying the successful modification of CFNs with aforementioned ligand and the covalent bond formation among thiourea and carboxylic acid groups on the surface of CFNs. FT-IR spectra were utilized to identify functional groups on the surface of CFNs and Thiourea-CFNs being in line with suggested molecular structure. The FT-IR spectrum of CFNs exhibits the presence of functional groups such as –COOH, –OH, and –NH2 on the surface of the CFNs. Therefore, in order to modify the surface of CFNs, EDC and NHS were employed to activate carbonyl groups and create amide covalent bonds with chemical materials containing -NH2 groups such as thiourea [23]. According to the FT-IR spectrum of Thiourea-CFNs, the peak around 1620 Cm− 1 is due to −C = O stretching vibrations of the carbonyl amide group on the Thiourea-CFNs [24]. The absorption peaks at 3200 Cm− 1 and 3400 Cm− 1 correspond to the −NH2 and O–H stretching vibrations. Two bands observed at 1420 Cm− 1 and 1092 Cm− 1 correspond to the stretching vibration of C = S [25]. TEM image was applied to investigate the morphology and size of the synthesized CFNs. According to Fig. 2a, it can be seen that the synthesized CFNs are approximately spherical with an average diameter of 23.0 ± 2.7 nm having a relatively uniform distribution. Figure 2b exhibits characteristic excitation and emission spectra of the synthesized CFNs. As seen, the fluorescence emission spectrum of CFNs was recorded at 425 nm when excited wavelength was set at 280 nm.
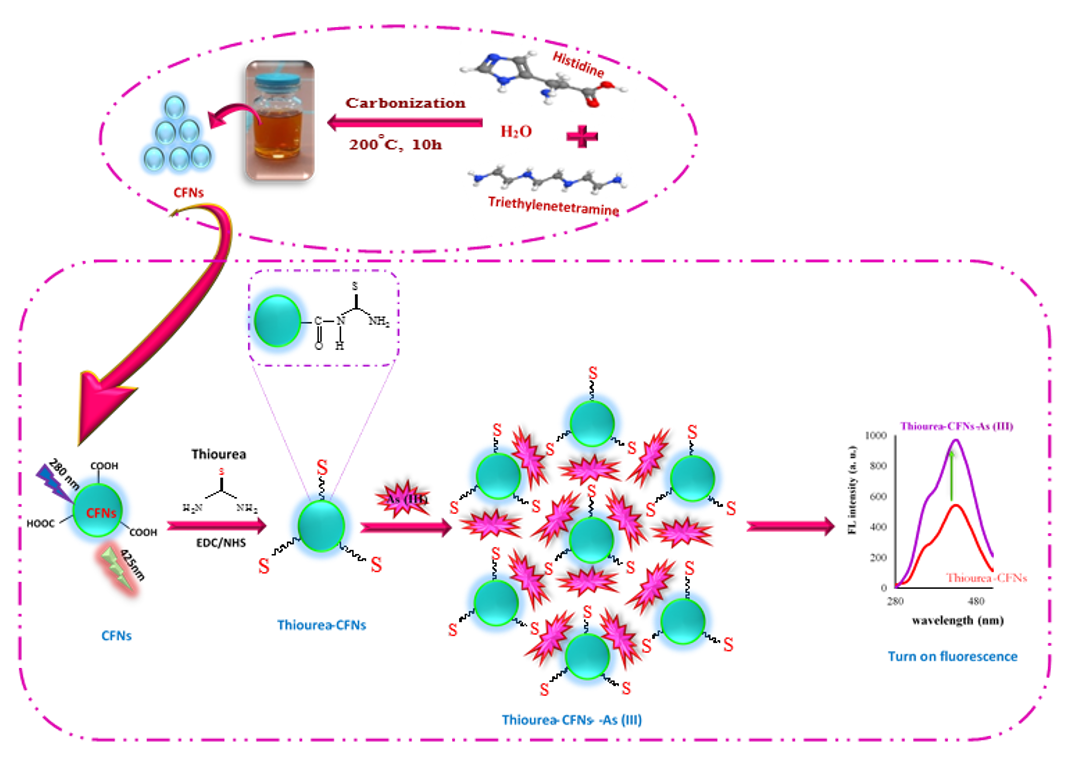
The Turn on mechanism of arsenite detection
The presence of mercapto groups in addition to amine, hydroxy and carboxyl groups at the nanomaterial surface may result in improving the sensitivity and selectivity of inorganic arsenic quantification [26]. Recently, a various mercaptan ligands like cysteine, glutathione, mercapto-acetic acid, dithioretiol, mercapto-propionic acid, etc., have been exploited for the arsenic determination through stable As−S bond formation [15]. Hence, a vast number of sulfur containing ligands (cysteine, cysteamine, p-toluenesulfonamide and thiourea) were investigated in order to construct high sensitive assay for As (III) (Fig. 3a). The highest fluorescence signal was obtained using Thiourea-CFNs. According to Scheme 1, the turn on mechanism for detecting As (III) by the proposed assay is clearly observed. In the presence of As (III), the fluorescence intensity of modified CFNs is significantly increased due to the selective interaction and coordination of arsenic (III) with sulfur groups of thiourea. According to the hard-soft-acid-base (HSAB) theory, As (III), known as a “soft” acid similar to Hg2+ [27], preferentially interacted with “soft” base groups existing on the surface of CFNs. The sulfur atom onto the Thiourea-CFNs surface bound to As (III), leading to a stable As (III)− Thiourea-CFNs complex by presenting lone pairs into unfilled orbitals of As (III). Usually, Metal-improved fluorescence mechanism is because of surface plasmon enhanced fluorescence (SPEF) or chelation enhanced fluorescence (CHEF). Since, according to Fig. 1a, no obvious change in the modified CFNs adsorption spectra was observed in the absence and presence of As (III), the CHEF mechanism is proved [28]. Furthermore, the formation of a stable complex of arsenic (III) and a thiourea ligand causes increasing molecule hardness and enhancing fluorescence signal.
Optimization of experimental condition
In order to improve the detection efficiency of the proposed sensor for the As (III) detection, some experimental conditions including the effect of different ligands, various excitation wavelength, the concentration of ligand, different pH at the range of 3–10, and also stability of Thiourea-CFNs in the absence and presence of As (III) in 60 min were investigated. One of the interesting features of CFNs is the dependence of their emission spectra position on the excitation wavelength, which has a red shift emission wavelength as the excitation wavelength increases. This property can be because of the broad size distribution of dots (quantum effects) and surface chemistry, various kinds of emissive traps (solvation effect) [22]. As shown in Fig. 3b, when the excitation wavelength is altered from 240 to 400 nm, a red shift of the maximum emission wavelength of CFNs was observed from 410 to 490 nm. As can be seen, the maximum emission response (λem = 425 nm) of the sensor was obtained when the excitation wavelength was 280 nm (Fig. 3b). Moreover, the effect of different concentrations of thiourea ligand (0.5, 1, 5 and 10 mg mL− 1) were examined for improving performance proposed assay, and the best fluorescence response was achieved for concentration of 5 mg mL− 1 (Fig. 3c).
The pH value of the sample solution plays a crucial role on the fluorescence intensities and is an effective parameter in obtaining a sensitive arsenic sensor. Hence, the fluorescence intensity changes of CFNs-Thiourea in the presence and absence of arsenic (III) at varying pH (3.0–10.0) were calculated. As shown in the Fig. 3d, the designed sensor performance at acidic and basic pH is weaker than neutral pH. At low pH, the amine and thiole groups on the CFNs-Thiourea surface that can interact with metal ions become protonated. There is a definite link between protonating functional groups of ligands and lose their capability to complex heavy metal ions. At high pH values, most of As (III) species are present in the form of metal hydroxides [29]. However, in a highly acidic (<5) or basic medium (> 8), the fluorescence signal change reduced considerably. The highest fluorescence intensity change was observed at the mid-pH range of 6–8 [30]. Therefore, pH = 7 was selected as the optimal pH for As (III) determination in the subsequent tests. Moreover, it is crystal clear that investigating the stability of fluorimetric sensor is a significant feature affecting the reproducibility and accuracy of fluorescence signal. Thus the stability of aqueous solution of CFNs-Thiourea and upon addition of As (III) to present system was examined (Fig. 3e and f). The fluorescence intensities were recorded throughout 60 min that the results exhibited the signal remained relatively stable.
Analytical performance of the CFNs-Thiourea probe towards As (III)
To prove the applicability of this fluorescence assay, we assessed the response of the CFNs-Thiourae probe towards different amounts of As (III) in the range from 3.3 to 828.5 ppb under optimal conditions. According to Fig. 4a, the fluorescence signal of CFNs-Thiourae was gradually increased as the concentration of As (III) changed from 3.3 to 828.5 ppb. The fluorescence signal changes (ΔF= (F − F0)) as a function of the As (III) concentration investigated, which F and F0 are the fluorescence intensities of the CFNs-Thiourea probe in the presence and absence of various concentrations of As (III), respectively. A good linear relationship in the range of 3.3 to 828.5 ppb with regression equation of ΔF = 0.5056CAs + 22.234 and a correlation coefficient (R2 = 0.9914) was obtained (Fig. 4b). Meanwhile, the detection limit for As (III) was measured to be 0.48 ppb (3σ/s), which lower than the World Health Organization (WHO)’s limit for arsenic in drinking water (10 µgL− 1) (σ shows the standard deviation of ten blank measurements, and s is the slope of the regression equation). Table 1 displays the performance of the present methodology assessed by comparing with recent reported procedures for measuring of As (III). As presented in Table 1, the sensitivity and linear range of the designed sensor were comparable or more sensitive than the reported methods without the need for complex apparatus signifying that the CFNs-based fluorescent probe has great potential for determination of As (III).
Table 1
Comparison of the performance of presented sensor with different reported sensors for Arsenic detection
|
Detection system
|
Nanomaterials
|
Linear range
|
LOD
|
Ref.
|
|
Electrochemical
|
gold nanotextured electrode (Au/GNE)
|
0.1 to 9 µgL− 1
|
0.1 µgL− 1
|
1
|
|
Fluorescence
|
Magnetic bead
|
10 pM to 1µM
|
2 pM
|
2
|
|
Fluorescence
|
Carbon quantum dots
|
5 to 100 µgL− 1
|
0.086 µgL− 1
|
15
|
|
Ratiometric fluorescence
|
Reduced carbon dot/graphene quantum dot nanohybrid
|
0.5 to 100.0 µgL− 1
|
<0.5 µgL− 1
|
30
|
|
Electrochemiluminescence
|
Polydopamine nanospheres
|
2⋅10− 3 to 2⋅103 µgL− 1
|
1.2⋅10− 3 µgL− 1
|
31
|
|
Electrochemical
|
carbon nanotubes and graphene
|
1 to 10 µgL− 1
|
20 µgL− 1
|
32
|
|
Colorimetric and smartphone
|
gold nanoparticles
|
10 to 800 µgL− 1
|
4 µgL− 1
|
33
|
|
Fluorescence
|
CFNs-Thiourea probe
|
3.3 to 828.5 µgL− 1
|
0.48 µgL− 1
|
This work
|
Interference and Selectivity study
To study further the potential efficacy of the sensor, fluorescence intensity changes in the presence of 7×10− 6 M As (III) and 7×10− 4 M different interferers ( metal ions - Ni2+, Fe3+, Cu2+, Ca2+, Mg2+, Zn2+, Fe2+, Hg2+, Pb2+, Mn2+, Cr3+, Co2+, Cd2+, Bi3+, Al3+ and As (V) and also anions - NO3−, NO2−, F−, Cl−) were measured. As exhibited in Fig. 5, the CFNs-Thiourea probe response was selective towards As (III) compared to other chemical species at a 100-fold concentration of As (III) and interfere species did not cause any significant changes in the fluorescence intensity of CFNs-Thiourea.
Real samples analysis
To estimate the applicability of the suggested fluorescent sensor, this assay was applied to the detection of As (III) in spiked water samples. The collected water samples from different cities (Baneh, Sanandaj and Ghorveh, Iran) were filtered through a 0.7 µm membrane to eliminate particles. Various amounts (6.32 to 118.01 µgL− 1) of As (III) were spiked on tap water samples and the As (III) ion was measured by the aforementioned method. As revealed in Table 2, the analytical recovery of As (III) in spiked tap water samples were acquired in the range of 90.67–102.0%, with relative standard deviation (RSD %) < 7.0%, demonstrating a reliable procedure for sensing of As (III) ion.
Table 2
Recovery experiments using the proposed sensor for As (III) determination in the water samples
|
Samples
|
Added concentration (µg L− 1)
|
Found concentration (µg L− 1)
|
Recovery%
|
RSD%
(n = 3)
|
|
Baneh tap water
|
0
10
30
60
80
100
120
|
1.08
11.11
31.1
62.02
81.02
99.58
118.01
|
-
100.3
100.06
101.6
99.92
98.5
97.44
|
2.3
6.09
3.7
2.8
4.75
3.68
4.2
|
|
Qorveh tap water
|
0
20
30
40
|
0.56
19.25
29.23
41.36
|
-
93.45
95.60
102.00
|
3.2
6.79
5.42
0.67
|
|
Sanandaj tap water
|
0
6
9
12
|
0.52
6.32
9.58
11.4
|
-
96.67
100.67
90.67
|
3.67
2.80
3.09
6.83
|