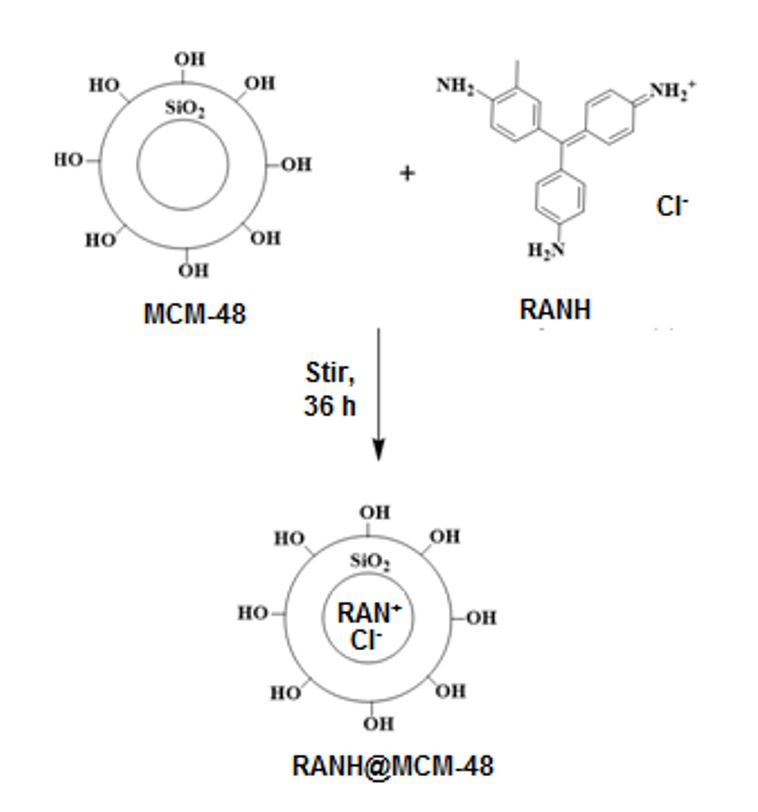
Characterisation of RANH@MCM-48
Thecharacterisations of RANH@MCM-48 was done by the approaches of FTIR, PXRD, N2 adsorption-desoprtion studies and SEM-EDX analysis. The FTIR spectra of MCM-48 and RANH@MCM-48 (Fig. 1) shows a broad band at 3452 cm-1 and a weak band at 1638 cm-1 due to O-H stretching vibration and O-H bending vibration assigned to adsorbed water molecules in these materials. One broad band observed at 1093 cm-1 and a shoulder, observed at around 1250 cm-1 are due to internal and external asymmetric Si-O-Si stretching vibration respectively. The bands observed at 800 cm-1 and 968 cm-1 are assigned to symmetric stretching of Si-O-Si bonds and stretching vibration of Si-OH bonds respectively. The band observed at 1598 cm-1 is due to the NH2 bond of the dye molecule. The FTIR spectra of RANH@MCM-48 also showed a series of bands in the region 1300-1590 cm-1 which are due to the presence of the guest molecule in the silica network.
The low angle XRD data (Fig. 2) shows a peak at 2.5o and around 3o corresponding to (211) and (220) plane. Two low intensity peaks appear between 4o and 5o corresponding to (420) and (332) plane. The pattern clearly shows presence of an Ia3d cubic mesoporous framework. The XRD pattern of RANH@MCM-48 shows a similar pattern with a decrease in intensity of the corresponding planes. The decrement in intensity indicates lossof crystallinity and ordering of the mesoporous material after introduction of dye molecule into it.
The N2 adsorption-desorption isotherm showed typical type IV isotherm with H3 hysteresis loop which are characteristics of highly ordered mesoporous materials (Fig. 3). A sharp inflection at relative pressure p/po = 0.2-0.3 was observed, indicating the capillary condensation of N2 gas within the uniform pores of MCM-48 material. The uniformity of pore size distribution was indicated by the sharpness and height of inflection point. After the introduction of the dye into the channels of cubic mesoporous MCM-48, the surface area, pore volume and pore diameter were found to decrease as evident from table 1. This suggests the occupation of pores by the dye molecules which results in the decrease of mesoporous ordering.
Table 1: Textural properties of MCM-48 and RANH@MCM-48
|
Material
|
Surface Area,
ABET (m2g-1)
|
Pore Volume,
VBJH (cm3g-1)
|
Pore Diameter,
DBJH (nm)
|
|
MCM-48
|
1205.03
|
0.48
|
2.52
|
|
RANH@MCM-48
|
567.23
|
0.27
|
2.29
|
Fig. 4 a showsthe SEM image of MCM-48 which have spherical morphology. After the introduction of the dye molecule, the morphology showed some distortion and irregularity of spherical shapes with agglomeration (Fig. 4 b). This indicates that the dye is deposited onto the surface and into the mesopores of MCM-48. The energy disperse X- ray analysis (EDX) confirms the coating of RAN in the pores of MCM-48 sample (Fig. 4 c, d). The energy disperses X- ray (EDX) elemental mapping analysis also demonstrates the uniform distribution of the dye into the MCM-48 material. Fig. 5 shows EDX elemental mapping of O, Si, C and N in RANH@MCM-48.
RANH@MCM-48 as Fluorescent Sensor for DA
0.01g of RANH@MCM-48 composite was dispersed in 5.0 mL of methanol and sonicated for 10 minutes to obtain a fine dispersion. 10-3 M DA solution was prepared in deionised water in PBS (phosphate buffer solution, at pH 7.41). 10-3 M solution of other biomolecules such as ascorbic acid (AA), glucose (Glu), uric acid (UA) and cholesterol were similarly prepared. The UV-Vis spectrum of RANH@MCM-48 in methanol was measured and the excitation wavelength for the fluorescence spectroscopic experiments was fixed at 280 nm. Fig. 6 shows the fluorescence spectra of RANH@MCM-48 in the presence of one equivalent of DA, AA, UA, Glucose and Cholesterol. Fluorescence enhancement was observed only in case of DA while AA, UA, Glucose and Cholesterol had no significant effect on the fluorescence spectra of RANH@MCM-48. Fig. 7 shows the fluorescence spectra of RANH@MCM-48 at different added concentration of DA in aqueous solution. Fig. 7, inset shows the plot of fluorescence intensity vs. DA concentration which is linear. The linear range was found to be 0.5×10⁻⁵ M to 6×10⁻⁵ M. Since AA is the main interfering agent of DA detection in biological fluids and therefore we recorded fluorescence spectra of RANH@MCM-48 in the presence of AA (Fig. 8). From the figure it is clear that DA could enhance the fluorescence intensity of RANH@MCM-48 even in the presence of AA rather to a higher extent of about thirty times. Fig. 8, inset shows that the linear range for DA detection in the presence of AA is 0.5×10⁻⁵ M to 5×10⁻⁵ M. The limit of detection (LOD) for the sensing ability of RANH@MCM-48 towards DA were calculated as per reported method [45] and found to be 65nM and 51 nM respectively in absence and in presence of AA.
UV-Vis spectra of RANH@MCM-48 were recorded in methanol at different added concentration of DA (Fig. 9). It can be seen that the hump at 281 nm of RANH@MCM-48 becomes prominent with the increase in DA concentration. Inset of the figure shows the plot of fluorescence intensity as a function of DA concentration which is linear and the range is similar to that obtained from fluorescence data.
The reversibility of binding of DA to RANH@MCM-48 has been observed with respect to EDTA2- (Fig. 10). The fluorescence intensity of RANH@MCM-48 in the presence of one equivalent of DA was found to decrease with increase in added concentration of EDTA2-. This clearly indicates that the interaction of RANH@MCM-48 with DA is reversible, which is a primary criteria for a good sensor.
Fig. 11 shows the effect of pH on fluorescence intensity of RANH@MCM-48 and RANH@MCM-48 in presence of DA in universal buffer solution. In case of RANH@MCM-48, the fluorescence intensity increases very little from pH 2.0 to 6.6, then increases marginally till pH 9.2 and decreases till pH 10.2 and remains almost unchanged. In case of RANH@MCM-48 in presence of DA, it was found that the fluorescence intensity remains almost constant in the range of pH 2.0 to 6.6 and suddenly it raises by nine times to attain maximum at pH 7.2. Then fluorescence intensity suddenly starts to drop when pH becomes 8.8 and becomes lowest at pH 9.2 which remains almost same till pH 12.0. Hence the fluorescence window is very narrow i.e. from 7.2 to 8.8 and is in the biological fluid range. Therefore, all the fluorescence measurements were taken at the pH value of 7.4 to avoid any fluorescence fluctuations.
Biological Applications
Detection of DA in artificial cerebrospinal fluid (ACF)
The ability of RANH@MCM-48 to determine DA in ACF was carried out. For this purpose, 5 mL solution of RANH@MCM-48 in PBS was spiked with 300 mL of ACF. The spiked RANH@MCM-48 solution was then titrated against different added concentration of DA by Fluorescence Spectroscopy. An enhancement of fluorescence intensity by about twenty times was observed with a linear intensity vs. DA concentration plot in the range 0.5×10⁻⁵ M to 6.0×10⁻⁵ M (Fig. 12) which suggests the successful detection of DA in ACF medium. The LOD in synthetic ACF medium is calculated to be 27 nM.
Determination of DA in Bovine Serum Albumin (BSA)
The sensor RANH@MCM-48 was successfully applied for detection of DA in bovine serum albumin (BSA) in PBS (pH 7.4). Fig. 13 shows an enhancement of fluorescence intensity for RANH@MCM-48 in BSA medium by about nineteen times and the inset shows linear enhancement in intensity as a function of DA concentration in the range 0.5×10⁻⁵ M to 6.0×10⁻⁵ M. The LOD in BSA medium is calculated to be 22.5 nM.
Electrochemical sensing of DA by RANH@MCM-48
To study the electrochemical behavior of RANH@MCM-48 and its interaction with DA in the presence of AA, the cyclic voltammetry technique was used. A three electrode electrochemical cell consisting of modified platinum (Pt) electrode as working electrode, Ag-AgCl as reference electrode and Pt wire as an auxiliary electrode was used.
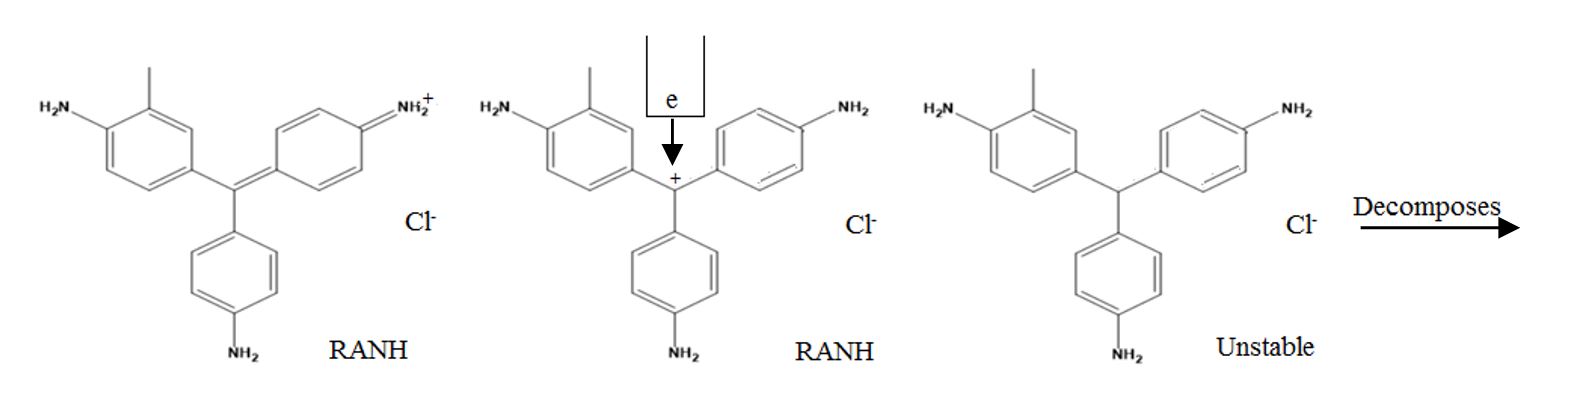
Fig. 14 shows the cyclic voltammogram of RANH@MCM-48/Pt in aqueous medium (PBS, pH=7.41) in the absence of DA (red line) and in the presence of DA (black line). In absence of DA one irreversible reduction peak at -0.497 V was observed which may be due to the electrochemical reduction of [RAN]+ ion into neutral RAN free radical which subsequently breaks down as shown in scheme 2 [46]. In the presence of DA (black line) the cyclic voltammogram shows a redox couple with reduction peak at +0.036 V and oxidation peak at +0.228 V. The separation in peak potential (ΔE) was found to be 0.192 V and E1/2 was calculated to be +0.132 V.
Fig. 15 shows that RANH@MCM-48/Pt electrode is capable of resolving the overlapping oxidation peaks of DA and AA at bare platinum electrode into two distinct oxidation peaks in the mixture of 0.5 mM DA and 1 mM AA. The peak for AA was observed at +0.503 V while the peak for DA was observed at +0.315 V. The separation between the oxidative peaks of AA and DA has been +0.188 V, hence the simultaneous detection of DA in the presence of AA is feasible at modified electrode. The oxidation currents for DA and AA were found to increase with the increase in their concentration simultaneously (Fig. 16). The plot of oxidation current for DA vs. its concentration in the presence of AA was linear (Inset, Fig. 16). Also, as the scan rate increases, the peak currents corresponding to DA and AA increases (Fig. 17).
The Limit of Detection (LOD) of DA in the presence of AA from cyclic voltammogram was calculated using the formula [47]: 3σ/K, where σ = Standard Deviation, K= slope obtained from the plot of Anodic Current vs. concentration (Fig 16, inset). The LOD was calculated to be 77.5 nM.
Influence of other substances in the voltammetric detection of DA and AA
To study the influence of biologically important species that generally co-exist with DA in biological fluids, on the voltammetric detection of DA and AA, the cyclic voltammogram was recorded for DA and AA mixture in presence of Na+, K+, Ca2+, Fe2+, Uric acid, Cholesterol and Glucose. It was found that the presence of these ions/compounds did not interfere with the simultaneous detection of DA and AA by the modified Pt electrode as shown in Fig. 19. The modified electrode has been employed to detect DA in PBS (pH 7.4) spiked with ACF and in BSA with LOD and linear range similar to those in PBS (pH 7.4).