2.1 The MDO protocol
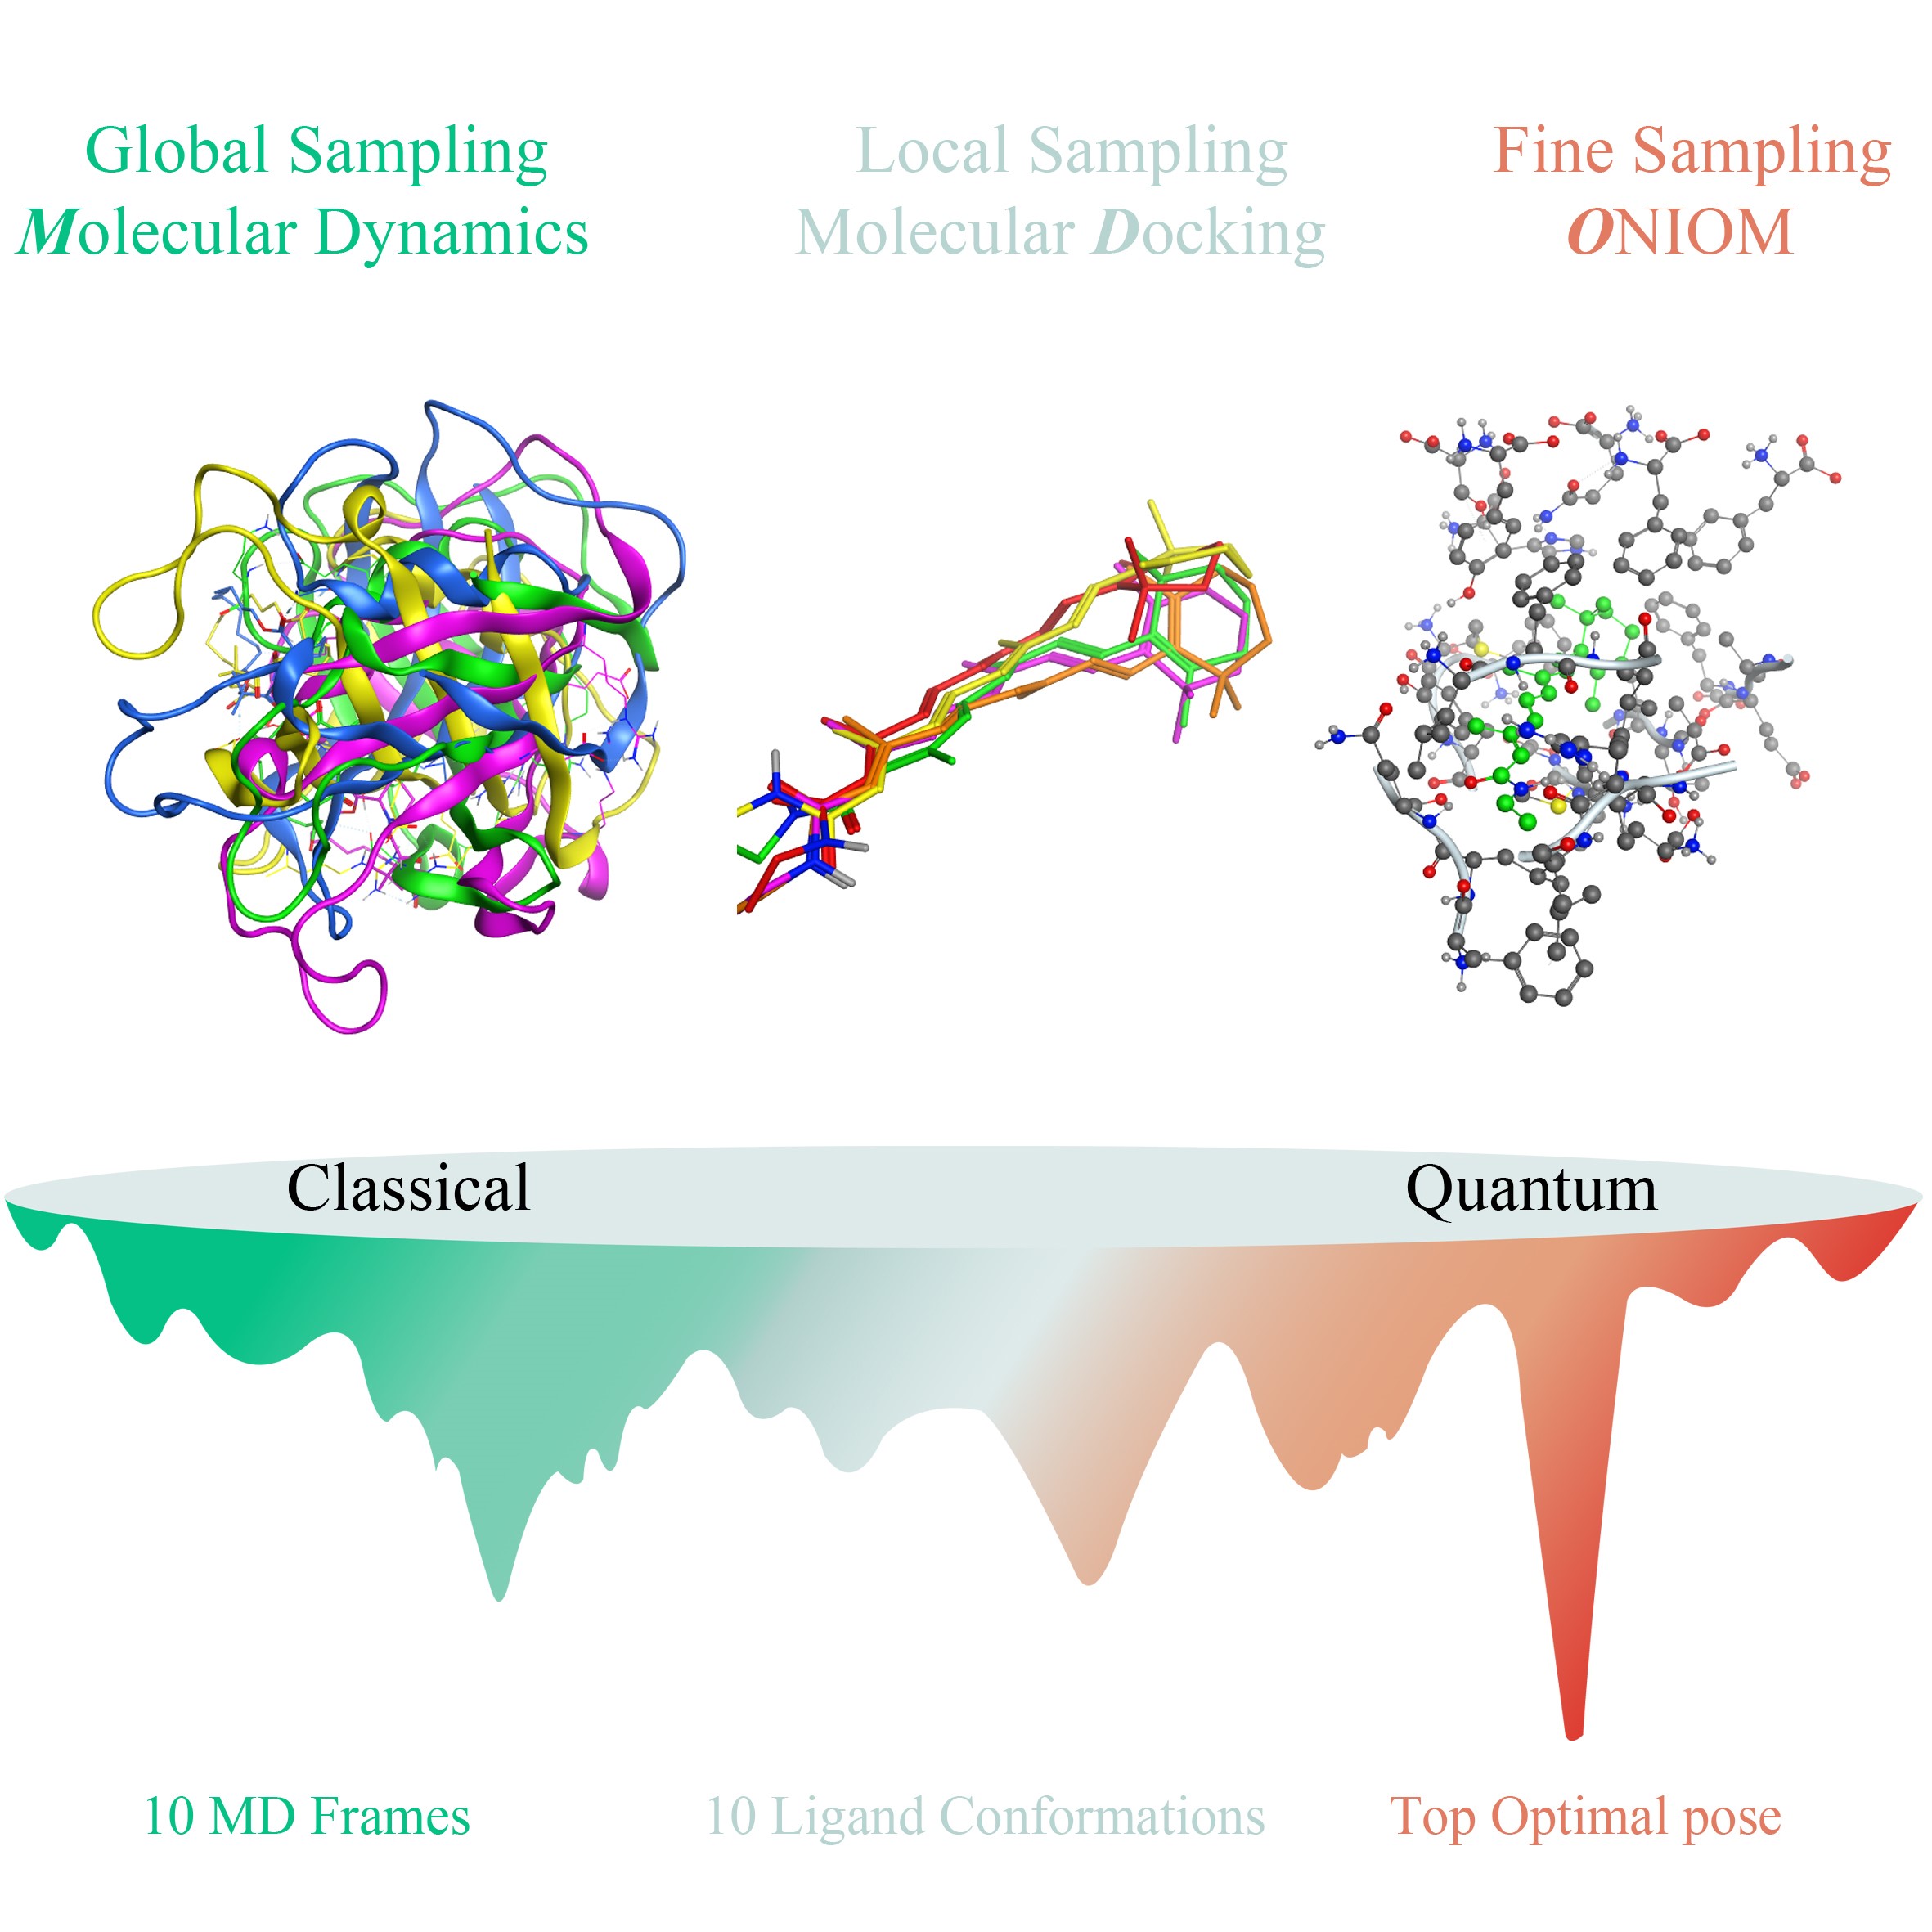
Figure 1 is a schematic of the new computational Protocol, MDO, for the prediction of full flexibility receptor-ligand binding mode structures. As shown in Fig. 1, there are three major steps in MDO: 1) global sampling, 2) local sampling, 3) binding geometry optimization and determination. The details of the three steps are described below.
2.1.1 Global sampling: MD simulations of ligand-receptor system
MD simulations are performed on the interested ligand-receptor bio-complex to generate a large pool of receptor conformations. All the MD trajectories are used in geometric clustering analysis to generate the most representative ligand-protein conformations.
In this work, each bio-complex system is subjected to MD simulation for 10 ns, using Gromacs 2018 package 31,32, periodic boundary conditions (PBC), and CHARMM36 force field 33. Ligand topologies are generated using SwissParam server 34 that is compatible with the CHARMM force fields.
The bio-complex systems were solvated in a cubic box with a TIP3P 35 model of water molecules as a solvent, with 1 A between the bio-complex and the edge of the box. The solvated systems were naturalized by interchanging sodium or chloride ions with the solvent molecules. The systems were relaxed using the steepest descent method with maximum force convergence of 10 kJ mol− 1 nm− 1. The LINCS algorithm was applied to constrain all-bonds 36. The relaxed systems were heated gradually for 100 ps.
The MD runs use the leap-frog integration 37, specifically the leap-frog integrator 38, with the time step of 2 fs, to integrate the equations of motion. The temperature control uses a weak coupling of V-rescale algorithm with a time constant of 0.1 ps 39, pressure coupling used the Berendsen algorithm with a time constant of 0.2 ps 39. The pressure control uses in the Parrinello-Rahman algorithm 40 with a time constant of 0.1 ps. Long-range interactions were treated using Particle Mesh Ewald (PME) method 41,42, with 4-order interpolation, grid spacing for FFT of 0.16 nm, and coulomb radius of 102 nm. The short-range of cut-off distances set to 1.2 nm for calculation of van der Waals (VDW) interactions 43. Randomly initial velocities were generated, using the NPT equilibration over 100 ps.
The MD frames in an interval of 10 ps are saved for analysis. The geometry clustering analysis of the MD trajectories is carried out using the Gromos method 44, after removing the PBC in the MD runs. The Gromos method uses the alpha carbon (C-α) RMSD to characterize the similarity of MD frames. The Gromos algorithm counts the number of neighbors of the frames using an RMSD threshold, discovers the frame with the largest number of neighbors as the frames centroid, removes the frames from the pool, and repeats the procedure for the remaining frames. While the top clusters represent the highest probabilities of the MD frames, only one frame for each cluster representing the cluster centroid is extracted as a PDB file for use in the molecular docking study. The RMSD threshold is varied between 0.1 nm and 0.15 nm to find the optimal threshold 45 for each ligand-receptor bio-complex in this study.
2.1.2 Local sampling: rigid docking and clustering
Molecular docking is carried out for each clustering structure obtained from the MD simulations to generate more suitable ligand conformations. Information about the presence of atoms in the chosen receptor conformation is used to avoid steric clashes and bad geometry of the ligand. Ligand conformations obtained during docking simulation were clustered using the Ensemble Cluster program. This program clusters the members of the ligand conformational ensemble and identifies the cluster representatives using the pair-wise best fit RMSDs.
The molecular docking simulations are performed with the DOCK program in the Molecular Operating Environment (MOE) 46. Ligand conformations are generated with the bond rotation method. The docking is accomplished by using the DOCK program with the default setting, i.e. 'Triangle matcher/London dG' and 'Rigid Receptor/forcefield/GBVI-WAS dG' parameters were chosen as placement and refinement methods, respectively. The docking generates ~ 200 ligand conformations for every representative of the 10 top MD frames, i.e. a total of ~ 2000 ligand conformations are generated for every receptor.
Clustering of ligand conformations obtained from the docking simulations is performed using the ensemble cluster tool in the UCSF-Chimera software 47. This tool applies the approach of Kelley et al 48. The ensemble of conformations is grouped into clusters of similar conformations. One conformation from each cluster is selected to exemplify the conformations in that cluster. After clustering, the top 10 binding poses for each of the 10 most populated protein conformations, or a total of 100 binding poses, are left to represent the likely ligand-receptor binding modes.
2.1.3 Geometry optimization and ranking of ligand-protein binding poses
The top 100 most populated binding modes obtained above for each ligand-protein complex are subjected to geometry optimization using the ONIOM method. The binding mode structures are then ranked by the final ONIOM energy. The top ranked binding structure is taken as the best ligand-receptor binding mode structure.
The ONIOM calculations are carried out at the level of wB97X-D 49/6-31G*: PM6 50. All amino acid (AA) residues within 6 A of ligand atoms are included in the ONIOM calculation. There are about 700 atoms in the AA residues of the ONIOM system in this study. The ONIOM system is divided into two layers, a high-level part for the ligand, treated at the wB97X-D/6-31G* level, and a low-level part for the selected AA residues, treated at the PM6 level. The geometry optimizations of the large bio-systems are performed with the "loose 51" convergence criterion. The ONIOM calculations are conducted with the Gaussian09 suite of software 52.
2.2 Testing set of bio-complex systems
The proposed computational protocol MDO is tested on fifteen protein-ligand complexes whose x-rays crystallographic structures are available in the protein data bank (PDB) 53. The PDB IDs of the 15 bio-complexes are: 1ERB 54, 1FKI 55, 1HW9 56, 2IFB 57, 1FKG 55, 1HW8 56, 3GI5 58, 1HWI 56, 2I0A 59, 3MDX 60, 2QI3 61, 1HWJ 56, 1LF2 62, 1HWK 56, 1LF3 63. When there are more than one ligands in a bio-complex, the first ligand is chosen for the study. Basic information about the 15 ligands can be found in Table S1 of the Supporting Information. In addition to having accurate 3D crystallographic structures in PDB, the 15 bio-complex systems are bound by non-covalent interactions. When preparing the bio-complexes for testing the MDO protocol, water molecules and ions presented in the crystal structures are detached. Missing atoms or residues that should exist in the crystallographic structure are added. Each bio-complex is assigned at the physiological conditions for titratable residues using preparation and 3D-protonation module of MOE.
Considering the flexible nature of MDO and for more comparison, we also perform flexible (induced fit) docking with the DOCK software on the bio-complexes, using Charmm27 for the energy minimization. Like the rigid docking, the bond rotation method is also used in the induced fit for the generation of ligand conformations. The induced fit uses the settings 'Triangle matcher/London dG' and 'Induced-Fit/forcefield/GBVI-WAS dG' for the conformation placement and refinement, respectively.