The ComprFinder algorithm was carried out to obtain a final score (FS) which was used to rank the potential RGs. In the breast tumor tissue group, the 3 most stably expressed RGs were SF1, TRA2B, and THRAP3 (Table 2). In the breast cancer cell lines, THRAP3, RHOA, and QRICH1 were the most stably expressed RGs (Table 3). For all samples combined, we ranked the RGs from the highest to the lowest stability as follows: THRAP3 > RHOA > QRICH1 > YY1 > TRA2B > RPL13A > SF1 > SRSF3 > GUSB > TARDBP > DNAJC8 > RNF10 > GAPDH > TUBA1A > B2M > ACTB. Interestingly, the top 5 most stable genes (THRAP3, RHOA, QRICH1, YY1, and TRA2B) were novel RGs. In contrast, the traditionally used RGs TUBA1A, B2M, and ACTB were the least stably expressed RGs.
The research presented here confirmed that THRAP3, RHOA, QRICH1, YY1, and TRA2B were the most stable RGs in all samples with FS values of 0.064, 0.101, 0.122, 0.151, and 0.161, respectively (Table S4). These promising results warranted further validation of the selected RGs.
Validation of the selected genes (1): comparison of target gene profiles when using different normalized RGs
To verify the reliability of the selected RGs, the expression profiles of MAPK3, MAPK9, FAAH, and HIF1A were determined in different breast cancer tissues and cell lines with different normalization factors (NF, i.e., the single- or multi-RG combinations). Our results indicated that SF1, TRA2B, and THRAP3 were the top 3 stably expressed RGs in breast cancer tissues and that THRAP3, RHOA, and QRICH1 were the top 3 stably expressed RGs in breast cancer cell lines. Moreover, five genes (SF1, TRA2B, THRAP3, RHOA, and QRICH1) were the top 5 stably expressed candidate RGs in all samples. Therefore, we considered the multi-RG combination SF1 + TRA2B + THRAP3 + RHOA + QRICH1 as the most promising NF for breast cancer research (both in breast cancer tissues and cells). Thus, the multi-gene combinations including SF1 + TRA2B + THRAP3 + RHOA + QRICH1, SF1 + TRA2B + THRAP3, THRAP3 + RHOA + QRICH1, SF1 + THRAP3, THRAP3 + RHOA, and single RGs including SF1, TRA2B, THRAP3, RHOA, and QRICH1 were compared. In addition, ACTB, GAPDH, and ACTB + GAPDH were also used for comparison with the novel RGs. In total, 13 different multi-RG combinations or single RGs were assessed as NFs. For multiple gene combinations, the geometric average of their Ct value was calculated. The relative gene expression level was calculated as 2−ΔCt, ΔCt = Δ (Cttargetgenes-CtRGs).
As shown in Fig. 4A, the expression of MAPK3 was significantly higher (P༜0.05) in HR + HER2- cancer tissue than in para-carcinoma tissue or benign tumor tissue when assessed by 5 or 3 multi-gene RG combinations. However, the expression pattern of MAPK3 changed when we used single or 2 multi-gene RG combinations, such as SF1 + THRAP3, SF1, RHOA, or QRICH1. Importantly, when we investigated the least stably expressed RGs (ACTB, GAPDH, or ACTB + GAPDH), the expression of MAPK3 was significantly changed compared with the most stably expressed RGs.
As shown in Fig. 4B, when using 5 or 3 multi-gene combinations, the expression level of the MAPK9 gene was higher in HR + HER2- cancer tissue than in para-carcinoma tissue (P ༜0.05), while there was no significant difference between para-carcinoma tissue and benign tumor tissue. This may lead to small errors when using single or two multi-gene combinations. For example, when the less stably expressed genes ACTB, GAPDH, or ACTB + GAPDH, were used as the NF, the expression of MAPK9 did not show a clear expression trend compared with those of 5 or 3 multi-gene combinations.
In breast cancer cell lines, when the optimal RG combinations SF1 + TRA2B + THRAP3 + RHOA + QRICH1, SF1 + TRA2B + THRAP3, or THRAP3 + RHOA + QRICH1 were used for normalization, the expression of FAAH was highest in MCF-7 cells, followed by MCF-10A cells, and was least in MDA-MB-231 cells (Fig. 4C). When ACTB, GAPDH, or ACTB + GAPDH were used for normalization, the expression of FAAH was not significantly different between MCF-10A and MDA-MB-231 cells.
The expression of HIF1A in breast cancer cells was higher (P < 0.01) in MCF-10A and MDA-MB-231 cells than in MCF-7 cells, while no significant difference was found between MCF-10A and MDA-MB-231 cells when using the 5 or 3 RG combinations (SF1 + TRA2B + THRAP3 + RHOA + QRICH1, SF1 + TRA2B + THRAP3, or THRAP3 + RHOA + QRICH1) for normalization (Fig. 4D). However, when ACTB or GAPDH (the less stably expressed RGs) were used, we found that HIF1A expression was significantly higher in MDA-MB-231 than in MCF-7 and MCF-10A cells.
The complete relative expression levels (2−ΔCt) of MAPK3, MAPK9, FAAH, and HIF1A genes normalized using all 13 types of single or multiple RG combinations are listed in Additional file 1: Table S5 and Table S6.
Validation of the selected genes (2): the relationship among different normalized RGs
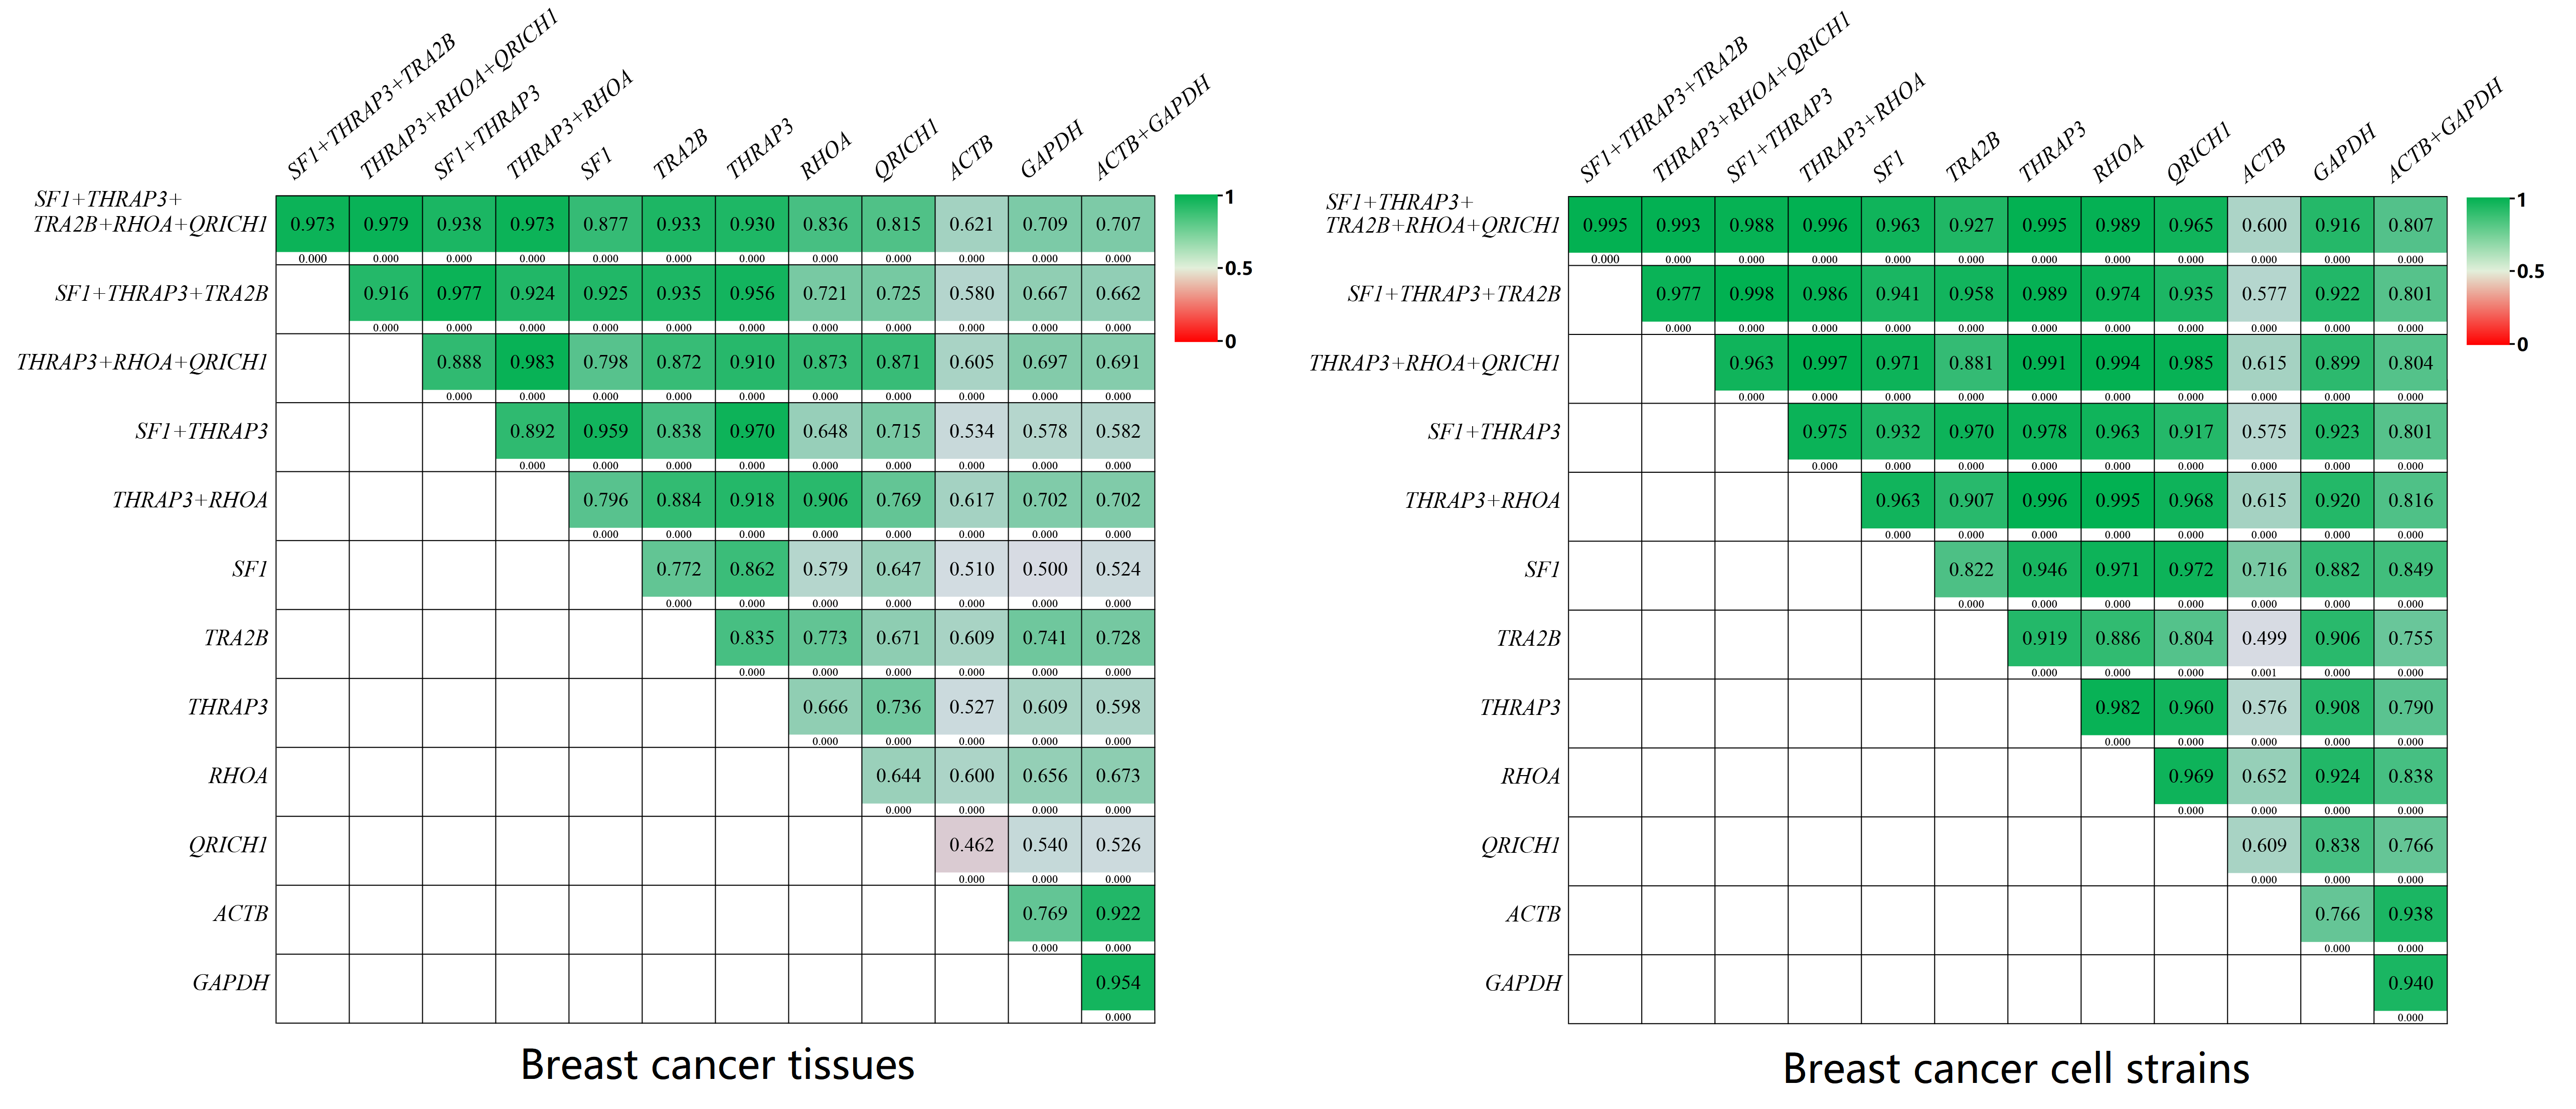
Based on the method described in our previous study [28], the relationship among different normalized RGs was explored. As shown in Additional file 1: Figure S2, there was a high correlation (R2 from 0.815 to 0.979 in breast cancer tissues, and R2 from 0.927 to 0.995 in breast cancer cells) between stable RGs and SF1 + TRA2B + THRAP3 + RHOA + QRICH1. There was also a moderate to high correlation (R2 from 0.621 to 0.709 in breast cancer tissues, and R2 from 0.600 to 0.916 in breast cancer cell s) between unstable RGs and SF1 + TRA2B + THRAP3 + RHOA + QRICH1. There were few differences between the most stably expressed RGs and the least stably expressed RGs. Therefore, we performed additional analyses of their normalized efficacy, including a correlation analysis on the p-value yielded by the t-test analysis (see Method section).
As shown in Fig. 5A, in breast cancer tissues, the normalized results using SF1 + TRA2 + THRAP3 (R2 = 0.847, P < 0.001), THRAP3 + RHOA + QRICH1 (R2 = 0.947, P < 0.001), SF1 + THRAP3 (R2 = 0.827, P < 0.001), or THRAP3 + RHOA (R2 = 0.866, P < 0.001) displayed a high correlation with SF1 + TRA2B + THRAP3 + RHOA + QRICH1 suggesting that they had extremely similar normalization capabilities. SF1, TRA2B, and THRAP3 displayed a moderate correlation (R2 > 0.5), while RHOA or QRICH1 displayed a weak correlation (R2 < 0.5) with SF1 + TRA2B + THRAP3 + RHOA + QRICH1. There was a poor correlation between less stably expressed RGs (ACTB, GAPDH, or ACTB + GAPDH) and SF1 + TRA2B + THRAP3 + RHOA + QRICH1. Similar results were found for the breast cancer cell lines (Fig. 5B). The complete p-value results yielded by t-test analysis are given in Additional file 1: Table S7 and Table S8.