3.2. NPs characterizations:
3.2.1. X-ray diffraction:
XRD patterns of IONPs shown in Fig. 1. As can be seen,the XRD patterns reveal the characteristic diffraction peaks of cubic Fe3O4 (ICDD no. 01-088-0315) and cubicFe (ICDD no. 01-087-0722), respectively[8, 25]. The XRD pattern related to the S07 sample (Table 1) is presented in Fig. 2which exhibit diffraction peaks of hexagonalZnO (ICDD no. 01-079-0205) and cubic ZnFe2O4 (ICDD no. 01-089-1010), respectively[1, 26, 27]. The average crystallite size of the all samples which was calculated using Scherrer’s formula are presented in Table 2.
Increasing the electric current intensity increases the driving force needed to create finer nuclei of nanoparticles, the result is nanoparticles with smaller grain sizes. On the other hand, nanoparticles can form and grow both directly from plasma and from existing solid nuclei. High current intensity and high cooling rate probably lead to the formation of nanoparticles with smaller granulation[22, 28, 29].
As the wire diameter decreases and the resulting particle size decreases, the percentage of oxide phase increases. Oxidation of metal nanoparticles depends on the particle size. Oxidation is a chemical reaction and chemical reactions take place on the surface; So in order to continue the reaction, more levels must be provided for the reaction. The smaller the particle size, the greater the amount of surface atoms; Therefore, as the diameter decreases, the percentage of surface atoms that have access to oxygen due to water evaporation increases, so as the wire diameter decreases and the particle size decreases, the percentage of oxide phase increases[30, 31].As the oxide phase increases, the antibacterial property intensifies.
The weight percentage of each phase was calculated using Rietveld method.The results are shown in Table 2. It is clear that increasing the electric current and decreasing the diameter has increased the oxide phase. Also, the percentage of metal phase in the sample with a larger diameter is higher than other samples. In other words, as the particle size increases, the metal phase increases[32].
Table 2
Oxide and metal phase of nanoparticles.
|
Sample
|
Oxide phase (%)
Fe3O4
|
Metal phase (%)
Fe
|
Oxide phase (%)
ZnO
|
Oxide phase (%)
ZnFe2O4
|
|
S01
|
89
|
11
|
- |
- |
|
S02
|
90
|
10
|
- |
- |
|
S03
|
93
|
7
|
- |
- |
|
S04
|
91
|
9
|
- |
- |
|
S05
|
88
|
12
|
- |
- |
|
S06
|
85
|
15
|
- |
- |
|
S07
|
- |
- |
65
|
35
|
3.2.2. UV-Visible:
the UV-Visible spectraof IONPs and ZONPs are shown in Fig. 3. As can be seen,IONPs had an absorption peak in the range of 200 nm. The particle size and surface area of nanoparticles affect the absorption peak intensity.ZONPs had two absorption peaks in the range of 300 and 350nm which are related to ZnO and ZnFe2O4, respectively[33, 34].
3.2.3. Field emission scanning electron microscopy:
Scanning electron microscopy images are shown in Fig. 4. It can be clearly seen that the iron oxide nanoparticles are completely uniform and spherical in shape. However, in the image related to the Fe-Znsample particles in rod shaped and needle-shaped are seen, which is due to the presence of zinc oxide nanoparticles.FESEM images are taken from a powder sample, and also because of the magnetic nature of iron oxide nanoparticles, the aggregationof nanoparticles and the formation of clusters has been done to a large extent[16, 21, 35]. The average particle size of the samples are given in Table 3.
In the liquid media, in contrast to gaseous media, the size of nanoparticles decreases with increasing the current intensity. As the current intensity increases, the energy input to the wires increases, and fine-grained melt buds are formed during electrical discharge, and due the high cooling rate of these fine particles, nanoparticles with smaller size are produced[21, 30, 36].
Table 3
The average crystallite size and the average particle size of the samples according to the XRD and SEM data.
|
Sample
|
The average crystallite size (nm) (XRD)
|
The average particle size (nm) (SEM)
|
|
S01
|
17
|
35.85
|
|
S02
|
10.45
|
20.25
|
|
S03
|
8
|
10.3
|
|
S04
|
27.24
|
17.7
|
|
S05
|
29.32
|
26.25
|
|
S06
|
30.45
|
35.5
|
|
S07
|
18.46
|
30.9
|
3.2.4. TEM and HR-TEM:
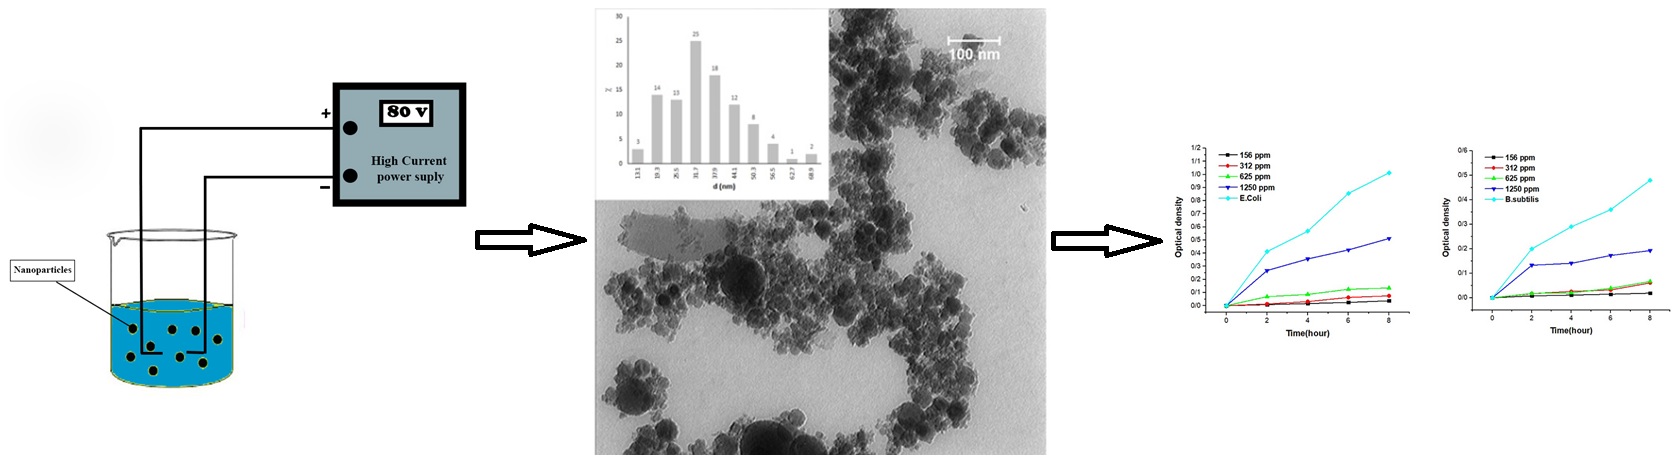
Figure 5 shows the transmission electron microscope images of the synthesized samples. As can be seen, the synthesized iron oxidenanoparticles have a spherical and uniform morphology. With increasing current intensity from 300 amps to 500 amps, the average particle size has decreased from 26.50 nm to 11.25 nm. Also, by reducing the wire diameter from 0.5 mm to 0.2 mm, the average particle size has decreased from 33.50 nm to 11.25 nm. In addition, the images show the core-shell structure.The core contains pure iron and the shell contains iron oxide[27, 37, 38].
Figure 6. a and b show the TEM images of Fe-Zn nanoparticles. As can be seen, zinc oxide nanoparticles with a rod structure are seen. The average particle size is in the range of 20 nanometers. The core-shell structure is also clearly seen in the images. Also Fig. 6. c and d present the SAED pattern and HR-TEM images Respectively[39].
3.3. NPs antibacterial activity:
3.3.1. Growth curve analysis:
Figure 7 and 8reveal the antibacterial activity of iron nanoparticles against both bacteria. The best result is obtained in the S03 and S07 samples, which have the lower average particle size (according to SEM and XRD images) due to the higher current intensity.
in each chart, bacterial growth is reduced or completely inhibited by increasing the concentration. This phenomenon can be exacerbated bythe interaction between bacteria and nanoparticles and thus the activation of antibacterial mechanisms. The effective mechanism for antibacterial effect of the iron oxide nanoparticles is the ROS production process as well as the reaction of Fe2+ with oxygen to produce hydrogen peroxide. Eventually, H2O2 reacts with iron through the Fenton process to produce hydroxyl radicals that damage biological molecules[1, 26, 40].
In the case of sampleS06, it is clear that it has little effect on inhibiting bacterial growth due to the presence of large nanoparticles (according to the SEM and XRD results) as well as the low percentage of Fe3O4 in this sample. Researches has shown that the antibacterial effect of Fe3O4 is greater than other iron compounds due to its greater oxygen supply as a good source for oxidative stress reactions.
The S07 sample showed high antibacterial properties compared to both bacteria. These results are due to the synergistic effect of the presence of iron oxide and zinc oxide simultaneously and thus activating more antibacterial mechanisms. The mechanism of action of iron oxide nanoparticles is the electrostatic interaction between nanoparticles and bacteria as well as the production of reactive oxygen species. The effective mechanisms for zinc oxide can be expressed as electrostatic interaction between nanoparticles and bacteria, production of reactive oxygen species and ion release[4, 40, 41].
3.3.2. Minimum Inhibitory Concentration (MIC):
The results of this study are collected in Tables4 and 5. As can be seen, the iron-zinc oxide sample showed the best performance and at concentrations higher than 312.5 µ g / ml and the bacterial growth was completely stopped.
Simultaneous activation of antibacterial mechanisms of iron oxide and zinc oxide nanoparticles has created a synergistic effect in stopping the growth of bacteria. In the case of sample S06, even at the highest concentration, despite the positive effect, but complete cessation of growth is not seen. The large size of the nanoparticles has reduced the possibility of penetration into the bacterial cell and as a result is less effective[5, 40, 42].
Table 4
the result of MIC method for E.Coli.
|
Concentration(µg/ml)
|
S01
|
S02
|
S03
|
S04
|
S05
|
S06
|
S07
|
E.Coli
|
|
10000
|
-
|
-
|
-
|
-
|
-
|
0.0125
|
-
|
1.42
|
|
5000
|
-
|
-
|
-
|
-
|
-
|
0.03
|
-
|
1.491
|
|
2500
|
-
|
-
|
-
|
-
|
0.064
|
0.132
|
-
|
1.524
|
|
1250
|
-
|
-
|
-
|
-
|
0.1335
|
0.223
|
-
|
1.463
|
|
625
|
0.119
|
0.1425
|
0.05
|
0.1895
|
0.2625
|
0.406
|
-
|
1.403
|
|
312.5
|
0.1835
|
0.26
|
0.1245
|
0.2425
|
0.3455
|
0.601
|
0.0015
|
1.515
|
|
156.25
|
0.2245
|
0.3975
|
0.1685
|
0.357
|
0.4265
|
0.8875
|
0.102
|
1.468
|
|
78.125
|
0.3335
|
0.434
|
0.223
|
0.432
|
0.725
|
1.13
|
0.175
|
1.526
|
Table 5
the result of MIC method for B.Subtilis.
|
Concentration(µg/ml)
|
S01
|
S02
|
S03
|
S04
|
S05
|
S06
|
S07
|
B.Subtilis
|
|
10000
|
-
|
-
|
-
|
-
|
-
|
0.0125
|
-
|
0.91
|
|
5000
|
-
|
-
|
-
|
-
|
-
|
0.1065
|
-
|
0.9
|
|
2500
|
-
|
-
|
-
|
-
|
0.1015
|
0.1745
|
-
|
0.94
|
|
1250
|
0.099
|
0.072
|
0.006
|
0.0765
|
0.164
|
0.228
|
-
|
0.87
|
|
625
|
0.131
|
0.1255
|
0.1185
|
0.1455
|
0.269
|
0.421
|
-
|
0.96
|
|
312.5
|
0.157
|
0.24
|
0.1625
|
0.208
|
0.306
|
0.606
|
-
|
0.88
|
|
156.25
|
0.2435
|
0.3765
|
0.1825
|
0.348
|
0.4575
|
0.825
|
0.1205
|
1.1
|
|
78.125
|
0.309
|
0.354
|
0.2125
|
0.381
|
0.6125
|
1.029
|
0.1645
|
1.15
|
Figure 9. show the antibacterial effect of nanoparticles against E.Coli and B.Subtilis bacteria by MIC method, respectively. According to these diagrams, with increasing current intensity at constant diameter, the antibacterial effect is improved and also by decreasing the wire diameter at constant current, the antibacterial activity of the samples is increased. Finally, based on the results obtained in the MIC method the bacterial strain of E.Coli is more sensitive than B.Subtilis[1, 43, 44].