This work demonstrates the spectral and amplified spontaneous emission (ASE) properties of a new chalcone laser dye material of 1-(4-methylsulfonyl phenyl)-3-(4-N, N dimethyl amino phenyl)-2-propen-1-one (MSPPP). The absorption, fluorescence, Stokes’ shift and quantum yield were obtained using different organic solvents. The energy band gap was calculated and compared with that of 3-[4-(dimethylamino) phenyl]-1-phenyl-(2E)-propen- 1-one (DAPPP). These include absorption, fluorescence, stokes shift, and amplified spontaneous emission (ASE). The absorption spectra of MSPPP showed a wavelength band in the range 403–427 nm, whereas the fluorescence spectra exhibited a band at 472–533 nm. ASE was observed under pump pulse laser excitation, and the wavelengths were attuned from 511 to 548 nm.
Research Article
Spectral and ASE Properties of 1-(4-Methylsulfonyl Phenyl)-3-(4-N, N Dimethyl Amino Phenyl)-2-Propen-1-One (MSPPP)
https://doi.org/10.21203/rs.3.rs-943321/v1
This work is licensed under a CC BY 4.0 License
Version 1
posted
You are reading this latest preprint version
Chalcone
Quantum yield
Fluorescence
Energy gap
ASE
In the past few decades, studies on photophysical properties of organic fluorescent compounds have been a subject of intensive investigation due to their increasing application in electronic and optoelectronic devices, biomedical imaging, and fluorescence sensors [1–5]. The dye lasers based on rhodamine and coumarin derivatives are excellent laser media, but they have some shortcomings, such as a lack of photochemical stability [6–8]. Hence, the chalcones should result in good dye lasers. However, the photophysical properties depending on the solvent environment and the influence of the FGs have not been fully studied. In an earlier study, we fabricated a series of new lasing dyes based on N, N-dimethylamino chalcones, with a particular focus on studying the influence of functional groups attached to ring A. The optical properties such as absorption, emission, fluorescence quantum yield, Stokes’ shift, energy bandgap, and amplified spontaneous emission (ASE) of these chalcones were studied and compared with the conventional laser dye (coumarin 503). These chalcones had excellent levels of optical activity, better than coumarin 503. [9]. The main purpose of this work is to provide insight into the spectral and laser properties of 1-(4-methylsulfonyl phenyl)-3-(4-N, N dimethyl (amino phenyl)-2-propen-1-one chalcone (MSPPP) and compare it with DAPPP which also has outstanding optical properties with no functionality in ring A, as shown in Sheme1 (Scheme 1). [9].
2.1 Chemical synthesis and characterization
MSPPP and DAPPP were synthesized via a simple condensation reaction between a suitable benzaldehyde and acetophenone in the presence of sodium hydroxide as catalyst and ethanol as solvent. The products were recrystallized from ethanol and characterized using H1NMR, FTIR, and UV–Vis’s spectroscopy, as previously described Attia, M. F. et al. [9]. The molecular structures of MSPPP and DAPPP are presented in Scheme 1. The product was characterized by H1-NMR, C13- NMR, mass, and UV–Vis’s spectroscopy. δH (400 MHz, from 0 to 11 ppm) 1H NMR: δ 2.86 (6H, s), 3.07 (3H, s), 6.47 (1H, d, J = 15.6 Hz), 6.84 (2H, ddd, J = 8.2, 1.2, 0.4 Hz), 7.47–7.58 (3H, 7.51 (d, J = 15.6 Hz), 7.55 (ddd, J = 8.2, 1.5, 0.5 Hz)), 7.81 (2H, ddd, J = 7.9, 1.9, 0.5 Hz), 8.01 (2H, ddd, J = 7.9, 1.5, 0.5 Hz). δC: δ 40.3 (2C, s), 44.3 (1C, s), 112.0 (2C, s), 121.2 (1C, s), 128.4 (2C, s), 128.6 (2C, s), 128.9 (2C, s), 130.3 (1C, s), 135.5 (1C, s), 137.4 (1C, s), 144.1 (1C, s), 150.9 (1C, s), 188.9 (1C, s). λmax (methanol 419 nm). Figure 1 shows the NMR of MSPPP.
2.2 Spectral analysis
The MSPPPP and DAPPP were dissolved in various organic solvents and in a wide range of concentrations. For measuring the absorption spectra were using a Perkin-Elmer LAMBDA 590 spectrophotometer with a wavelength range from 200 to 800 nm. The fluorescence spectra were measured by a Perkin-Elmer LS55 spectrofluorometer, with a wavelength range of 200 to 900 nm, at room temperature.
2.3 UV laser analysis
A set of solutions of MSPPP and DAPPP were placed in four-sided quartz cuvettes (dimensions: 1 × 1 × 4 cm). The third harmonic generation of an Nd: YAG was used as an excitation source and was focused on the samples using a quartz-cylindrical lens with a focal length of 5 cm to achieve transverse excitation. The pulse duration and pulse repetition rate were 6 ns and 1 Hz, respectively. A green intense ASE was observed as a cone.
3.1 Spectral Properties of MSPPP
3.1.1 Absorption
The absorption spectra of 1-(4-methylsulfonyl phenyl)-3-(4-N, N dimethyl (amino phenyl)-2-propen-1-one in acetone were recorded for a wide range of concentrations from 0.65mM to 6.5mM. It showed an absorption band at 405 nm. By the increasing concentration, there was no new absorption peak in the longer wavelength region of the absorption spectra, and the absorption profile remained unchanged. However, the optical density of the band 405 nm increased monotonically when the concentration was increased see (Fig. 2).
3.1.2 Fluorescence of MSPPP
The fluorescence spectra of MSPPP in acetone, for the different concentrations 0.65–6.5 mM, were investigated. The results showed only one band at 515 nm, the spectra profile did not change irrespective of concentration for this dye. This indicates that the absence of excimer or exciplex for these dye solutions over all the concentrations used, as illustrated in Fig. 3. Moreover, the intensity decreased with an increasing the concentration of the dye.
The above results have been compared with the spectral properties of 3-(4-(dimethyl amino) phenyl)-1-phenyl-(2E)-propen-1-one (DAPPP) as a reference dye [3]. the absorption and fluorescence spectra of DAPPP in acetone for different concentrations ranging from 0.65 to 6.5mM. It showed an absorption band at 405 nm. By the increasing concentration, there was no new absorption peak observed, whereas the fluorescence spectra of DAPPP in acetone under an excitation wavelength of 355 nm for different concentrations (0.65 to 6.5mM). The fluorescence spectra had one band, at 525nm. The difference between MSPPP and DAPPP in their chemical structures is a methyl group attached to para-position to ring A. Here the methyl group is acting as electron donors by inductive effect. The addition of methyl group to DAPPP dye leads to a decrease in the fluorescence wavelength by 10 nm to blue shift, whereas no significant change in the absorption spectra is expected.
To investigate the impact of the solvents on the absorption and fluorescence spectra, the MSPPP was dissolved in different organic solvents with different dielectric constants. The concentration of these solutions was fixed to be 0.65mM. It could be seen that the dielectric constant of the solvents plays an important role in the absorption and emission bands, as showing in Fig. 4 and Fig. 5.
3.2 Optical band‑gap
The optical energy band gaps (Eg) of MSPPP were calculated by using Tauc's relation [10].
$$\left(\alpha hʋ\right)=A(hʋ-{E}_{g}{)}^{\frac{3}{2}}$$ 1
where, h is Planck's constant and ʋ is the frequency of incident photons, A is constant, \({h}_{v}\) is the photon energy, Eg is the optical band gap of MSPPP. The energy band gaps of MSPPP were estimated by extrapolating the linear part of the graph of \({\alpha hv}^{\frac{2}{3}}\) against (hν) until the hν axis was intersected (see Fig. 6). The value of the energy gap of MSPPP obtained by this method is 3.12 eV.
3.3 Stokes’ shift
MSPPP was dissolved in various organic solvents that have different dielectric constants. The concentration was kept at 0.65mM. It was observed that there are very small changes in the absorption and fluorescence spectra, the only difference being a small shift in the peaks of the absorption and the fluorescence wavelengths. The variation of the Stokes shift as a function of the dipole factor of the solvent, as defined by Lippert and Mataga et al. [11] was shown in “Fig. 7 and Fig. 8”. It can be noticed that MSPPP in the solution undergoes considerable changes in the electron delocalization and turn strongly polar in the excited state than in the ground state. The Stokes shift has a linear variation with the dipole factor, which is written as:

where Df is dipole factor, νa and νf are the absorption and fluorescence peaks in wave numbers respectively, ε is the dielectric constant and n is the solvents refractive index. µe is the dipole moment of the solute in the excited state. µg is representing the dipole moment of the solute the ground states, respectively, and a is the radius of the solvent cage around the solute.
This dipole factor is a measure of dipole-dipole interaction between the solvents and the solute. It could be seen that MSPPP is slightly less polar than DAPPP. These results indicate that all these dyes display great variations in the dipole moment in the excited state.
3.4 Quantum yield of fluorescence
The fluorescence quantum yield (ΦF) of Rhodamine 6G in ethanol is 0.94 and it is used as a reference. The ΦF of MSPPP was calculated using the following equation [3].

where the indices S and R refer to the sample and reference, respectively, and the integral over I represent the area under the fluorescence spectrum. A is the optical density, and n is the refractive index of the solvents. The results of the ΦF of the solvated MSPPP are shown in Table 1.
|
Solvent |
Dielectric constant ε |
MSPPP λmax [nm] |
Stocks shift cm− 1 |
ɸF % |
|
|---|---|---|---|---|---|
|
Absorption |
Fluorescence |
||||
|
Benzene |
2.23 |
406 |
472.38 |
3490 |
13 |
|
Toluene |
2.60 |
404 |
477 |
3810 |
11 |
|
Chloroform |
4.79 |
418 |
507.5 |
4260 |
89 |
|
Acetic acid |
6.15 |
427 |
511.7 |
3870 |
20 |
|
(THF) |
7.55 |
403 |
502.8 |
4930 |
86 |
|
Acetone |
20.5 |
405 |
515 |
5350 |
66 |
|
Ethanol |
24.2 |
419 |
533 |
4990 |
44 |
|
Methanol |
32.5 |
420 |
532.5 |
5380 |
22 |
|
DMF |
36.7 |
415 |
527.5 |
5140 |
96 |
|
Acetonitrile |
37.5 |
410 |
528.5 |
5470 |
40 |
The fluorescence spectra of MSPPP in different organic solvents were recorded. The concentration was kept at 0.65mM. The fluorescence spectra were recorded at the excitation wavelength of 355 nm. The results showed that the quantum yield depends on the solvent and the chemical structure of the dye. The results obtained were compared with the quantum yield of DAPPP [3] and displayed in Table 2.
|
Solvent |
Dielectric constant\(\epsilon\) |
\({\text{ᶲ}}_{\text{F}}\)MSPPP |
\({\text{ᶲ}}_{\text{F}}\)DAPPP |
|---|---|---|---|
|
Benzene |
2.23 |
0.13 |
0.26 |
|
Toluene |
2.60 |
0.11 |
0.22 |
|
Chloroform |
4.79 |
0.89 |
0.66 |
|
Acetic acid |
6.15 |
0.20 |
0.05 |
|
Tetrahydrofuran (THF) |
7.55 |
0.86 |
0.98 |
|
Acetone |
20.5 |
0.66 |
0.85 |
|
Ethanol |
24.2 |
0.44 |
0.35 |
|
Methanol |
32.5 |
0.22 |
0.02 |
|
Dimethylformamide (DMF) |
36.7 |
0.96 |
0.93 |
|
Acetonitrile |
37.5 |
0.40 |
0.66 |
3.5 Amplified spontaneous emission (ASE)
To study the ASE properties of MSPPP under high power laser excitation; MSPPP was dissolved in acetone, the concentration fixed at 1 mM. This solution was transversely excited with a UV laser at 355 nm. At a pump power of 3 mJ, the ASE spectrum was noted. This was the minimum concentration and pump power excitation for MSPPP to produce an ASE spectrum at 520 nm with a full width at half maximum (FWHM) of 5 nm as shown in Fig. 9. The results obtained were compared with that DAPPP under the same operating conditions. Focusing our attention on MSPPP and DAPPP molecular Structures, these almost have the same chemical structure with different substitutions in the fourth position. Whereas we have a methyl group in the fourth position of MSPPP, this difference has shifted the ASE of MSPPP10 nm to the blue region regarding DAPPP.
Table 3 displayed the ASE spectra of MSPPP dissolved in different solvents under identical conditions; the concentration and pump power were kept at 6.5mM and 9 mJ for each solution. The ASE in acetic acid, methanol, benzene, and toluene was not detected even at high pump power energy and concentration. In toluene and benzene, this may be due to the lowest solubility of the MSPPP for these solvents. The absence of the ASE spectra in acetic acid may be due to the protonation of the N-dimethylamino group of MSPPP with responsibility for their photo properties. Here the methanol could play a similar role by deactivation of the lone pair of N-dimethylamino group by hydrogen bonding; this slightly appears in ethanol which gives poor ASE. Figure 11 showed that the DAPPP produced a high intense ASE at 530.7 nm.
|
Solvent |
Dielectric constant\(\epsilon\) |
\({?}_{\text{m}\text{a}\text{x}}\)MSPPP |
|---|---|---|
|
Benzene |
2.23 |
……. |
|
Toluene |
2.60 |
……. |
|
Chloroform |
4.79 |
513 |
|
Acetic acid |
6.15 |
………. |
|
Tetrahydrofuran (THF) |
7.55 |
511 |
|
Acetone |
20.5 |
522.5 |
|
Ethanol |
24.2 |
548 |
|
Methanol |
32.5 |
…… |
|
Dimethylformamide (DMF) |
36.7 |
541 |
|
Acetonitrile |
37.5 |
544 |
The results obtained were compared with the ASE of DAPPP under identical conditions [3] and displayed in Table 4. For DAPPP it was found that when the dielectric constant increases the emission wavelength is increasingly red shifted. In addition, The ASE in acetic acid, methanol, benzene, and toluene was not detected even at high pump power energy and concentration. In toluene and benzene, this may be due to the lowest solubility of the DAPPP for these solvents. Here we find that MSPPP and DAPPP may be agreed in the absence of the ASE spectra in acetic acid may be due to the protonation of the N-dimethylamino group of MSPPP with responsibility for their photo properties. Here the methanol could play a similar role by deactivation of the lone pair of N-dimethylamino group by hydrogen bonding; this slightly appears in ethanol which gives poor ASE.
|
Solvent |
Dielectric constant\(\epsilon\) |
\({?}_{\text{m}\text{a}\text{x}}\)MSPPP |
\({?}_{\text{m}\text{a}\text{x}}\)DAPPP |
|---|---|---|---|
|
Benzene |
2.23 |
……. |
……… |
|
Toluene |
2.60 |
……. |
……… |
|
Chloroform |
4.79 |
513 |
524 |
|
Acetic acid |
6.15 |
………. |
……. |
|
Tetrahydrofuran (THF) |
7.55 |
511 |
516 |
|
Acetone |
20.5 |
522.5 |
532 |
|
Ethanol |
24.2 |
548 |
542 |
|
Methanol |
32.5 |
…… |
……. |
|
Dimethylformamide (DMF) |
36.7 |
541 |
548 |
|
Acetonitrile |
37.5 |
544 |
547 |
The ASE intensities variation of MSPPP dissolved as a function of the concentration is shown in Fig. 10. The concentrations were taken from 2 to 6mM. The solvents were DMF, acetone, and THF and the pump power was 9 mJ. It was found that, as the concentration increased, the intensity of the ASE increases for each solution. It was seen that the ASE did not reach saturation even at high concentrations.
Spectral and and ASE properties of a chalcone was studied. The effects of FGs and organic solvents on these compounds have been observed in absorption, emission, and ASE spectra. Contrary to expectations, the addition of donor groups determines a blue shift of fluorescence and ASE spectra, while the electrons withdrawing groups led to a shift of the spectra to longer wavelengths. The optical characteristics of MSPPP in different organic solvents were investigated. The absorption, fluorescence spectra, Stokes shift, fluorescence quantum yield, energy band-gap, and ASE were determined. The absorption spectra of MSPPP were compared with that for DAPPP. The absorption spectra of MSPPP showed a wavelength band in the range 403–427 nm, whereas the fluorescence spectra exhibited a band at 472–533 nm. ASE was observed under pump pulse laser excitation, and the wavelengths were attuned from 511 to 548 nm.
The current results demonstrate that these amino chalcones can be used as new efficient laser materials in the future.
AUTHORS CONTRIBUTION
Mohana Attia: Methodology, Software, Data curation, Writing- Original draft preparation, Software, Validation, Writing- Reviewing and Editing. Abdelrahman A. Elbadawi: Visualization, Investigation. K. H. Ibnaouf: Conceptualization, Supervision.
- Elzupir, et al., “Ultrasound irradiation promoted synthesis of chalcones, analogues, homologues and related furanyl containing compounds and their antibacterial activity”. Int. J. Curr. Pharmaceut. Res. 5(4): p. 23e25R. https://10.13040/IJPSR.0975-8232.10(7).3290-94
- Tainaka, K. Tanaka, S. Ikeda, K. Nishiza, T. Unzai, Y. Fujiwara, I. Saito and A. Okamoto, “PRODAN-Conjugated DNA: Synthesis and Photochemical Properties”, J. Am. Chem. Soc., 2007, 129, 4776. . https://10.1021/ja069156a
- F. Attia, “Synthesis, Properties of a New (Polymer and Chalcone)”, AJOPACS, vol. 7, no. 2, pp. 1-9, Sep. 2019. https://doi.org/10.9734/ajopacs/2019/v7i230092
- Szydłowska, et al., “Photoinduced intramolecular electron transfer in 4-dimethylaminopyridine”s, Phys. Chem. Chem. Phys. 5 (6) (2003). https://doi.org/10.1039/B209731A
- K. Kumar, et al., “Design, synthesis, and evaluation of novel boronic-chalcone derivatives as antitumor agents”, J. Med. Chem. 46 (14) (2003) 2813e2815. https://10.1021/jm030213+
- J. Sun, G. Schwarz, R. H. Kricheldorf and T. C. Chang, “New polymers of carbonic acid. XXV. Photoreactive cholesteric polycarbonates derived from 2,5‐bis(4′‐hydroxybenzylidene) cyclopentanone and isosorbide”, J. Polym. Sci., Part A: Polym. Chem., 1999, 37, 1125. https://doi.org/10.1002/(SICI)1099-0518(19990415)37:8<1125::AID-POLA9>3.0.CO;2-J
- Shkir, et al., “An experimental and theoretical study on a novel donor-pacceptor bridge type 2, 4, 5 trimethoxy-4՜-chlorochalcone for optoelectronic applications: a dual approach, Spectrochim”. Acta Mol. Biomol. Spectrosc. 173 (2017) 445e456. 10.1016/j.saa.2016.09.022
- Bowden, A. D. Pozzo and C. K. Duah, “Reactions in strongly basic media. Part 10. Base-catalysed isomerisation of Z- to E-substituted chalcones”, J. Chem. Res., 1990, 377. https://doi.org/10.1039/P29910000109
- Attia, M. F., Elbadawi, A. A., Ibnaouf, K. H., & Elzupir, A. O. (2021). Influence of Functional Groups on the Photophysical Properties of 1-(4-Methylsulfonyl Phenyl)-3-(4-n, n Dimethyl (amino Phenyl)-2-Propen-1-One Chalcone as Laser Dye. Asian Journal of Physical and Chemical Sciences, 9(1), 22-29. https://doi.org/10.9734/ajopacs/2021/v9i130128V.
- Abeles, “Optical properties of solids”, Amsterdam, North-Holland Pub. Co.; New York, American Elsevier, 1972. https://nla.gov.au/nla.cat-vn1100387
- Mataga, N., Nishimoto, K.: Electronic structure and spectra of nitrogen heterocycles. Z. Phys. Chem. 13, 140–157 (1957). https://doi.org/10.1246/bcsj.29.465
- Temam, R.: Navier-Stokes Equations: Theory and Numerical Analysis, vol. 343. American Mathematical Soc, Providence (2001)
- Ibnaouf, K., Amplified spontaneous emission spectra of poly (9, 9-dioctylfluorenyl-2, 7-diyl) under pulsed laser excitation. Synthetic Metals, 2015. 209: p. 534-543. 1016/j.saa.2012.07.131
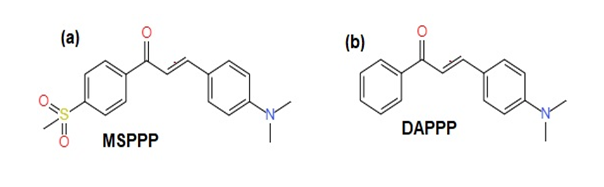
- scheme1.png
Scheme 1 Chemical structure of a MSPPP and DAPPP