CaMPARI GFAP as a new functional tool to monitor astrocyte activity.
To study functional neuron-astrocyte circuitries in the NAc, we used a fluorescent technique based on CaMPARI26,27, a genetically encoded Ca2+ indicator (GECI) that undergoes irreversible green-to-red fluorescence conversion upon coincident elevated intracellular Ca2+ and ultraviolet (UV, λ = 405 nm) light illumination28. The GECI properties of the molecule allow real-time monitoring of astrocytic Ca2+ dynamics, while its irreversible photoconversion properties enable large-scale spatial analysis of astrocytic activation with precise temporal resolution. We selectively expressed CaMPARI in NAc astrocytes by injecting the adeno-associated virus AAV2/9-GFAP-CaMPARI (CaMPARIGFAP), which contains the specific astroglial promoter glial fibrillary acidic protein (GFAP) in the NAc (Figs. 1A and 1B). Specific expression of CaMPARIGFAP in NAc astrocytes was confirmed for both green and red fluorescence signals by its colocalization with astrocytic marker S100β, but negligibly with the neuronal marker NeuN. 95.7 ± 0.7% of CaMPARIGFAP Green cells and 94.1 ± 1.7% of CaMPARIGFAP Red cells were S100β-positive (p < 0.001; n = 2861 cells, 8 fields, 2 mice) (Fig. 1C and D). Afterward, we studied both the ability to track real-time Ca2+ astrocytic activity and photoconversion properties28. Using local application of ATP (20 mM) through a micropipette, which reliably elevates intracellular Ca2+ levels in NAc astrocytes29, we showed a transient decrease in CaMPARIGFAP fluorescence in astrocytes (Fig. 1E1−3), demonstrating the ability of the molecule to monitor Ca2+ dynamics. In parallel, application of UV light during a fixed temporal window led to green-to-red photoconversion in those astrocytes that were active at the moment of illumination due to the ATP stimulation (Fig. 1F1). CaMPARIGFAP Red was measured post-hoc after PFA fixation. The CaMPARIGFAP Red/Green fluorescence ratio (FRed/FGreen) changed according to the distance from ATP application (Fig. 1F2) showing that red fluorescence intensity correlated with Ca2+ activity confirming that this parameter can be used to quantify the astrocytic activation28.
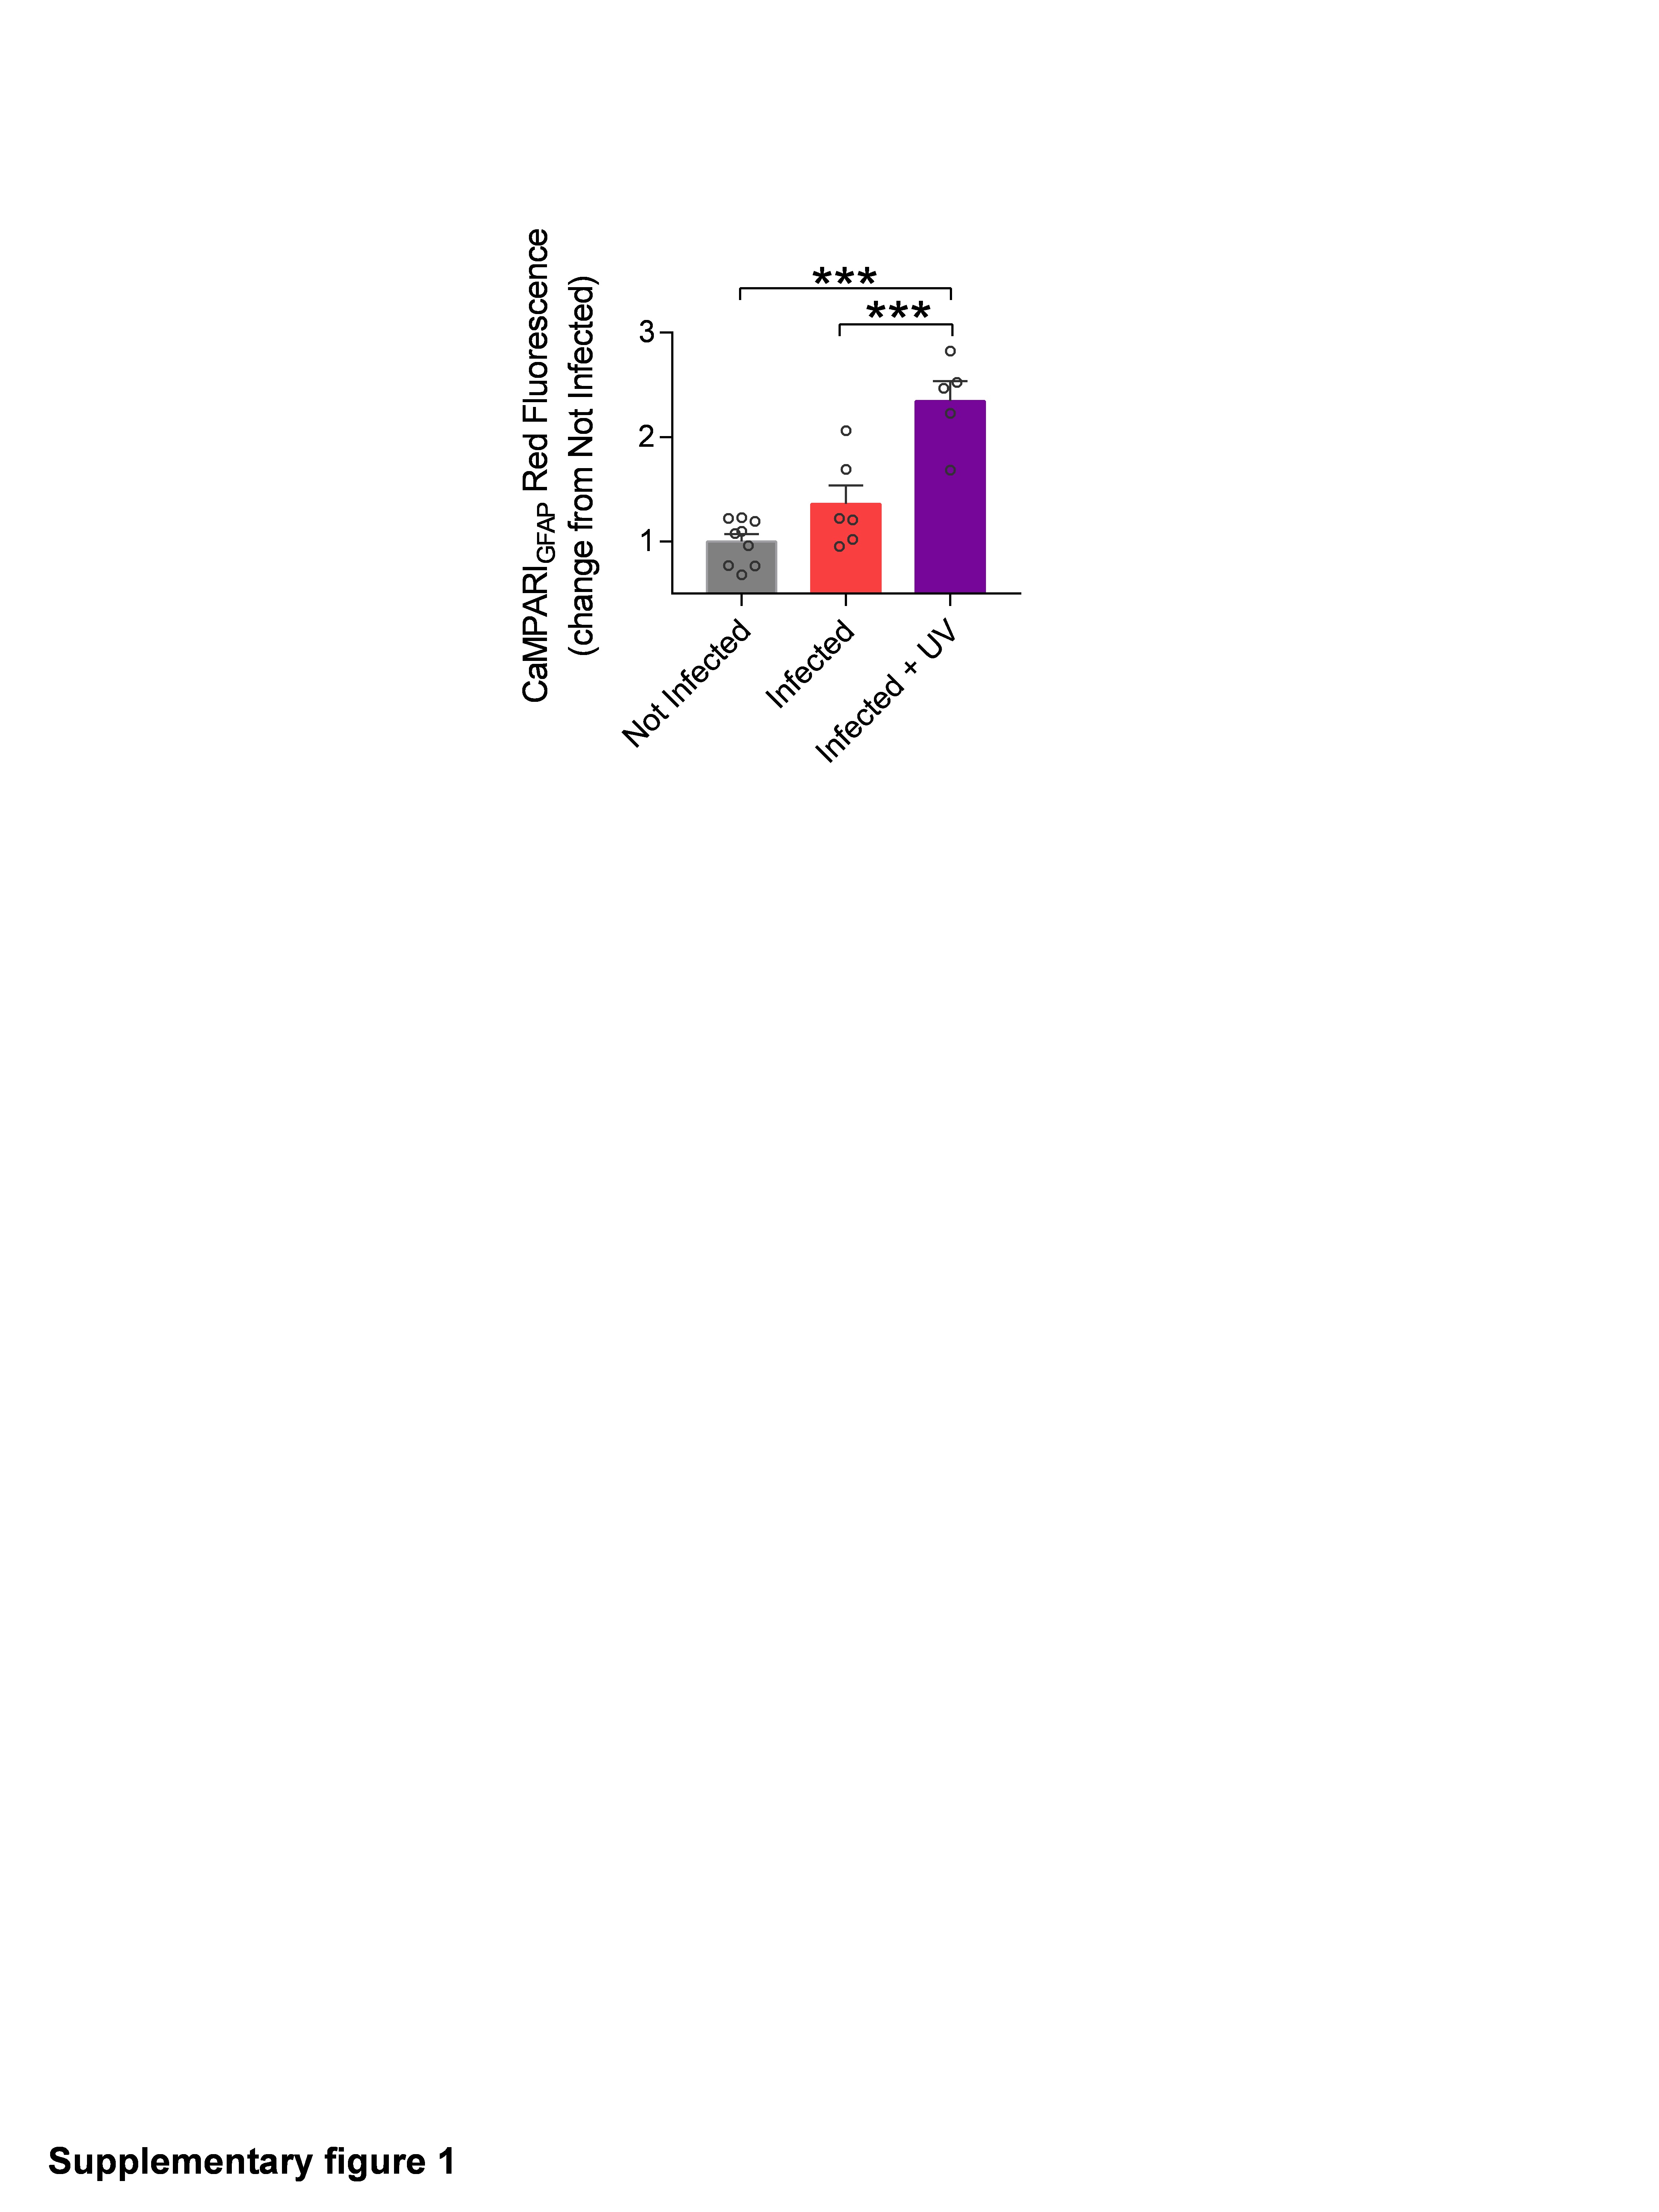
Although it is being reported that CaMPARI fluorescence signal is reduced upon chemical fixation28,30, photoconversion turnover was robust in astrocytes, and this decrease did not compromise CaMPARIGFAP post-hoc signal detection (Fig. 1F). Furthermore, no significant photoconversion was detected when tissue was not exposed to UV light, confirming that background CaMPARIGFAP spontaneous turnover is residual and does not affect the reported measurements (Fig. S1). Overall, these observations indicate that astrocytic Ca2+ activity can be studied using both CaMPARIGFAP approaches, real-time monitoring of calcium dynamics and large-scale activation profiles given by fluorescence turnover analysis.
Optostimulation of mPFC axons induces specific activation of a subpopulation of astrocytes in the NAc.
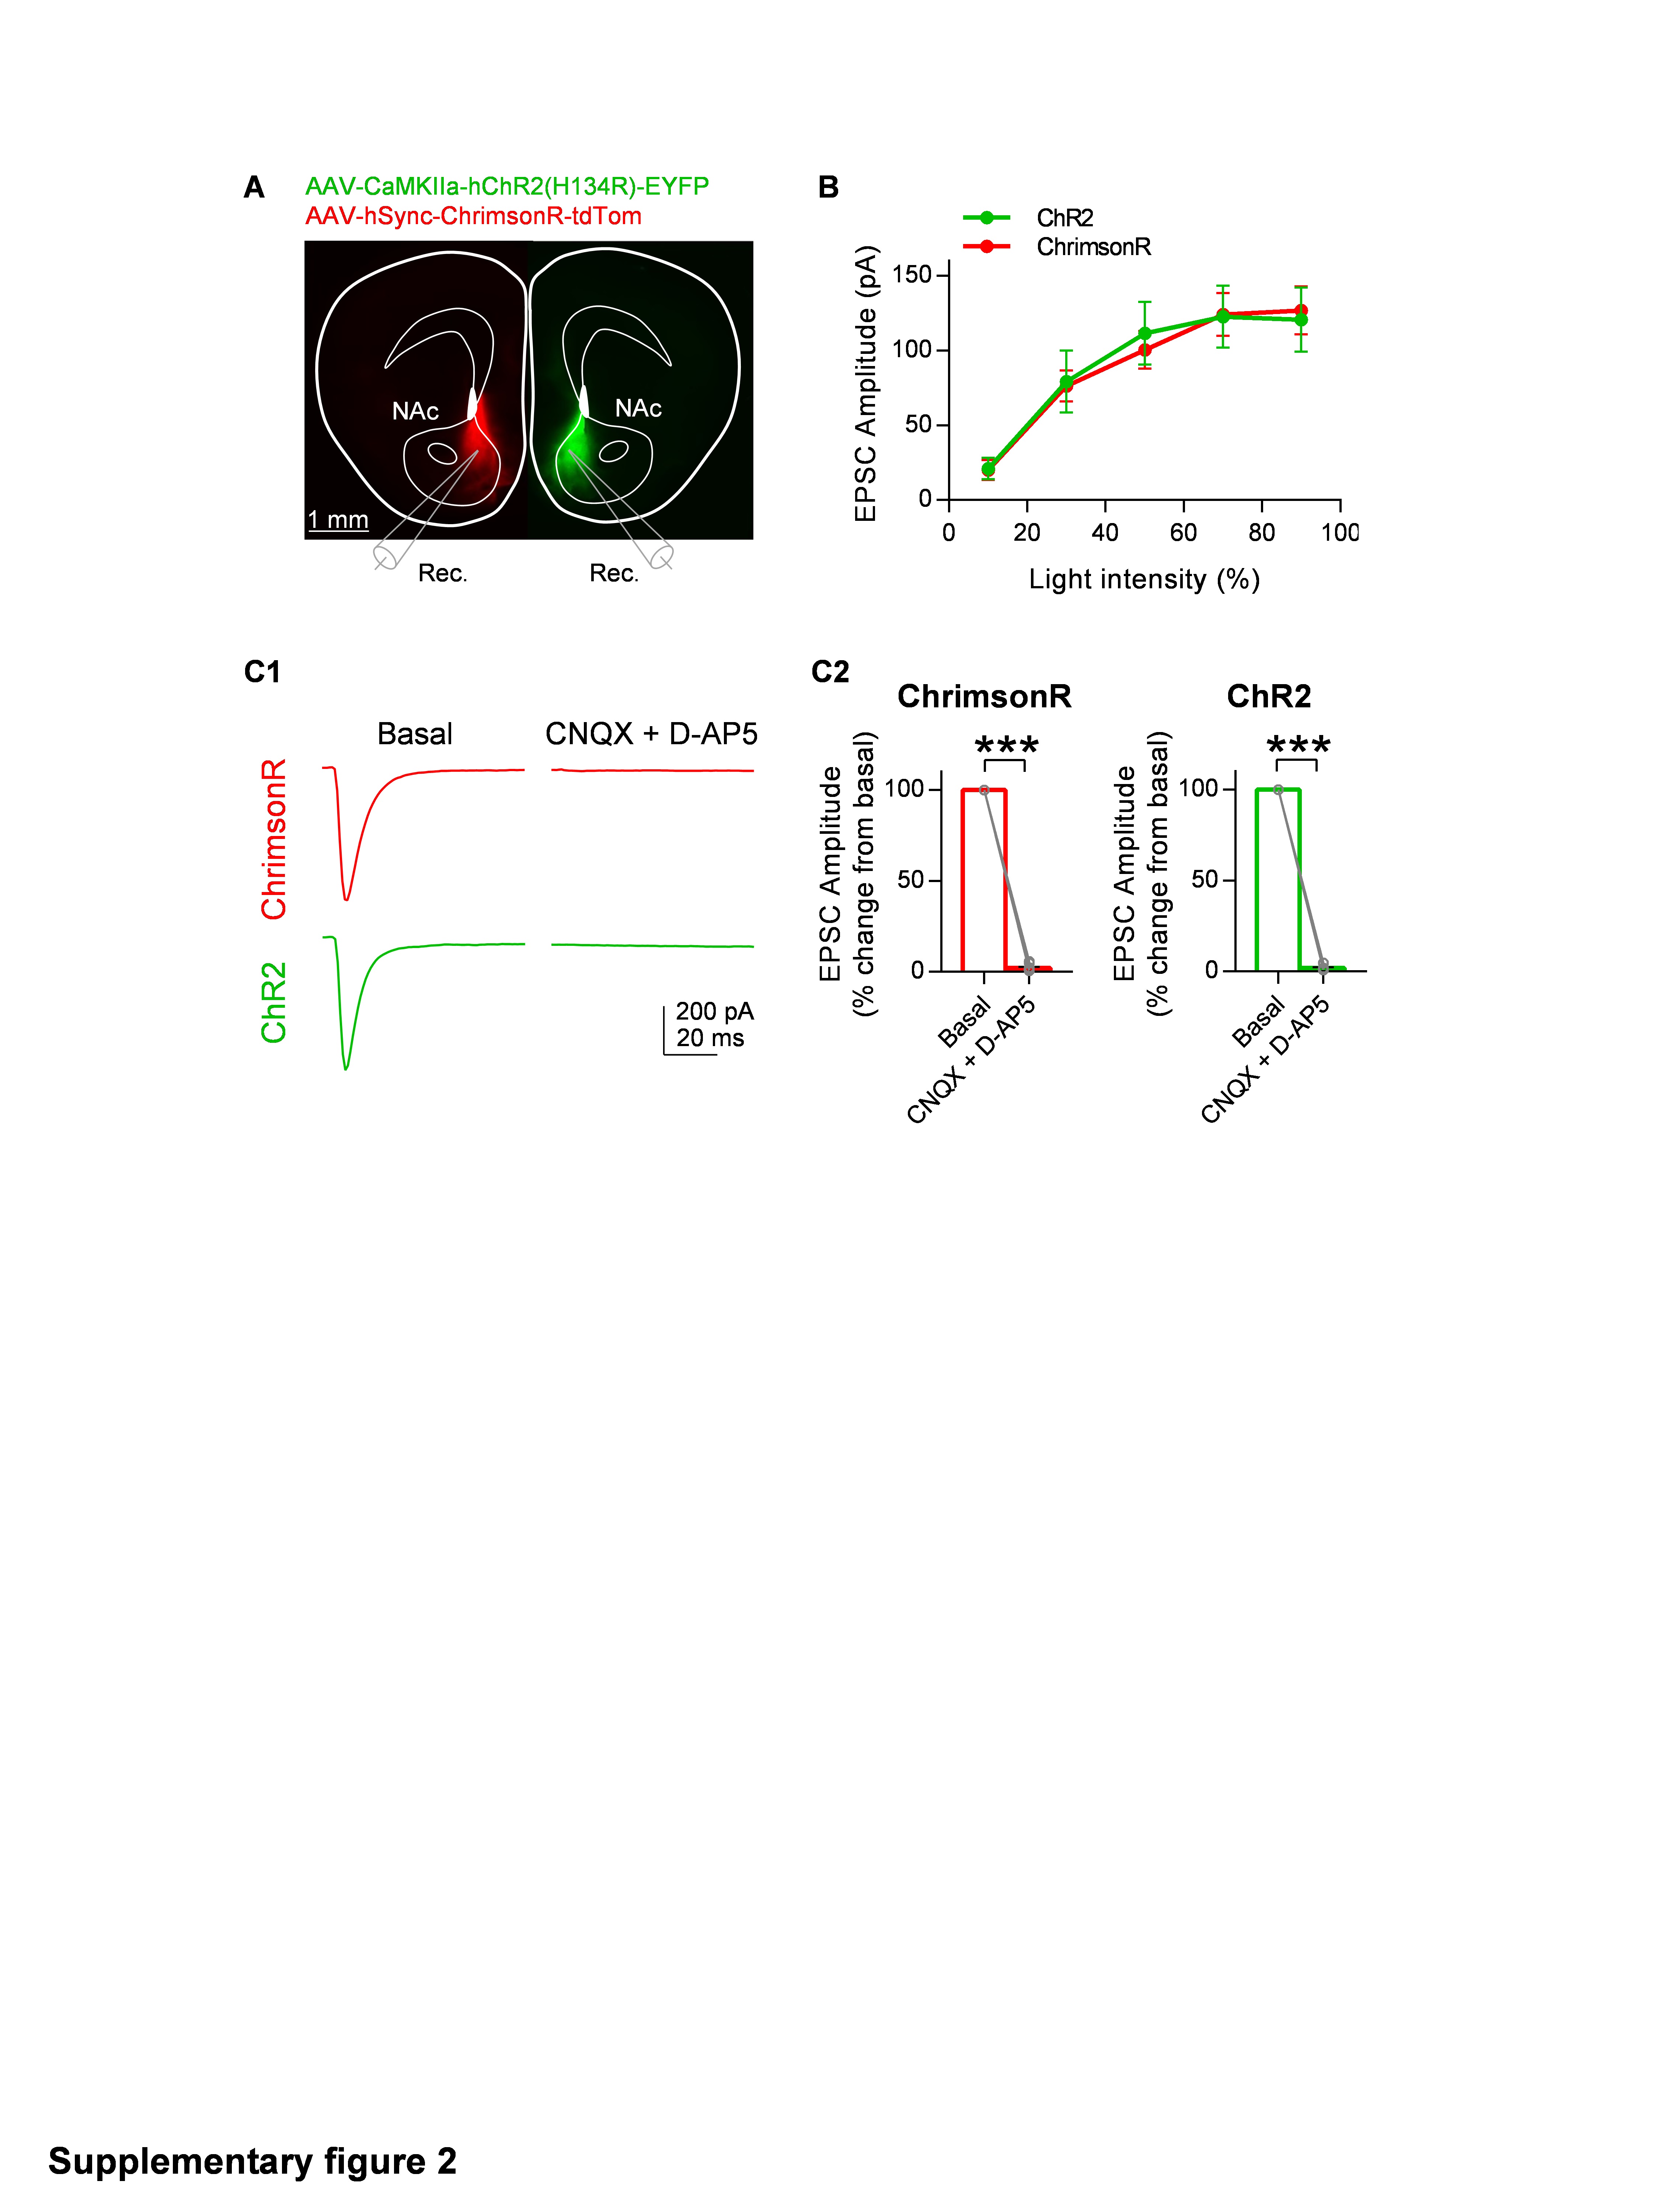
To study neuron-astrocytic circuitry heterogeneity in the NAc, we first analyzed the neural element of the circuit, characterizing the anatomical and functional patterns of the mPFC glutamatergic afferents to the NAc (Fig. 2A and B). To this end, we injected AAVs expressing the opsins channelrhodopsin (ChR2) or ChrimsonR with mCherry or tdTom fluorescent reporters (AAV-CaMKIIa-hChR2(H134R)-mCherry; AAV-hSync-ChrimsonR-tdTom) in the mPFC. Four weeks after injection, we analyzed the projecting fluorescence signals from mPFC axons specifically in the NAc. Medium spiny neurons (MSNs) from both the AcbC and AcbSh subregions were analyzed to characterize both density and synaptic strength of mPFC afferent inputs. In agreement with previous studies26,31, we found non-uniform distribution of mPFC afferents in the NAc, with higher innervation density in the AcbC (0.25 ± 0.04 ΔF/F0) than the AcbSh (0.14 ± 0.03 ΔF/F0) (p = 0.02; n = 11 mice; Fig. 2A2). Optogenetic stimulation of the mPFC with either ChR2 or ChrimsonR (Fig. S2) evoked glutamatergic excitatory postsynaptic currents (EPSCs; as indicated by their sensitivity to 20 µM CNXQ and 50 µM AP5; Fig. S2C). The amplitude of EPSCs recorded in AcbC (208.6 ± 37.4 pA; n = 8 cells, 4 mice) and AcbSh neurons (33.1 ±12.3; n=15, 4 mice: p = 0.002; Fig. 2B3) correlated positively with the afferent innervation density (Pearson r = 0.73, p < 0.001; Fig. 2B2). To avoid differences derived from stimulation intensity, light stimulation parameters remained constant for all the recordings (70% intensity, 1 ms, Fig. S2B see Materials and Methods). These results suggest that mPFC neurons preferentially innervate the AcbC subregion and that the opto-evoked EPSC amplitude in NAc MSNs was dependent on the density of innervating glutamatergic fibers.
We next investigated the astrocytic Ca2+ dynamics associated with the mPFC glutamatergic pathway (Fig. 2C), focusing on the post-synaptic element in the neuron-astrocyte circuitry under study. To this end, we monitored in both NAc subregions the Ca2+ events using CaMPARIGFAP Ca2+-dependent green fluorescence, before and after optogenetic stimulation (10 pulses at 4 Hz, 200 ms interval - 4 times, 5 s interval). This protocol increased the astrocyte Ca2+ spike frequency in both the AcbC (1.62 ± 0.23 change from basal, p = 0.02) and AcbSh (2.62 ± 0.52 change from basal, p = 0.003) (n = 25 slices, 8 mice; Fig. 2C3, left) without variations in the Ca2+ amplitude of the responses (Fig. S3A). Surprisingly, these Ca2+ dynamics in response to optostimulation did not show the same spatial pattern of activity across NAc regions as observed by the glutamatergic inputs’ innervation, indicating that astrocytes were not responding exclusively in areas within the direct reach of the glutamatergic afferents. Although the AcbC showed a higher density of mPFC projections, higher astrocytic activity was detected in the AcbSh (Fig. 2A2 and 2C3). This increase in Ca2+ response was mediated by group I metabotropic glutamate receptor, as it was blocked by the selective mGluR5 antagonist MPEP (50 µM) (0.83 ± 0.10 change from basal, p = 1.67) (n = 8 slices, 2 mice; Fig. 2C3). Overall, these results showed that mPFC inputs induce astrocytic activity in a pattern across subregions opposite from the innervation profile.
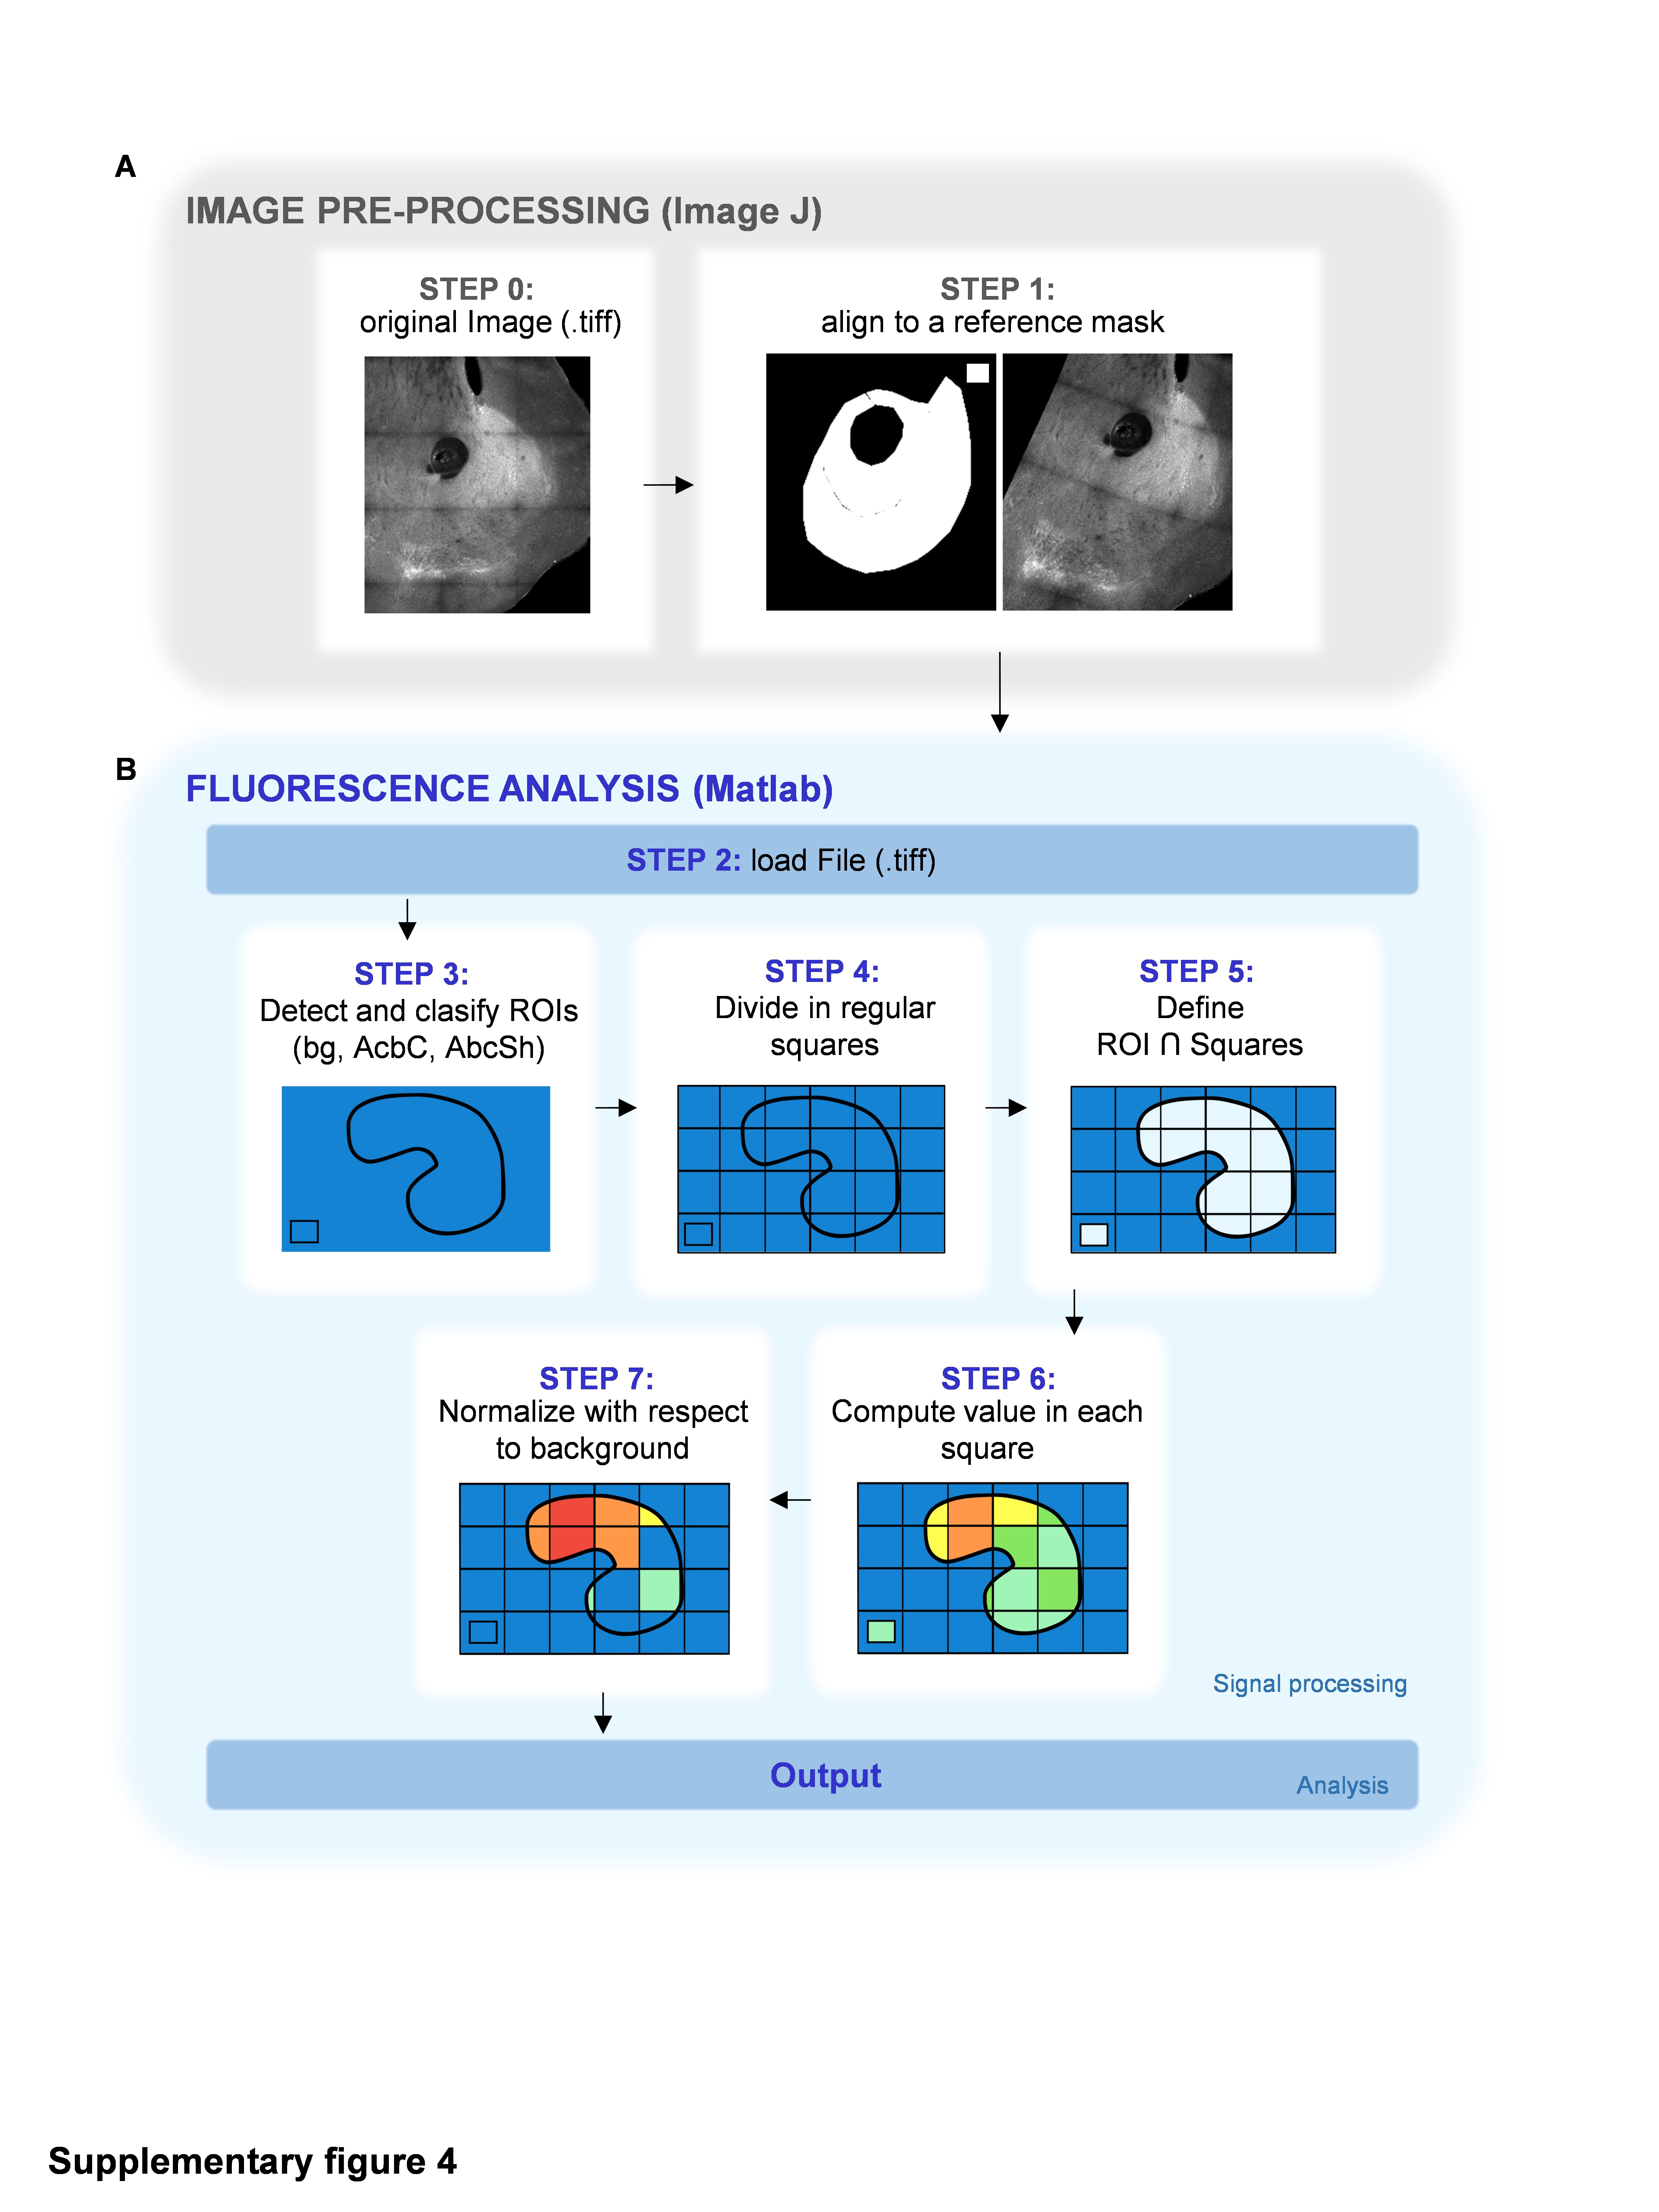
To investigate this, we performed a spatial analysis of the astrocytic response in the whole NAc, taking advantage of the photoconversion of CaMPARIGFAP in a Ca2+-dependent manner (Fig. 2D-2E). To avoid crosstalk between photoconverted CaMPARIGFAP Red signals and mCherry from ChR2-expression axons, these experiments were performed using a different reporter (EYFP) fused to ChR2 (AAV-CaMKIIa-hChR2(H134R)-EYFP). We developed an analysis method based on the alignment of every NAc slice to a reference mask followed by the regular division of the area in 50 µm squares (Fig. S4, see Materials and Methods). By this method, called “partition in regular quadrants” (PRQ), we first obtained the spatial profiles of mPFC afferents to the NAc (Fig. 2D). In agreement with our previous characterization (Fig. 2A2), PRQ analysis detected higher density of projections in the AcbC (1.88 ± 0.03 normalized ΔF/F0) compared to the AcbSh (0.98 ± 0.06 normalized ΔF/F0) (p < 0.001; n = 9 slices, 6 mice; Fig. 2D4), supporting PRQ as a useful method to analyze fluorescence signals in broad areas. Secondly, we spatially analyzed NAc astrocytic responses to mPFC afferent optostimulation (Fig. 2E). To trigger the red fluorescence turnover of CaMPARIGFAP, 40 s of UV was delivered after optogenetic stimulation. Optostimulation of mPFC afferents led to a significant astrocytic photoconversion in both NAc subregions, AcbC (1.64 ± 0.16 ΔF/F0 change from basal, p = 0.0035) and AcbSh (1.92 ± 0.19 ΔF/F0 change from basal, p = 0.0014) (n = 18 slices, 6 mice; Fig. 2E4), showing the same activation profiles as those registered by Ca2+ real-time imaging analysis (Fig. 2C3). In line with the recorded Ca2+ signals, this photoconversion was mediated by mGluR5 receptors, since both regions reduced their activity to basal levels in the presence of MPEP (0.97 ± 0.14 ΔF/F0 change from basal, p = 0.8354) (n = 8 slices, 2 mice; Fig. 2E4).
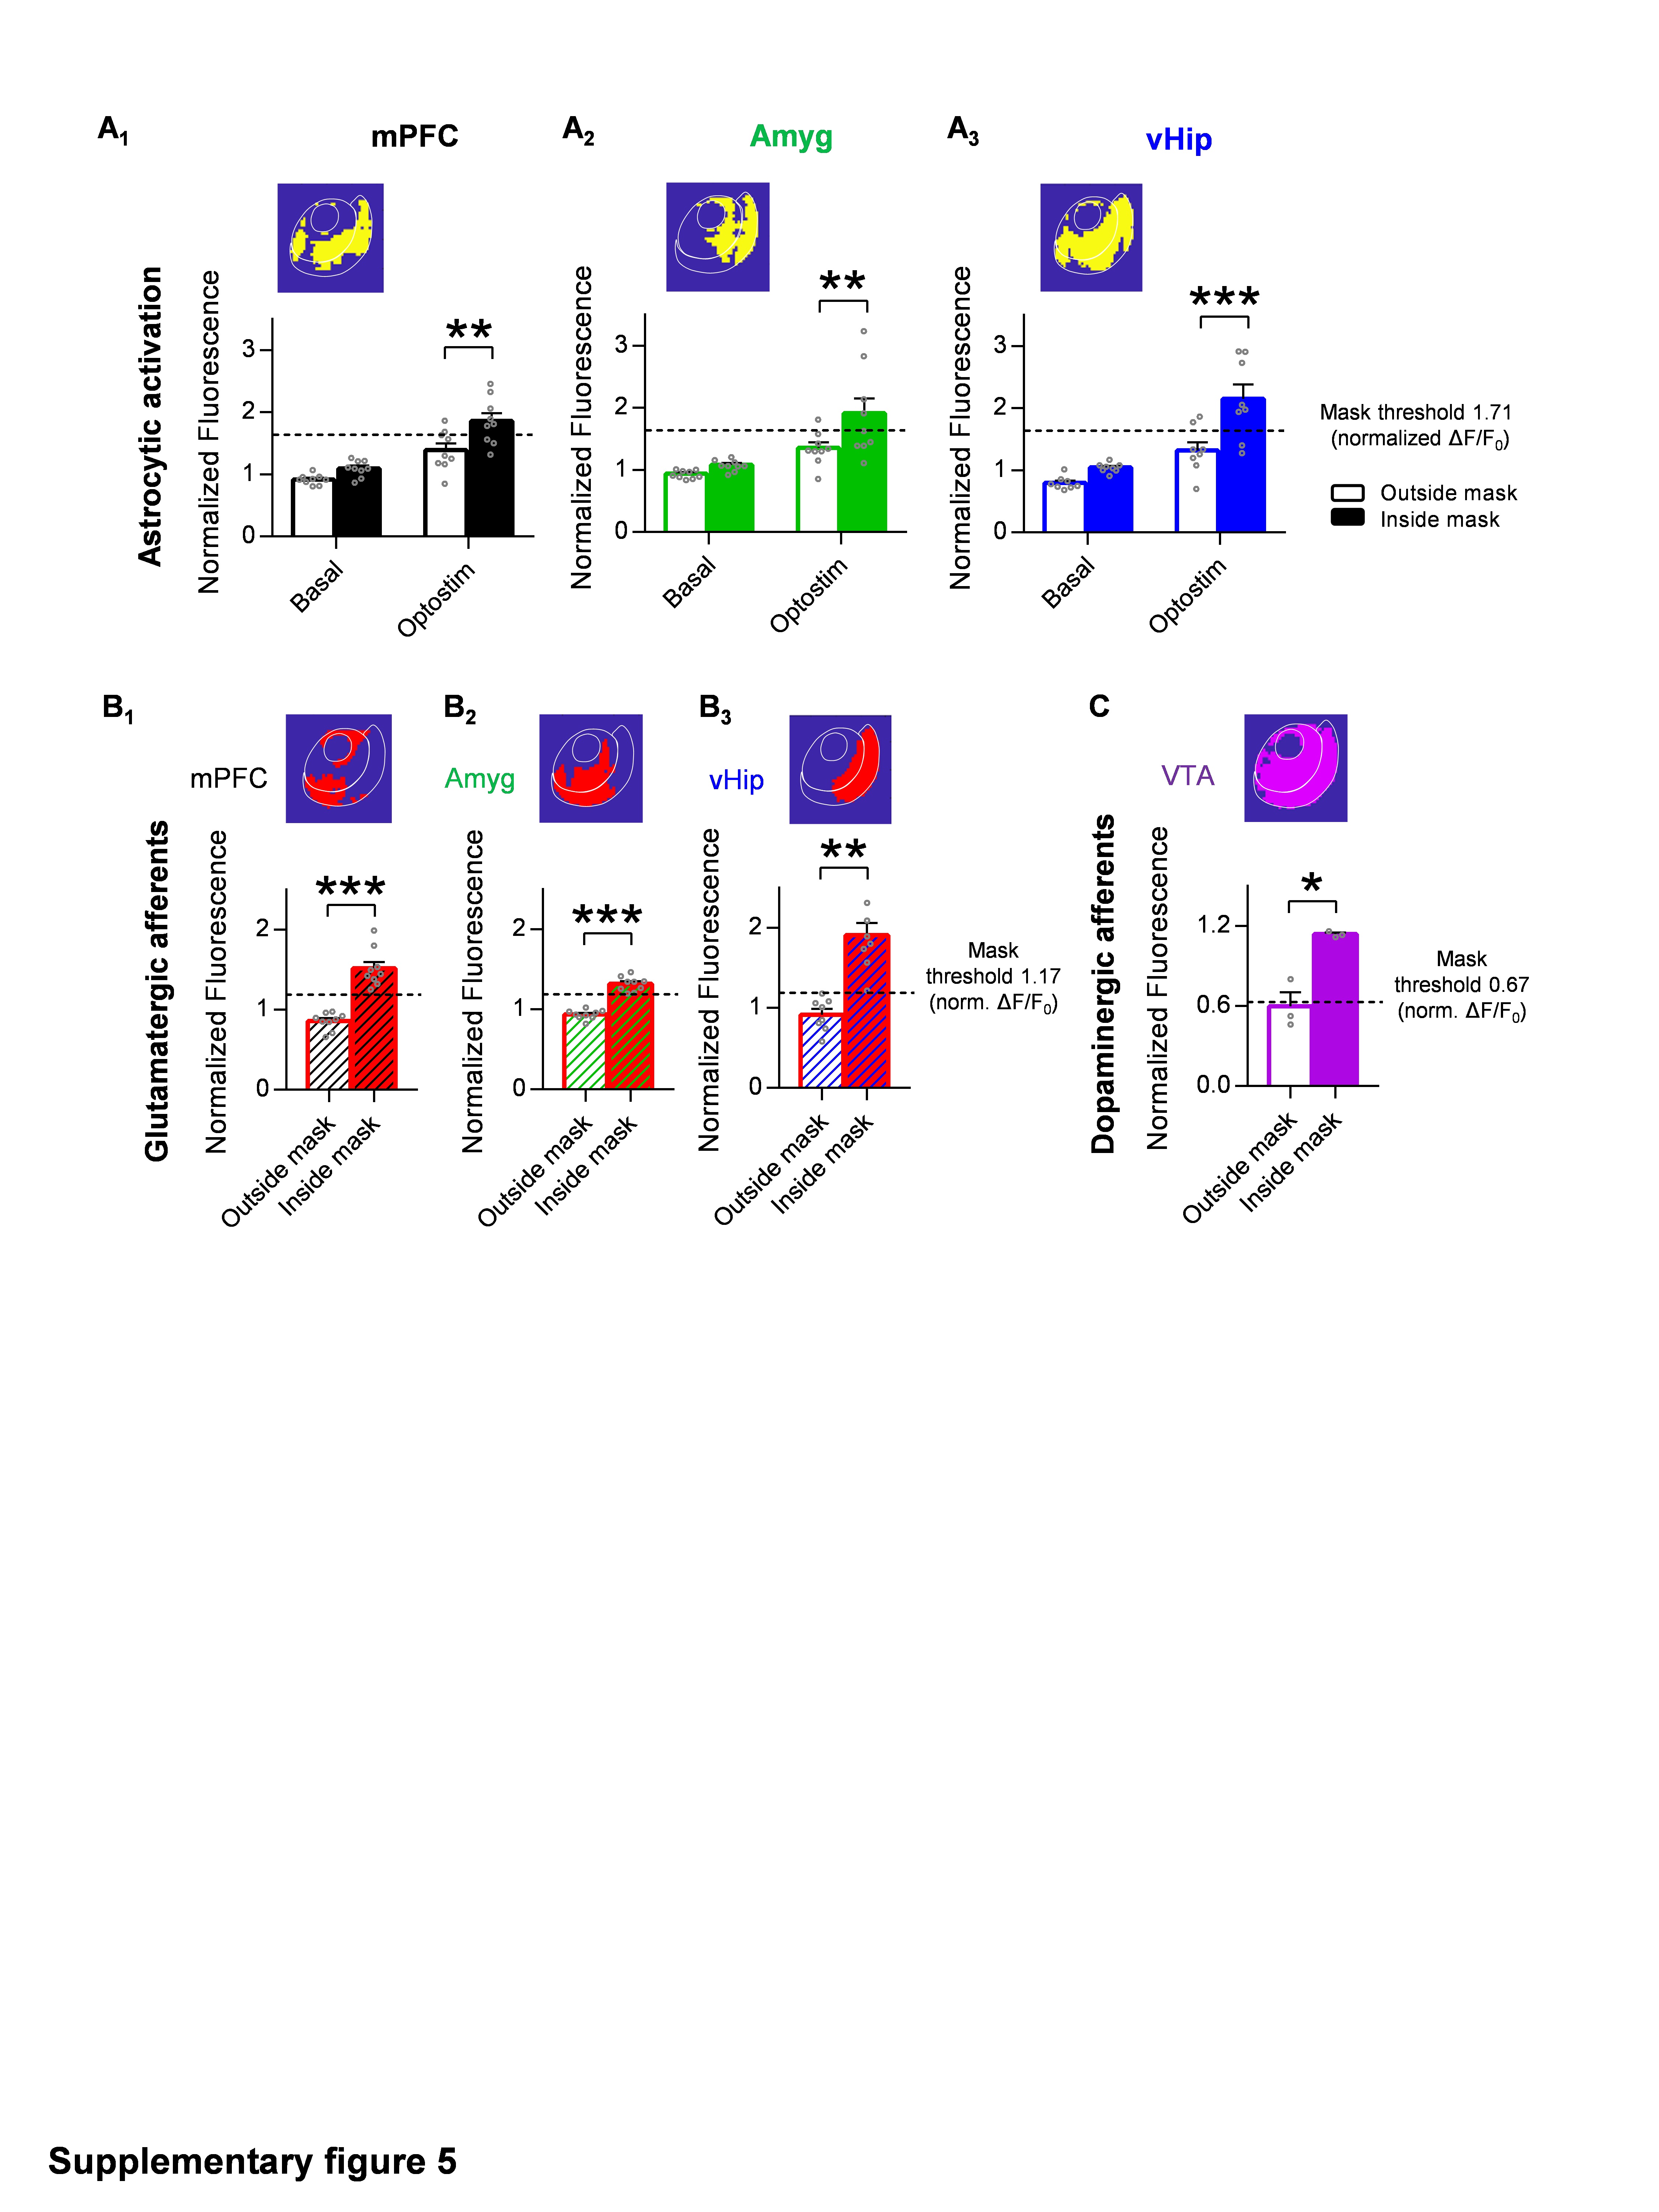
To further ascertain the spatial overlap between the afferents and the activated astrocytic area, we analyzed these two PRQ spatial profiles (mPFC innervation pattern (Fig. 2D) and NAc astrocytic activity pattern (Fig. 2E)), defining the active areas by k-mean clustering (Fig. S5, see Materials and Methods). Using this approach, we identified the activation threshold for each fluorescence signal, generating one mask containing the area with increased glutamatergic innervation and another containing the NAc area showing robust astrocytic activation. As shown in Fig. 2F, the overlapping region between these two masks (16.2 ± 2.94% area of NAc) was significantly smaller when compared to the afferents area (30.8 ± 0.75% area of NAc, p = 0.04) or to the activated astrocytic regions (40.9 ± 6.66% area of NAc, p = 0.001) (Fig. 2F2), indicating a low rate of spatial overlap between both signals. Furthermore, we studied the overlapping degree and spatial distributions within the AcbC and AcbSh using a bivariate similarity index32,33, and found that astrocytes in both subregions were interacting in the same way with the afferents, showing in both cases low overlapping rate (MANOVA, d = 0, p = 0.586; Fig. 2G).
Taken together, these results demonstrate that astrocytes from both NAc subregions do not respond in areas under the direct reach of the glutamatergic afferents, showing pathway-specific astrocyte activity triggered by mPFC inputs.
Optostimulation of the Amyg reveals pathway-specific activity patterns in NAc astrocytes.
The NAc receives a broadly distributed glutamatergic projection originating in the Amyg that promotes reward-seeking behaviors34. To characterize the NAc astrocyte responses to Amyg inputs, the same approach was used as above. In agreement with previous studies26,31, histological characterization of glutamatergic afferent patterns confirmed that both the AcbC and AcbSh were similarly innervated by Amyg (AcbC 0.37 ± 0.06 ΔF/F0, AcbSh 0.33 ± 0.06 ΔF/F0) (p = 0.63, n = 13 mice; Fig. 3A2). PRQ analysis of the spatial distribution of the afferents evidenced that although innervation was similar between subregions, the AcbC (1.34 ± 0.08 ΔF/F0 of change) was more innervated than the AcbSh (1.14 ± 0.05 ΔF/F0 of change) (p = 0.04, n = 9 slices, 6 mice; Fig. 3D4). When studying neuronal responses to the optostimulation of those axons, we registered a positive correlation (Pearson r = 0.57, p = 0.03) between the amplitude of the EPSCs and the density of afferent projections in the recording area (Fig. 3B2). Accordingly, the EPSC amplitudes in each subregion were similar (AcbC neurons 99.6 ± 35.2 pA, n = 11 cells, 3 mice; AcbSh neurons 79.4 ± 15.4 pA, n = 25 cells, 4 mice; p = 0.54, Fig. 3B3).
The study of astrocytic responses to optostimulation of those afferents showed that astrocytes from the AcbSh (2.04 ± 0.38 change from basal, p = 0.015) displayed higher activity compared to those from the AcbC (1.45 ± 0.21 change from basal, p = 0.049) (n = 25 slices, 7 mice; Fig. 3C3 and S3B). These responses were mediated by mGluR5, as it was blocked by bath-application of MPEP (50 µM; 1.56 ± 0.39 change from basal, p = 0.18; n = 5 slices, 2 mice; Fig. 3C3). Furthermore, spatial PRQ analysis showed the same profile, with stronger astrocytic activation in the AcbSh (1.78 ± 0.21 ΔF/F0 change from basal, p = 0.005) compared to the AcbC (1.49 ± 0.18 ΔF/F0 change from basal, p = 0.026) (n= 18 slices, 6 mice; Fig. 3E4). In line with Ca2+ imaging data, bath application of the mGluR5 antagonist reduced those responses to basal levels (0.93 ± 0.10 ΔF/F0 change from basal, p = 0.5) (n= 8 slices, 2 mice; Fig. 3E4). Like for the mPFC, these results showed that Amyg optostimulation gave rise to different NAc astrocyte activation profiles than the Amyg glutamatergic innervation pattern.
Afterward, we compared the area of overlap, calculating masks containing the spatial innervation pattern of Amyg afferents and the activation pattern of NAc astrocytes 35. We found that the areas with increased astrocytic activity in response to Amyg optostimulation (34.5 ± 5.34% area from NAc, p = 0.003) did not spatially match the areas containing more density of glutamatergic projections (36.8 ± 1.32% area from NAc, p < 0.001), as shown by the low rate of overlap between them (17.5 ± 2.05% area from NAc) (n= 9 slices, 6 mice; Fig. 3F2). Interestingly, astrocytes displayed bigger responses in dorsal regions of the NAc, while axons preferentially innervated ventral areas of the nucleus (Fig. 3F1). We did not observe significant differences in this interaction between AcbC and AcbSh astrocytic responses (MANOVA, d = 0, p = 0.482; Fig. 3G). Altogether, these results characterize the neural-astrocyte circuit of the Amyg-NAc pathway, showing different astrocytic activity patterns than the innervation ones, with astrocytes in the dorsal areas of the NAc with a preferentially low degree of innervation showing higher activity.
Astrocytes from the NAc show pathway-specific activation motifs in response to vHip glutamatergic afferents.
After characterizing astrocytic activity in response to the Amyg and mPFC, we selectively activated another principal glutamatergic input implicated in anxiety-like behavior and social interaction: the vHip. Using the same optogenetic approach, the histological evidence showed stronger innervation coming from the vHip to the AcbSh (0.80 ± 0.15 ΔF/F0) with respect to the AcbC (0.31 ± 0.06 ΔF/F0) (p = 0.01; n = 6 mice; Fig. 4A2). Functional characterization of these afferents showed a positive correlation (Pearson r = 0.56, p = 0.005; Fig. 4B2), as observed on the other two glutamatergic projection nuclei (mPFC and Amyg). Neurons in the NAc displayed bigger EPSC events in areas with higher density of vHip axons, and the synaptic neuronal strength was substantially stronger in the AcbSh (303.4 ± 62.5 pA; n = 21 cells, 6 mice) than in the AcbC (24.1 ± 14 pA; n = 4 cells, 3 mice; p < 0.001; Fig. 4B3). These results confirm that the EPSC amplitude was dependent on the density of glutamatergic fibers innervating each MSN, being a common characteristic of the three glutamatergic pathways.
Next we studied the astrocytic responses to those afferents. Real-time imaging from astrocytes in the AcbC showed increased frequency (2.6 ± 0.63% of change from basal, p = 0.018) of Ca2+ spikes in response to optostimulation with respect to astrocytes from the AcbSh (1.51 ± 0.21 change from basal, p = 0.031) (n = 13 slices, 5 mice) (Fig. 4C3 and S3C). As discovered for the other pathways, NAc astrocytes did not respond to vHip optostimulation with the same activation profile as the one displayed by the afferents. The astrocytic activity pattern was stronger in the AcbC, in opposition to the innervation profile in which the AcbSh gathered the majority of incoming afferents (Figs. 4A2 and 4C3). As we found for other glutamatergic inputs, astrocytic responses triggered by vHip axons were mediated by mGluR5 receptors (MPEP, 50 µM; 0.66 ± 0.51 change from basal, p = 0.055; n = 6 slices, 2 mice; Fig. 4C3). These results demonstrated that although NAc astrocytes respond differently depending on the pathway, the glutamate-dependent activity in the nucleus is, in all cases, mediated mainly by mGluR5 receptors.
Analysis of the spatial profile of astrocytic activation using PRQ confirmed the strong astrocytic responses in the AcbC (2.46 ± 0.32 ΔF/F0 change from basal, p = 0.003) and AcbSh (2.05 ± 0.20 ΔF/F0 change from basal, p = 0.0012; n= 16 slices; 6 mice), which were blocked in presence of mGluR5 antagonist (MPEP, 50 µM; 1 ± 0.23 ΔF/F0 change from basal, p = 0.99; n = 8 slices, 2 mice; Fig. 4E). Overall, the spatial location of astrocytes activated by the vHip glutamatergic afferents differed from the ones triggered by the other glutamatergic pathways (mPFC and Amyg), suggesting that astrocytes in the NAc respond differently to the diverse glutamatergic nuclei showing synapse-specific activity.
Interestingly, in contrast to the results found after stimulation of the mPFC and Amyg, PRQ analysis of spatial overlap (23.6 ± 2.50% area of NAc) between glutamatergic afferents from vHip (34.6 ± 1.51% area of NAc, p = 0.12) and astrocytic activation (46.8 ± 6.97% area of NAc, p = 0.003) showed colocalization in the AcbSh (n= 8 slices, 6 mice; Fig. 4F2). This interaction was present in the AcbSh sub-region but not in the AcbC (MANOVA, d = 1, p = 0.015; Fig. 4G).
Astrocytes in the NAc show synapse-specificity in response to principal glutamatergic nuclei inputs.
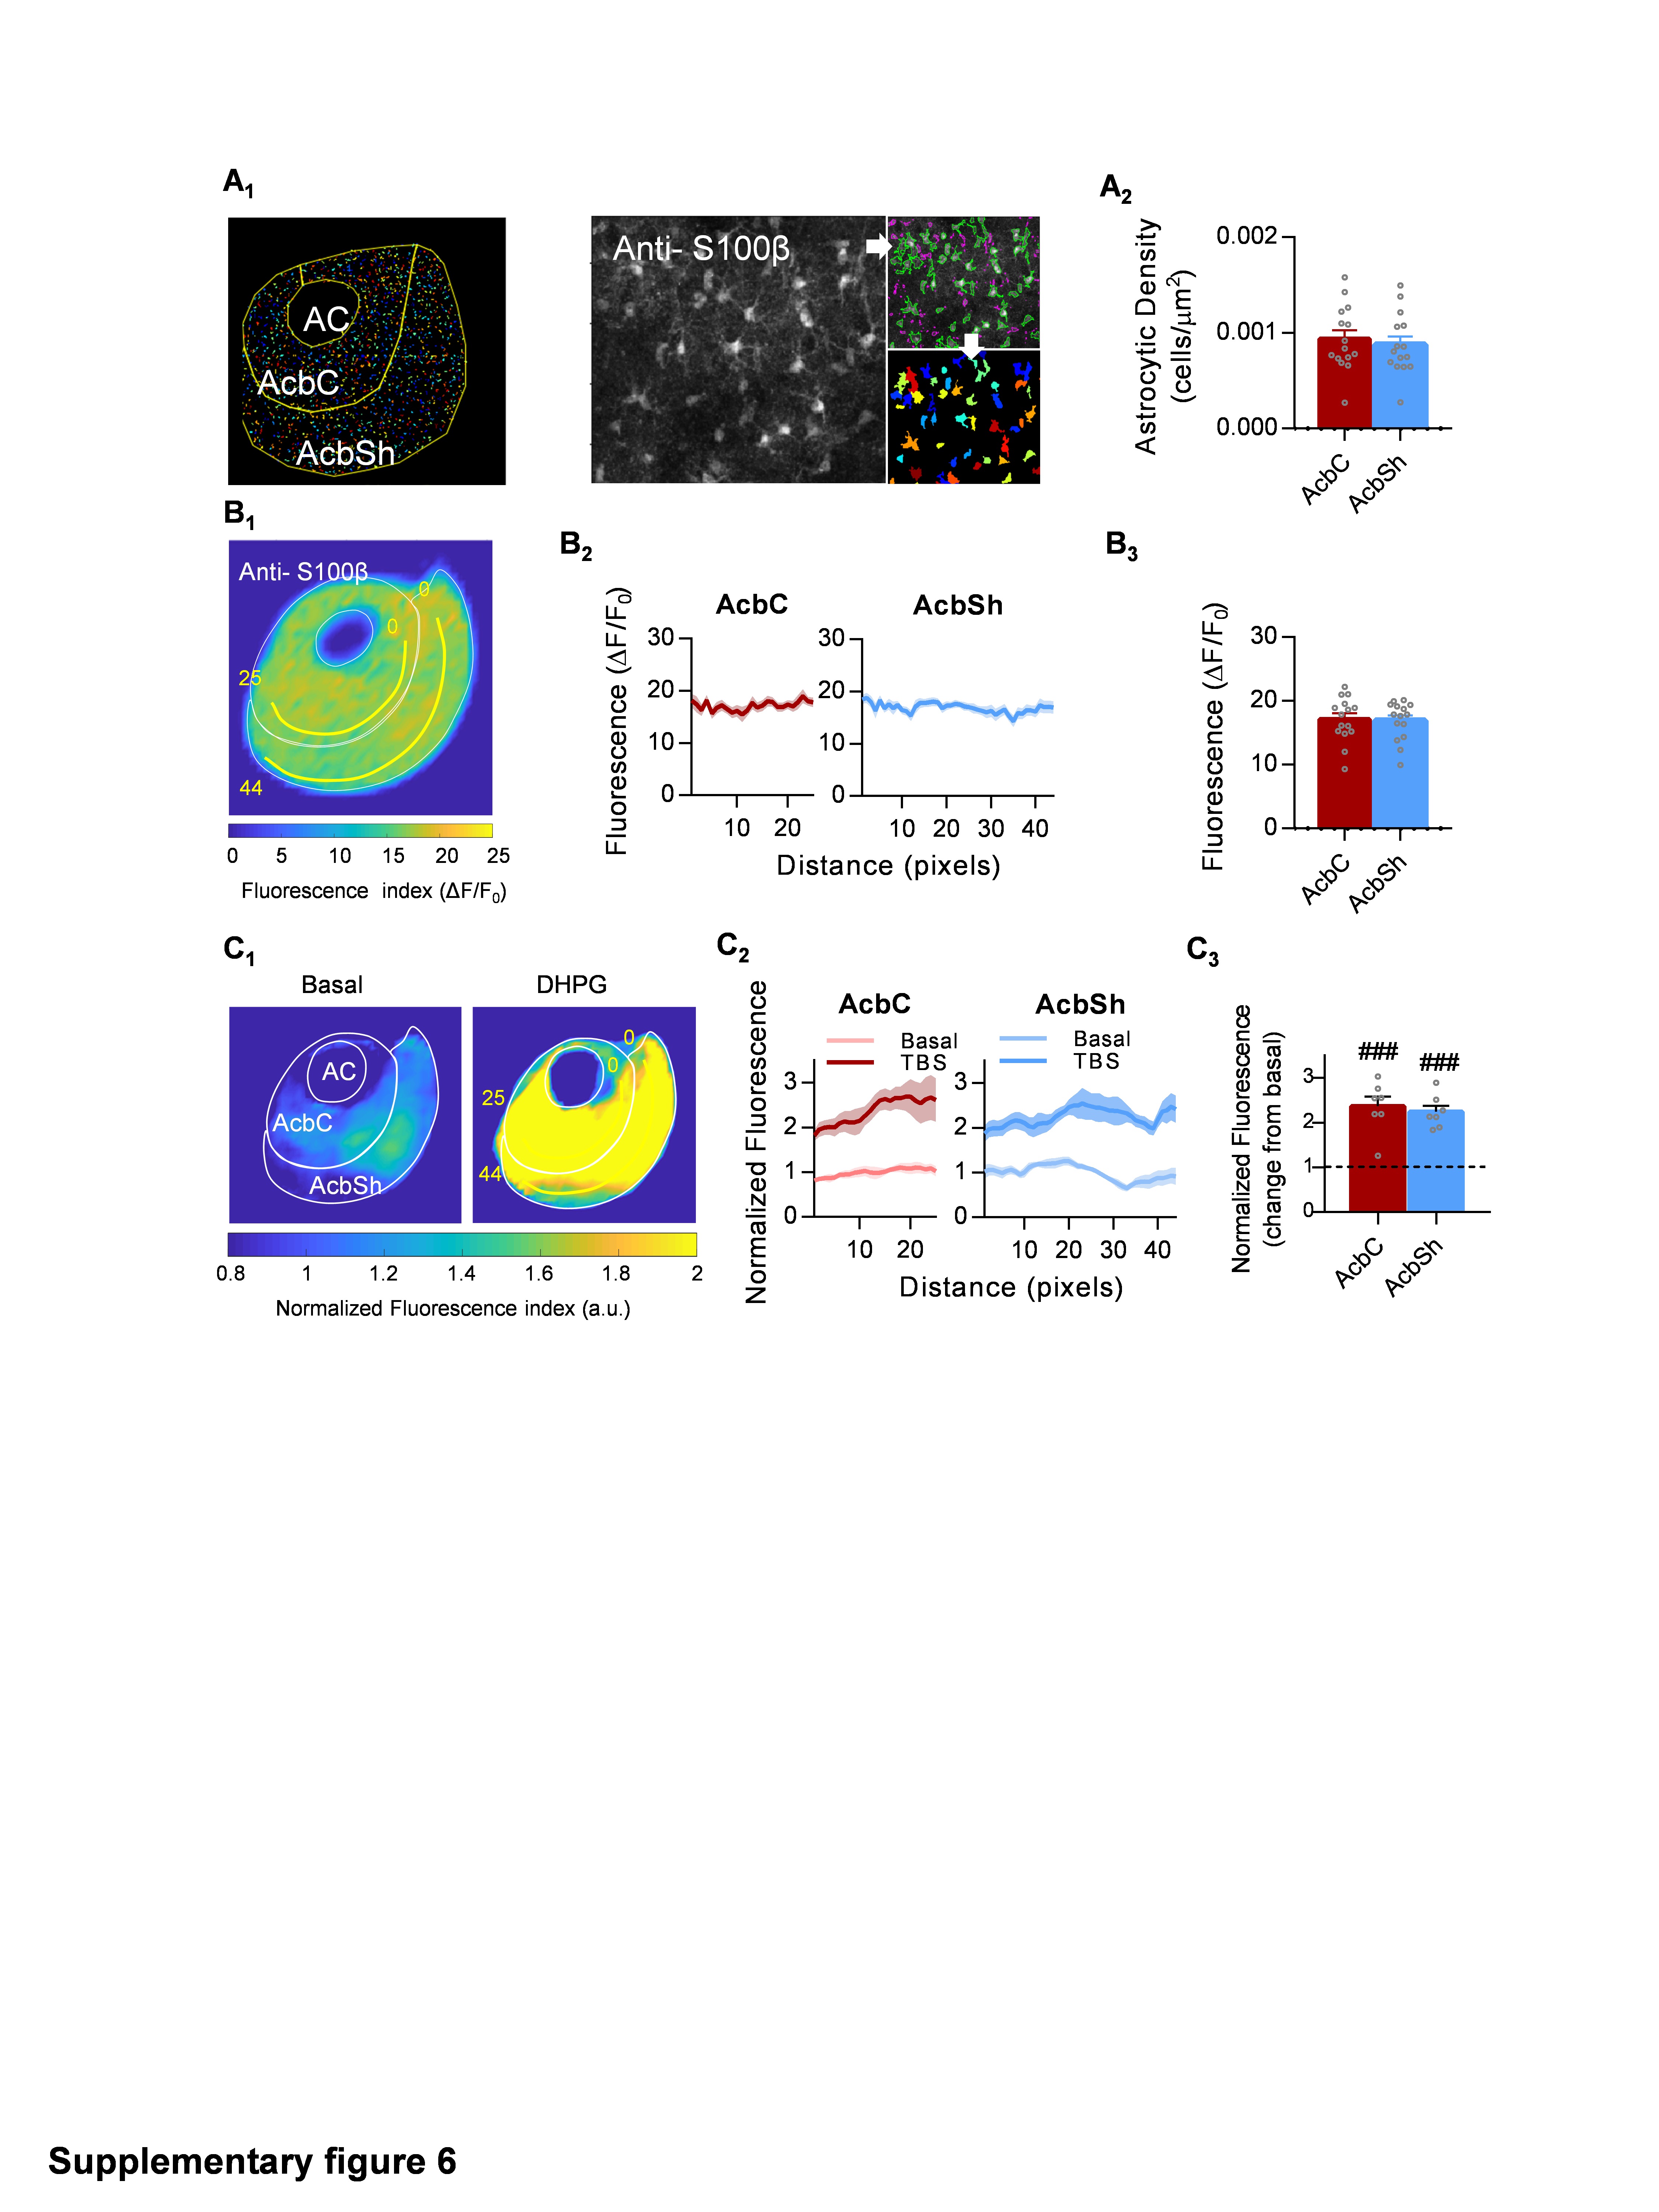
Next, we focused on NAc-intrinsic properties that could impact the previously recorded astrocytic calcium responses, since the integration of glutamatergic inputs in the NAc is an essential operation for diverse functions (e.g., reward, motivation and goal-directed behaviors) 9,26,36. First, we conducted a structural analysis of astrocytic density, followed by analysis of the Ca2+ signaling evoked by a group I mGluR agonist (DHPG, 50 µM) (Fig. S6). No significant differences were detected, neither in density (p = 0.61) nor spatial distribution (p = 0.84) of astrocytes, which showed a homogeneous dispersion across the whole nucleus (Fig. S6A2 and S6B3). Furthermore, the astrocyte response to DHPG bath application showed no differences across subregions (p = 0.64; Fig. S6C3), dismissing the existence of specific areas in the nucleus more sensitive to mGluR activation.
Next we explored the differences among the three glutamatergic pathways, analyzing the anatomical location of each astrocytic activity pattern and comparing the strength of astrocytic activation between pathways (Fig. 5). Using a spatial correlation test (Fig. 5B, see Materials and Methods), we observed positive spatial correlations; mPFC vs Amyg (Pearson r = 0.5122, p < 0.001), Amyg vs vHip (Pearson r = 0.5877, p < 0.001), mPFC vs vHip (Pearson r = 0.705, p < 0.001) indicating that the three neuron-astrocyte circuitry responses encompass similar areas of the NAc. When focusing on the intensity of the astrocytic responses (Fig. 5C), we detected that vHip afferents significantly triggered stronger activity in the AcbC compared to the mPFC or Amyg (one-way ANOVA, p = 0.03), while in the AcbSh, the three projection nuclei activated NAc astrocytes to a similar degree (one-way ANOVA, p = 0.36). This result demonstrates a different level of astrocytic activation depending on the pathway, showing synapse-specificity and supporting the notion that NAc astrocytes can discern the origin from each of the glutamatergic inputs.
Moreover, the differences in AcbC and AcbSh astrocytic responses for each pathway (Fig. 5C2) suggested the existence of intrinsic processing for each NAc region. To further explore this idea and to understand the molecular mechanisms that underlie the physiological heterogeneity between astrocyte Ca2+ activity from the AcbC and AcbSh (Fig. 6A and B), we measured the number of copies of mitochondrial genomes in single astrocytes from each region. Mitochondrial DNA (mtDNA) encodes essential genes for energy generation and is a key regulator of mitochondrial function. Mitochondria mediate energy supply and metabolism37 and have been shown to regulate intracellular Ca2+ dynamics in astrocytic microdomains38. We measured mtDNA copy number using a novel approach based on single-cell mtDNA amplification by droplet digital PCR (patch-dPCR)39. Unlike massively parallel sequencing techniques that provide relative DNA quantification based on a control DNA or number of reads, patch-dPCR allows accurate quantification of absolute values of DNA copies at single-cell resolution39. The mitochondrial DNA quantification for AcbSh (103.1 ± 14.9 mtDNA copies/cell; n = 32 cells, 11 mice) and AcbC (163.1 ± 32.9 mtDNA copies/cell; n = 32 cells, 11 mice) astrocytes revealed higher mtDNA copy number in AcbC with respect to AcbSh (p < 0.04). This difference was also present comparing AcbC (p < 0.001) astrocytes with respect to control (in which the pipette was internalized into the bath and no mtDNA collection was performed) compared to AcbSh (p = 0.004) (Figure 6B2), suggesting molecular heterogeneity between the astrocytes from both sub-regions. These results, in concordance with the Ca2+ signaling observations (Figure 6A), reveal different functional dynamics among sub-regions, indicating an increased activity coupled with higher mtDNA copy number in AcbC astrocytes.
Overall, these results demonstrate that NAc astrocytes respond specifically to each glutamatergic input with synapse-specificity, suggesting physiological and molecular heterogeneity between AcbC and AcbSh astrocytes.
Pathway-specific neuron-astrocyte networks in NAc circuitries
The above results showed tethered spatial overlap between high-density afferent areas and regions with an increased evoked astrocytic activity (Figs. 2F, 3F and 4F). To further ascertain these regions, we compared the astrocyte’s interaction with the afferents in each of the three pathways using a pixel-by-pixel spatial correlation analysis (Fig. 7A): mPFC vs Amyg (Pearson r = 0.0985, p = 0.009) and Amyg vs vHip (Pearson r = 0.3158, p < 0.001) showed no correlation, whereas mPFC vs vHip (Pearson r = -0.2866, p < 0.001) showed a negative correlation. We conclude that the interaction between astrocytes and afferents showed spatial segregation, which could point to the existence of hotspots in the NAc for each glutamatergic input.
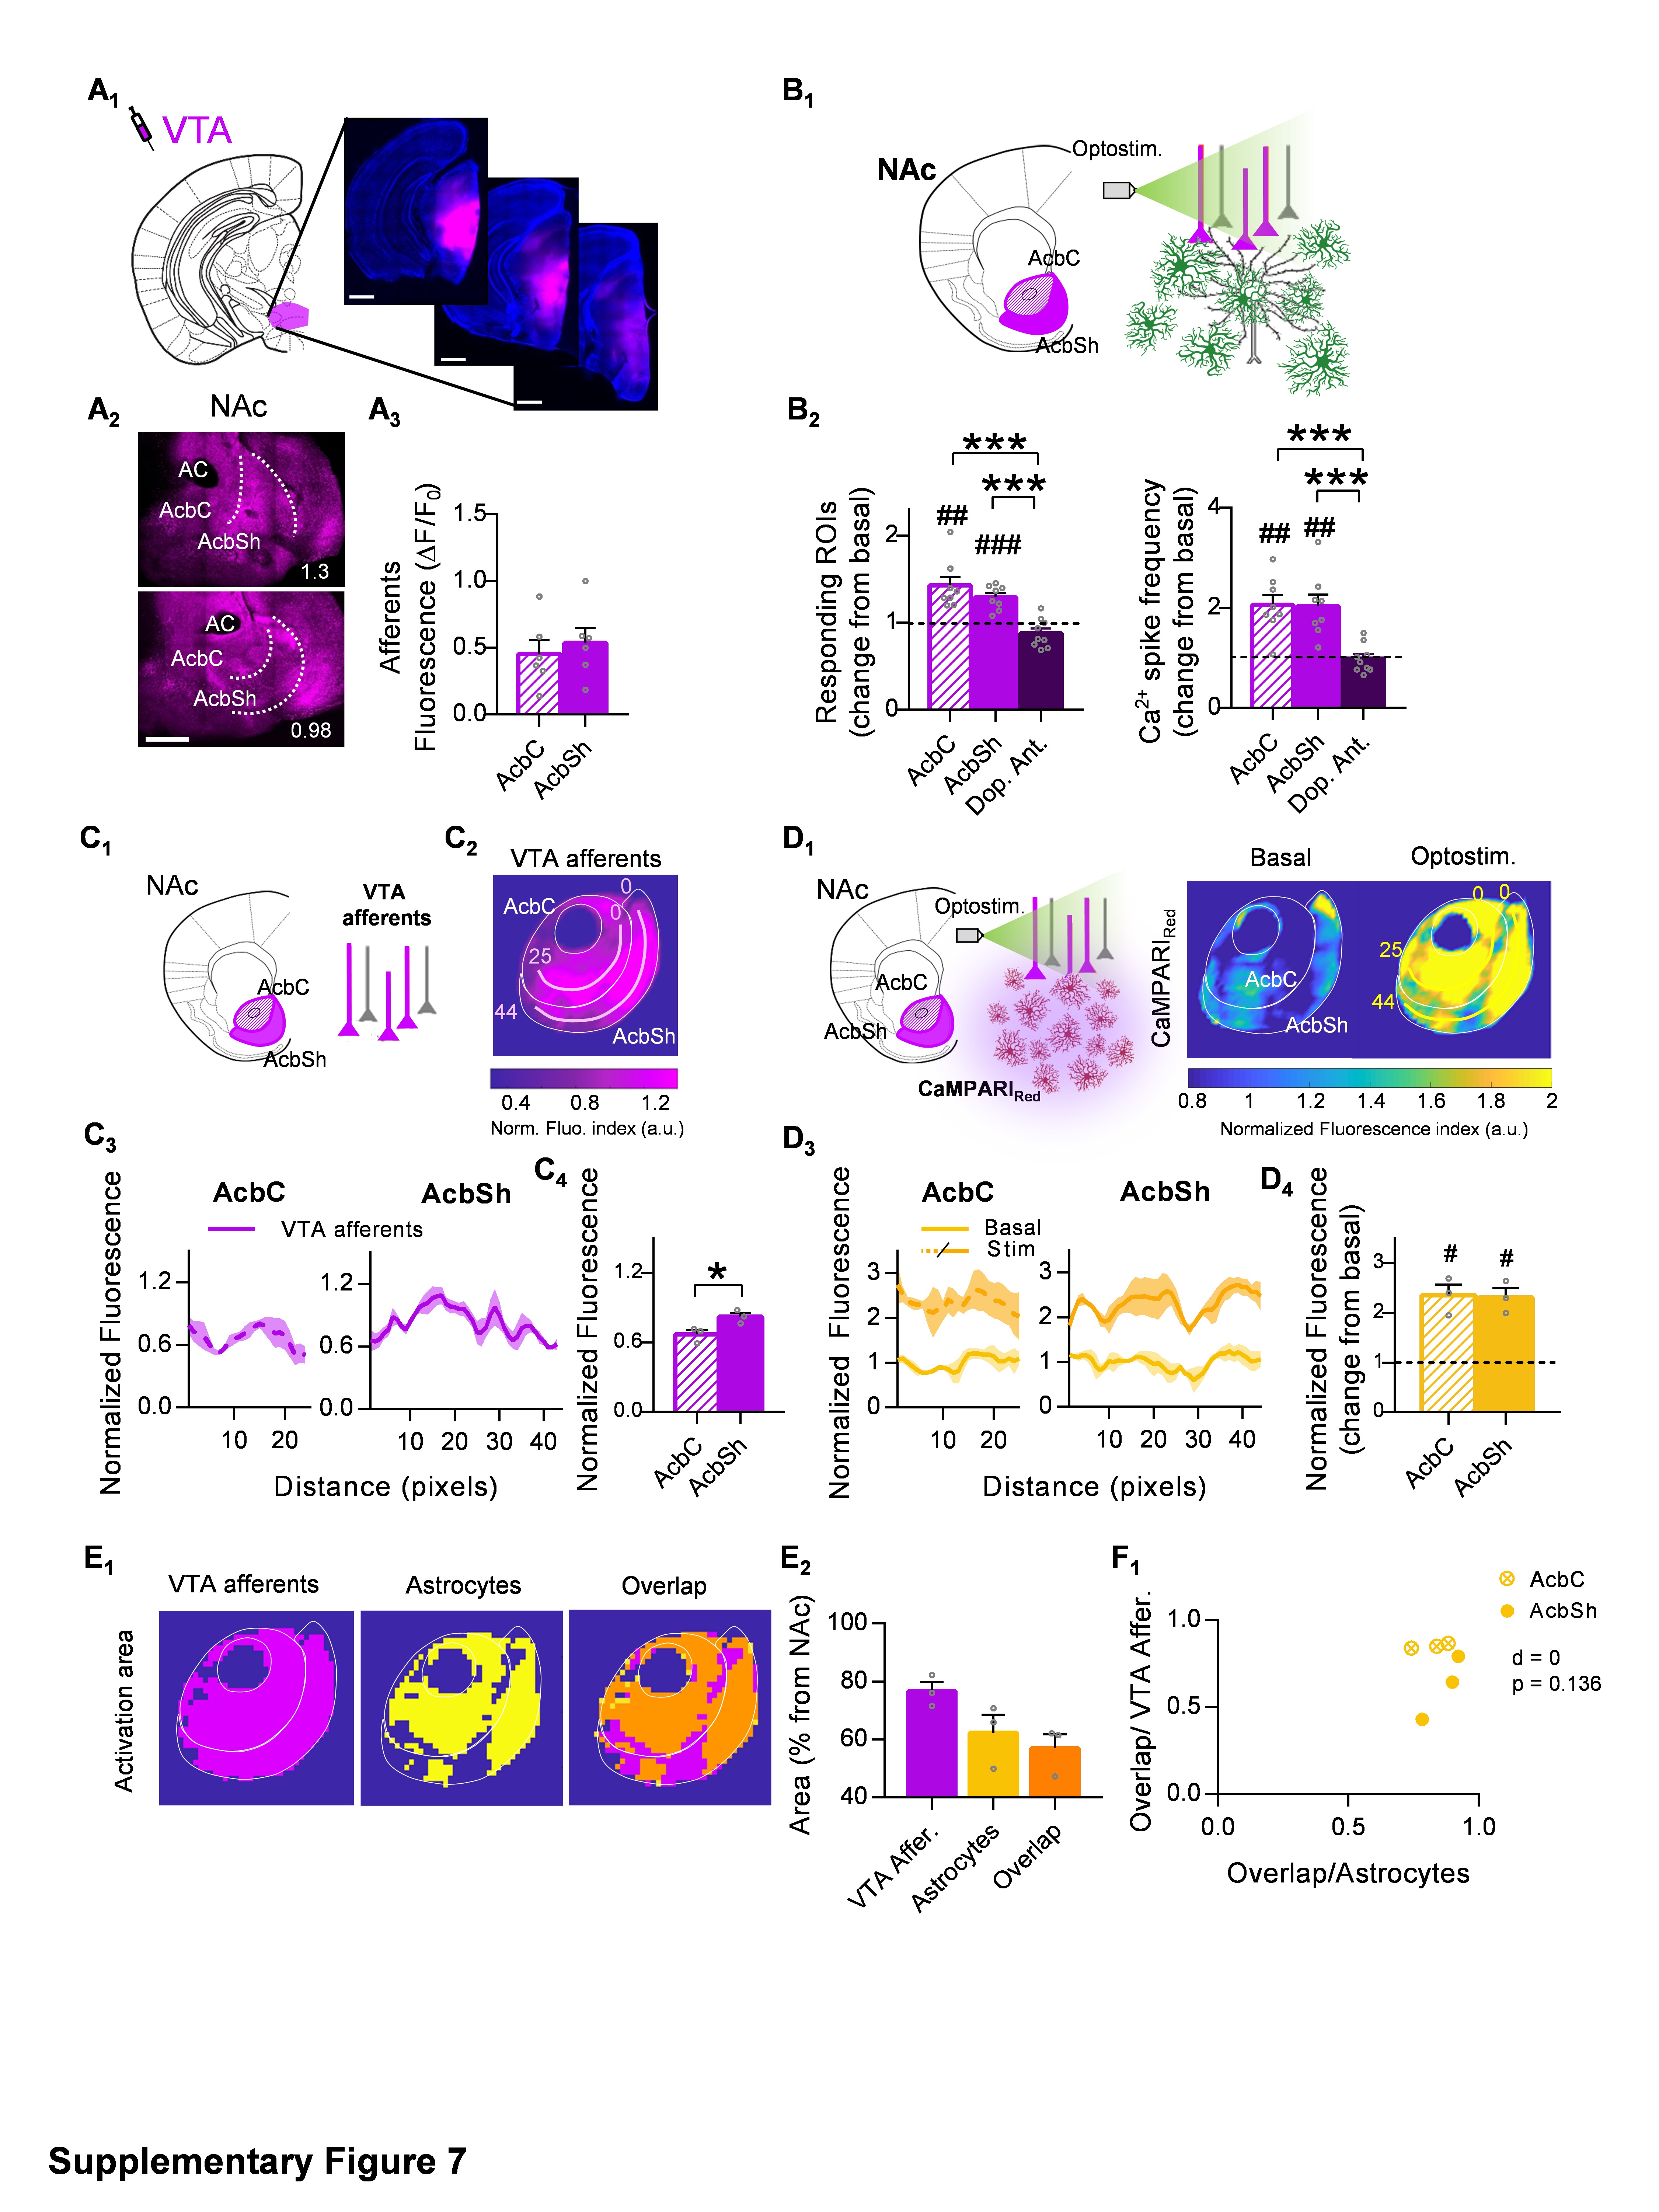
Furthermore, we wanted to ascertain whether the NAc astrocytes exhibit these pathway-specific features in response to other neurotransmitters rather than the glutamatergic system, so we focused on the ventral tegmental area (VTA) inputs to the NAc (Fig. S5). The VTA contains different neurons that co-release dopamine and glutamate, but it has been classically described as a predominantly dopaminergic nucleus40. Innervation of this nucleus to the NAc was homogeneous across subregions, as shown by the analysis of afferent’s histology (0.46 ± 0.1 and 0.54 ± 0.11 ΔF/F0 in the AcbC and AcbSh respectively, p = 0.6; Fig. S7A3). Afterward, we registered the astrocytic Ca2+ dynamics in response to optostimulation of VTA afferents in control conditions and after bath perfusion of dopamine receptor antagonists (10 µM haloperidol and 10 µM SCH 23390; Fig. 7B). In agreement with previous studies which showed that NAc astrocytes respond to dopamine released from the VTA27, the optostimulation of these axons increased the frequency of Ca2+ spikes in both NAc subregions AcbC (2.06 ± 0.2, change from basal; p = 0.001) and AcbSh (2.04 ± 0.23, change from basal; p = 0.003) (n = 8 slices, 5 mice) which was blocked in presence of antagonists (0.99 ± 0.1, change from basal; p = 0.89; n = 9 slices, 2 mice) (Fig. S7B2), confirming that this neuron-astrocyte communication was mediated by dopamine. Using CaMPARIGFAP photoconversion and PRQ spatial analysis, we observed increased calcium activity in wide areas of the NAc (n = 6 slices, 3 mice; Fig. S7D4) and spatial analysis revealed that NAc astrocytes respond in areas directly innervated by VTA axons (p = 0.07, Fig. S7E). In fact, when the % overlap area was compared between pathways (p < 0.001, Fig. 7B2), our data show that restricted interaction between intense astrocytic Ca2+ activity and highly innervated areas of the NAc is an intrinsic feature of glutamatergic transmission not present in dopaminergic afferents.
Simultaneous activation of different glutamatergic pathways reveals integrative properties of NAc astrocytes.
Finally, we investigated how incoming synaptic signals from various glutamatergic pathways were integrated by NAc astrocytes. The ability to integrate multiple synaptic inputs from different entries is a fundamental property of neurons25. Similarly for individual astrocytes, there is evidence of synaptic input integration through Ca2+ spike mediation25,41. To test for the existence of integrative capacities in astrocytes of the NAc, we studied Ca2+ responses triggered by the combined stimulation of two or three glutamatergic pathways simultaneously. For that, we expressed the ChR2-EYFP opsin in combinations of 2 or 3 glutamatergic nuclei, stimulated all the NAc projecting fibers and measured the astrocytic response through CaMPARIGFAP photoconversion in the AcbC and AcbSh (Fig. 7).
Co-stimulation of the mPFC and Amyg afferents did not trigger large astrocytic activity in the AcbC (1.23 ± 0.26 ΔF/F0 change from basal, p = 0.42) nor in AcbSh (1.18 ± 0.09 ΔF/F0 change from basal, p = 0.11), the latter being significantly lower than the individual responses (p = 0.05; n= 10 slices, 3 mice; Fig. 7A3). A similar outcome resulted from the co-stimulation of Amyg and vHip axons (Fig. 7B3), with recorded values close to baseline in the AcbC (1.36 ± 0.32 ΔF/F0 change from basal, p = 0.3) and AcbSh (1.14 ± 0.22 ΔF/F0 change from basal, p = 0.55; n= 14 slices, 4 mice). Therefore, we found that co-activation of mPFC+Amyg or Amyg+vHip, resulted in weaker responses of astrocytic Ca2+ signaling compared to stimulation of single pathways. Conversely, co-stimulation of the mPFC and vHip afferents (Fig. 7C) induced strong astrocytic activity in both the AcbC (2.11 ± 0.4 ΔF/F0 change from basal, p = 0.039) and AcbSh (2.24 ± 0.47 ΔF/F0 change from basal, p = 0.046), resulting in a similar Ca2+ activity as that triggered by individual pathway optostimulation (AcbC, p = 0.12; AcbSh, p = 0.73; n= 12 slices, 5 mice; Fig. 7C3). These different outcomes in astrocytic dynamics depending on the combination of glutamatergic inputs confirm that astrocytes are able to differentially respond according to the pathway from which the inputs are received.
Moreover, when all three pathways were stimulated simultaneously (mPFC + Amyg + vHip), we did not find any increase from basal levels in astrocytes of the AcbC (1.03 ± 0.16 ΔF/F0 change from basal, p = 0.84), and remarkably, astrocytes from the AcbSh reduced their activity even below basal values (0.69 ± 0.09 ΔF/F0 change from basal, p = 0.018; n = 12 slices, 3 mice; Fig. 7D3). These differences in Ca2+ processing between subregions further suggest the existence of neuron-astrocyte circuitries that work to coordinate responses to glutamatergic afferents.