3.1. The basic characteristics of study subjects
The general clinical and demographic data of IMN patients and healthy controls were summarized in Table 1. There were no significant differences in age, gender, bristol stool scale, fecal dry weight percentage between the two groups, but BMI in IMN group was significantly higher than healthy control, suggesting that obesity might be a risk factor for IMN pathogenesis. Compared with the healthy group, IMN patients have significantly higher levels in BUN, TC, LDL-C and peripheral neutrophil count, and lower hemoglobin and CCr (P<0.05). Remarkably proteinuria and hematuria were also observed in the urine of IMN patients. In addition, IMN patients have higher blood pressure compared with healthy control, which was indicated by significantly higher systolic blood pressure (SBP) and diastolic blood pressure (DBP) (P<0.01). Generally, CKD patients were categorized into five stages according to eGFR, using the Chronic Kidney Disease Epidemiology Collaboration (CKD-EPI)–creatinine equation, as recommended by the KDOQI, and all the cases in the current study belonged to stage 1 to stage 3.
3.2. Gut microbiome characteristics between IMN and healthy group
All the effective tags in samples were clustered in OTUs with 97% identity, and a total of 2061 OTUs were identified, 1183 OTUs were shared between two groups, with 252 OTUs specific in IMN group and 626 OTUs unique in healthy control (Fig.1A and supplemental table 1).
Richness of microbial communities between IMN and healthy control was evaluated by index of observed species, chao1 and ACE, which was shown in Fig.1B. Results showed that richness of intestinal microbiota in IMN group was significantly reduced compared with healthy control. α-diversity indexes of IMN group were also significantly lower than those of the healthy group, including shannon, simpson, phylogenetic diversity (PD) whole tree (Fig.1B). As for β-diversity, significant difference was also found based on the weighted (quantitative, ANOSIM R=0.223, P=0.001) but not unweighted (qualitative, P > 0.05) UniFrac between IMN and healthy groups (Fig. 1C), which indicated that presence of OTUs was not significantly different between two groups, but composition ratio of OTUs was more significantly different between IMN and healthy group. The relative abundance of taxa at different levels from microbiota between these two groups was shown in supplemental Fig.S1.
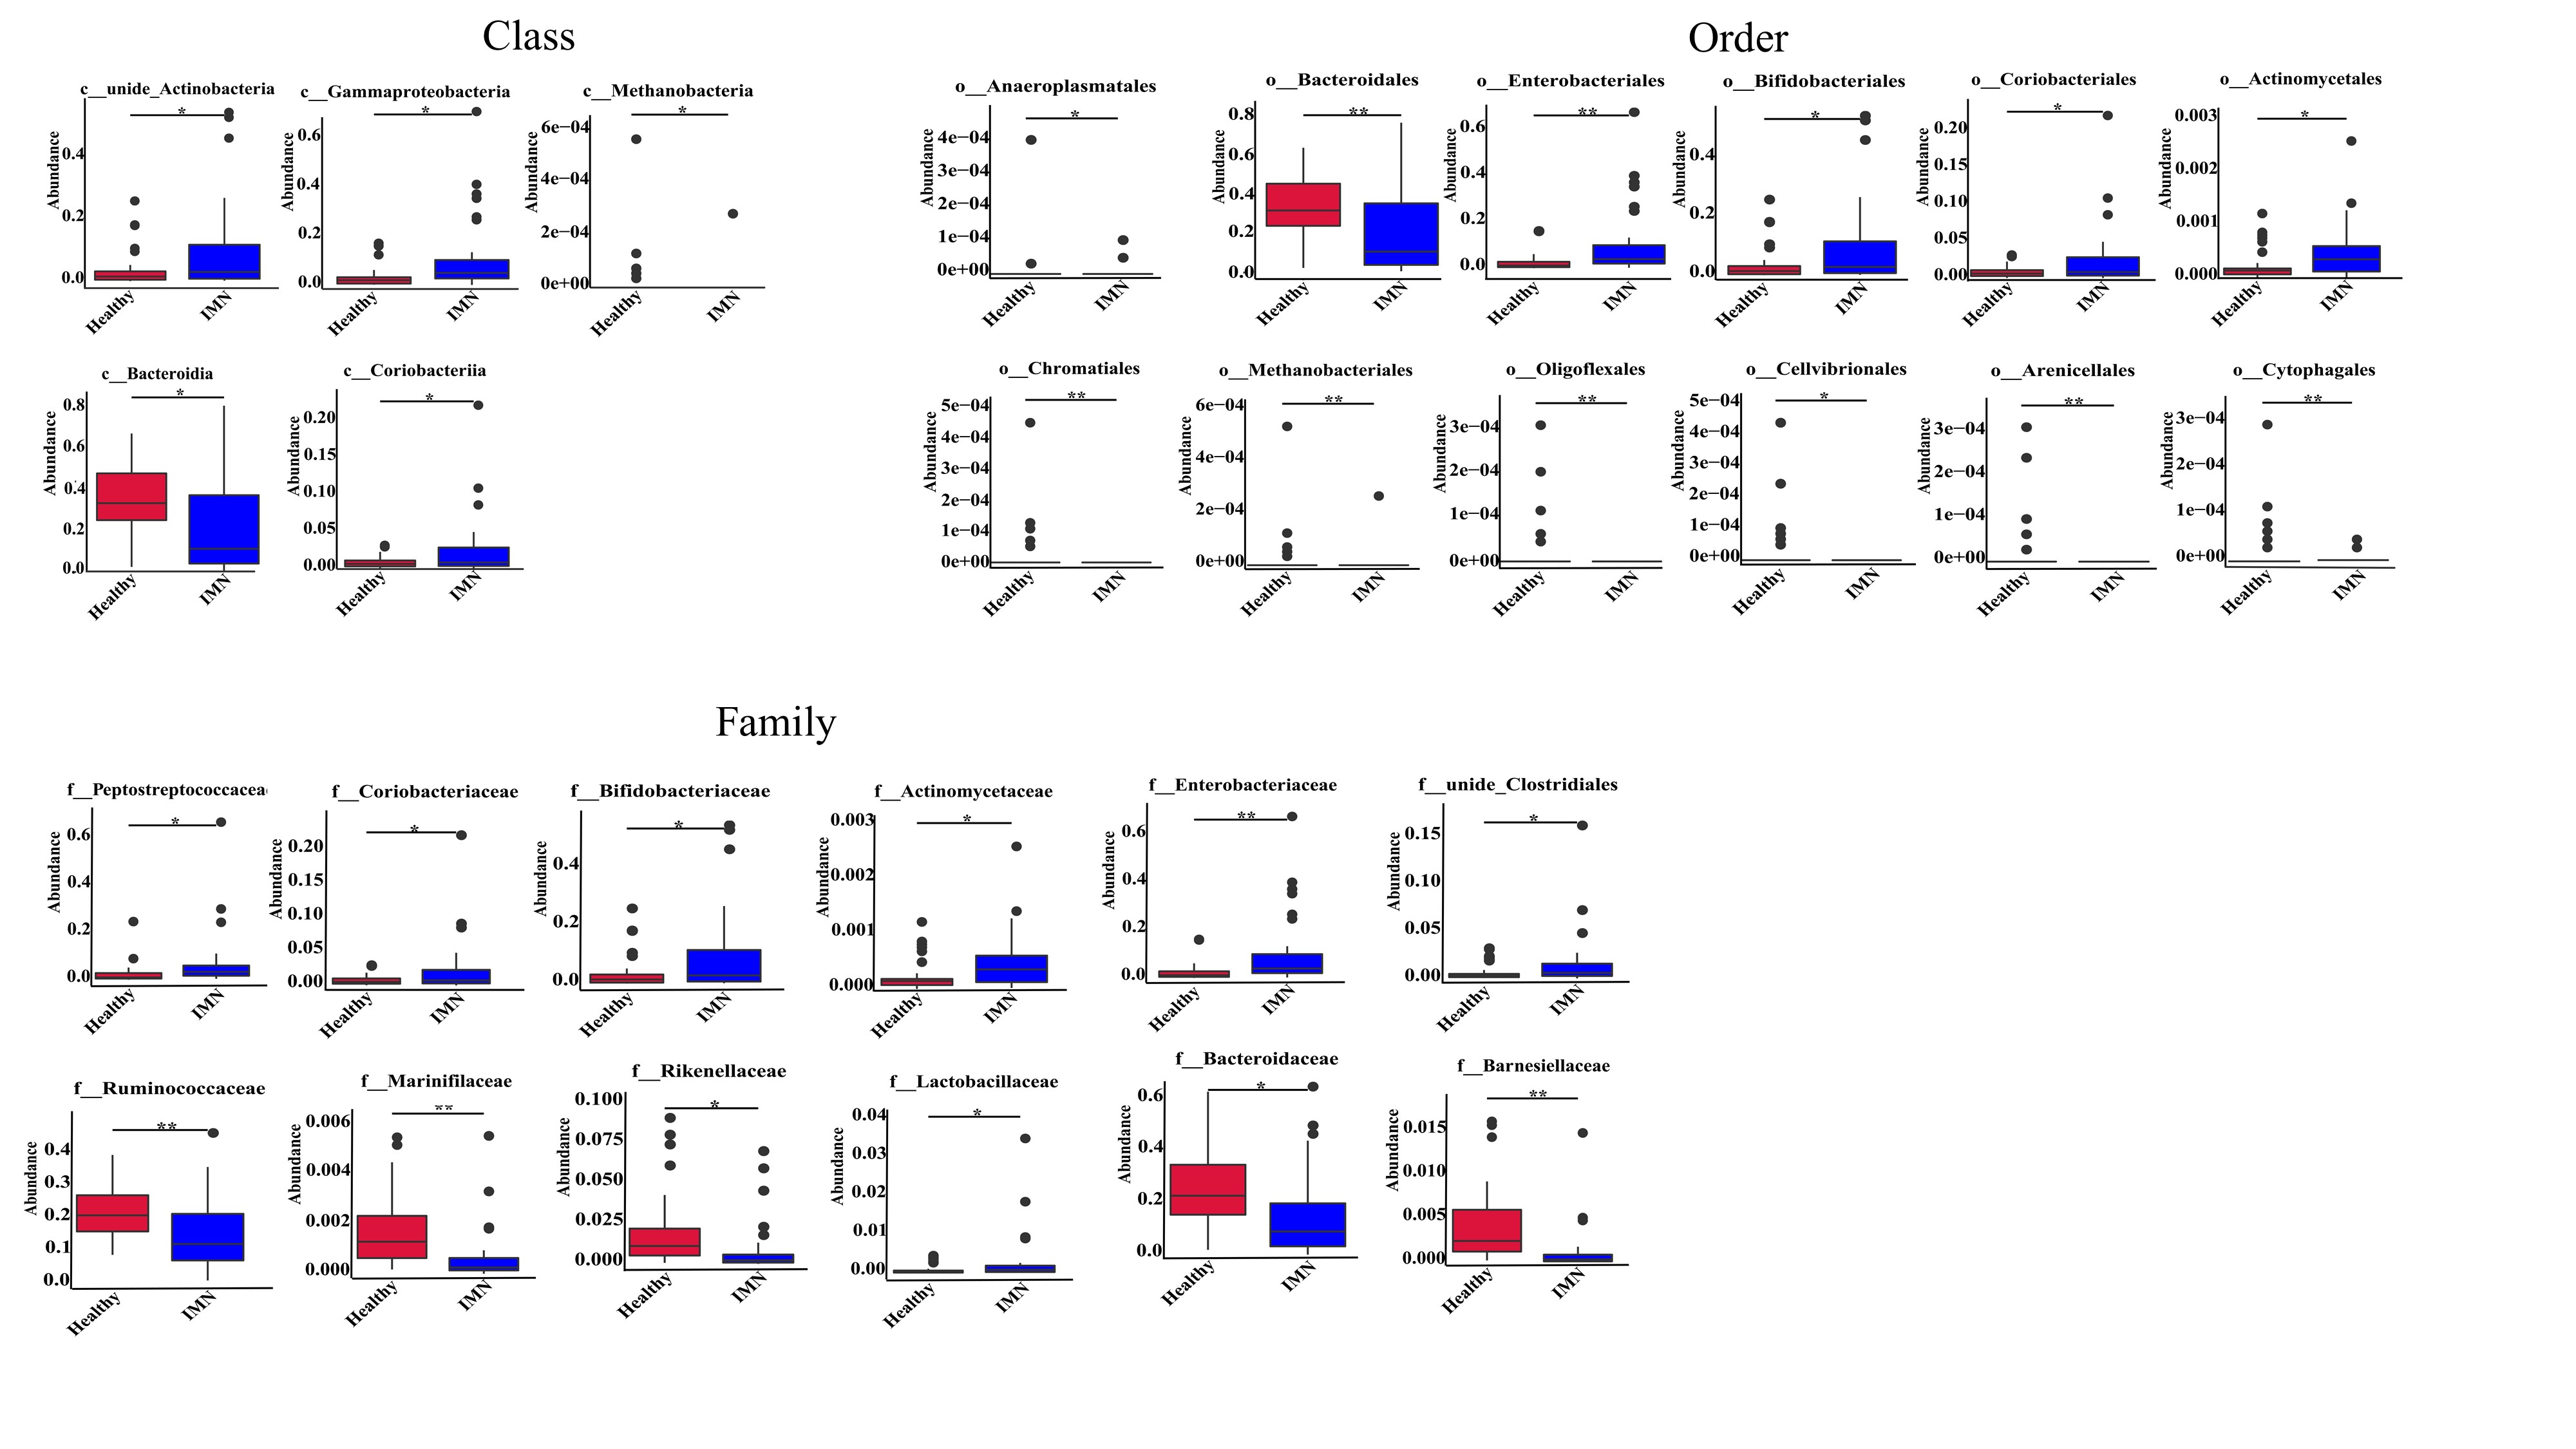
3.3. Differential taxa in intestinal microbiota between IMN and healthy groups
To best of our knowledge, it is the first description of gut dysbiosis in IMN patients from Chinese population, therefore, it is necessary to describe all the differential taxa at all the levels, including phylum, class, order, family and genus (supplemental table S2). On the phylum level, the Firmicutes/Bacteroidetes (F/B) ratio is considered as an important indicator in the composition of the intestinal microbiota, and as shown Fig. 2A, the F/B ratio significantly increased in the IMN group compared with healthy control. In detail, Bacteroidetes in IMN group reduced significantly compared with healthy control (32.06% vs 18.91%, Healthy vs. IMN, P<0.01), and relative abundance of Firmicutes kept at almost same level between two groups (Fig.2B). MetaStat was used to analyze the significantly differential taxa at all the levels between two groups, and at the phylum level, besides of Firmicutes and Bacteroidetes, the Proteobacteria and Actinobacteria were enriched in IMN groups (P<0.05), and the minor phylum, Euryarchaeota was enriched in HC group (P<0.05). At the genus level, the bacteria detected in the IMN groups predominantly belonged to the Bacteroides (13.37%), Bifidobacterium (8.92%), unidentified_Enterobacteriaceae (7.52%), Romboutsia (5.29%), and Faecalibacterium (5.26%) genera. Likewise, the most abundant genus in the healthy group were Bacteroides (23.59%), followed by Faecalibacterium (9.69%), Dialister (3.32%), and Bifidobacterium (3.19%). As shown in Fig.3C, the top12 genera with most significant differences were following, Romboutsia, unidentified Enterobacteriaceae, Bifidobacterium, Collinsella, unidentified Clostridiales, Citrobacter were remarkably higher in IMN group (p<0.05), and Bacteroides, Faecalibacterium, Dialister, Roseburia, Alistipes, Paraprevotella were at higher level in the healthy group (p<0.05). The top 12 significant differential taxa at class, order and family were shown in supplemental Fig.S2.
Linear discriminant analysis (LDA) effect size (LefSe), a supervised learning model, was used to reduce the dimensions and identify the presence and effect size of specific taxa between IMN and healthy group. A logarithmic LDA score cutoff of 4.0 was set up in the current study, and total 22 taxa at all levels were discovered as high-dimensional fecal microbiota biomarkers between IMN and healthy groups (LDA score (log10)>4, p<0.05) (Fig.3A and 3B). At phylum level, Proteobacteria and Actinobacteria significant increased in IMN group, while Bacteroidetes increased in healthy group. At class level, IMN group showed higher enrichment of Gammaproteobacteria and unidentified Actinobacteria, while Bacteroidia were significantly enriched in healthy group. At order level, Enterobacterial and Bifidobacterial were higher in IMN group, whereas Bacteroidia increased in healthy group. At family level, IMN group was characterized by higher abundance of Enterobacteriaceae, Bifidobacteriaceae and Peptostreptococcaceae, whereas normal group was characterized by Bacteroidaceae and Ruminococcaceae. At genus level, IMN patients were mainly characterized by higher relative abundance of unidentified Enterobacteria, Bifidobacterium, Romboutsia, whereas the relative abundance of the genera Dialister, Faecalibacterium, Bacteroides were higher in healthy samples. At species level, Escherichia coli was in higher abundance in IMN group, while Bacteroides dorei was more enriched in healthy group.
GLMs were used to model the genera that were significantly different between IMN and healthy subjects after controlling for possible confounding factors, such as age, gender and BMI. The differences between feces from IMN and healthy control were associated with the genera Bifidobacterium, unidentified Enterobacteriaceae, Romboutsia, Collinsella, Citrobacter, unidentified Clostridiales, Lactobacillus, Blautia, Intestinibacter, Haemophilus, Dorea, Fusicatenibacter (p<0.05, table 2), suggesting that these genera were associated with IMN. On the other hand, genera Alistipes, Roseburia, Paraprevotella, Butyricicoccus, Barnesiella, Dialister, Bacteroides, Faecalibacterium, Sutterella were negatively associated with IMN (P<0.05, table 2).
3.4. IMN-related microbiota biomarker predictive model
In order to screen the representative taxa at genus level as biomarkers to distinguish IMN efficiently and specifically from healthy persons, random forest model (RF) was used to build a predictive model based on fecal microbiota profile using the significantly different abundance genera from MetaStat test as the input. Here, 20 genera predicted IMN are screened out through Mean Decrease Accuracy and Mean Decrease Gini using the RF model (Fig.3C). The diagnosis performance of these 20 genera combination was evaluated by receiver operating characteristic curve (ROC). The AUC (the area under the receiver operating characteristic curve) was 93.53%, with confidence interval (CI):0.8775-0.9931 (Fig.3D).
3.5. Associations of the gut microbiome with clinical indicators
We carried out the correlation analysis between gut microbiota (genus level, at a prevalence>1%) and IMN clinical parameters, which were related with systemic immune status, abnormal lipid metabolism and renal function respectively (Fig.4). For indicators related to systemic immune status, Dialister had the significant positive correlation with serum C3(sC3), sC4 and sIgM, meanwhile Faecalibacterium was only positively related to sC3 (p<0.05) and Fusicatenibacter was positively correlated with sIgG (p<0.01). Genus Phascolarctobacterium and unidentified Prevotellaceae had a significant negative correlation with sIgA (P<0.05 and P<0.01 respectively). As for renal function indicators, the genera Terrisporobacter, Intestinibacter, Citrobacter, Streptococcus, unidentified Clostridiales, Klebsiella and unidentified Ruminococcaceae were all positively associated with hematuria (p<0.01 in unidentified Ruminococcaceae). Among them, unidentified Clostridiales and Klebsiella also had a positive correlation with 24h proteinuria (p<0.01 and p<0.05 respectively). In addition, Fusobacterium was negatively associated with BUN (p<0.05). Streptococcus had a positive correlation (p<0.05) while Parabacteroides and Akkermansia had a negative correlation with glomerular IgG deposition (p<0.05 and p<0.01 respectively). Regard to parameters related to blood pressure and lipid metabolism, Collinsella had a significant negative association with SBP and DPB, while Bifidobacterium only showed the negative correlation with DBP. Besides, we could observe that unidentified Prevotellaceae, unidentified Clostridiales and Citrobacter were all positively correlated with total serum cholesterol (P<0.01). Similarly, Dialister, unidentified Clostridiales and Sutterella were positively associated with TG (p<0.01 in Dialister). As for HDL, genera Parabacteroides, Flavonifractor, Bacteroides, Alistipes, Roseburia and Akkermansia displayed the remarkable positive correlation (p<0.01), while Streptococcus and Lactobacillus showed the significant negative relationship (p<0.05). Beyond these, unidentified Enterobacteriaceae had a significant positive association with LDL (p<0.05), while Fusobacterium was negatively correlated with LDL (p<0.05).
In addition, we could discover that some genera were associated with peripheral WBC, neutrophils, lymphocytes and hemoglobin (HGB), which were related to innate immunity and human basically physical condition. Lactobacillus was negatively related to WBC and neutrophils (p<0.05), while Alistipes showed the positive correlation with neutrophils (p<0.05). Unidentified Enterobacteriaceae and Dialister had positive relevance with peripheral lymphocyte number (p<0.05). Anemia is common complication for kidney disease, and for HGB, genus unidentified Prevotellaceae, Phascolarctobacterium, Flavonifractor, Bacteroides and Parabacteroides displayed remarkable negative correlation (p<0.01), whereas Collinsella, Dorea and Haemophilus were positively correlated with HGB (p<0.05).
Short-chain fatty acids (SCFA) producing bacteria were considered to be protective for CKD, and we compared their relative abundance between two groups, and analyzed their correlation with clinical parameters, including Roseburia, Faecalibacterium, Clostridium and Paraprevotella. Roseburia, although decreased 50% in IMN group compared with healthy control, it did not show correlation with any clinical characters in the current study. Faecalibacterium also decreased in IMN group (9.7% in healthy group vs. 5.3% in IMN), and its abundance was positively with serum C3. Clostridium did not change between two groups. Paraprevotella decreased from 0.53% (healthy group) to 0.06% (IMN), but no significant correlation with clinical parameters was found.
Although serum PLA2R antibody was a biomarker for IMN, no specific genus which had significant correlation with serum PLA2R antibody was found among all the differential genera.
3.6. Function prediction analysis
Tax4Fun was used to predict the functions of the differential intestinal microbiota of two groups, based on functional annotation information of OTUs using the Silva database sequence as a reference. According to the annotation results of Kyoto Encyclopedia of Genes and Genomes (KEGG) pathway database, abundant of functional groups - KOs (KEGG orthologous groups) had been screened, and a total of 6508 KOs were identified from IMN and healthy groups, of which 1587 KOs were identified with significantly different abundance between two groups (false discovery rate (FDR), P<0.05), illustrating that there were functional aspects of the gut microbiota associated with IMN. All the significantly differential KOs were listed in Table S3, and top 26 KOs based on difference significance were shown in Fig.5A. The predictive microbiota functions at level 1 and 2 KEGG pathways were shown in Fig.5B. Among them, genetic information processing, replication and repair, membrane transport, translation, nucleotide metabolism, cellular community-prokaryotes were highly enriched in IMN samples (p<0.01), whereas gene function that related carbohydrate metabolism, energy metabolism, glycan biosynthesis and metabolism and catabolism were higher in healthy group, p<0.01.
Total 390 level 3 KEGG pathways had been identified by OTU annotation in two groups. By calculating FDR-corrected P value <0.05, 158 significantly differential KEGG pathways were identified between two groups based on OUT abundance on pathways, which was shown in Fig.5C. Top five enriched pathways in IMN group were transporters, DNA repair and recombination protein, phenylalanine tyrosine and tryptophan biosynthesis, purine metabolism and pyrimidine metabolism (P<0.01), whereas amino sugar and nucleotide sugar metabolism, pyruvate metabolism, alanine-asparate-glutamate metabolism, butanoate metabolism were significantly up-regulated in healthy groups (P<0.01).
3.7. Fecal metabolite profiles
To confirm the alteration of function of gut microbiota, we explored the metabolic profile in the same fecal samples as that of 16s rDNA sequencing using an untargeted approach, through liquid chromatography-mass spectrometry and examined the relationship between microbiota and metabolites. A total of 2340 metabolites were identified. Heatmap and volcano analysis based on criteria (P<0.05, VIP>1 and fold change >2) identified total 466 differential fecal organic compounds, and 112 up and 354 down in IMN patients compared with healthy control, which was shown in Fig.6A and 6B and supplemental table S4. We observed a clear discrimination on fecal concentrations of their gut bacterial fermentation metabolites between these two groups both on PCA and PLS-DA score analysis (Fig.6C and 6D), reflecting the modified metabolic activity of the altered gut microbiome. The differential metabolites were classified into most abundant 15 chemical categories which was shown in Fig.6E, and top three are “amino acid, peptide and analogues”, “purine and purine derivates” and “fatty acid and conjugates”. Aims to understand the changed metabolism pathways due to gut microbiota dysbiosis, KEGG enrichment was performed with all significantly differential metabolites, however, only caffeine metabolism pathway emerged with P=0.002, Fatty acid biosynthesis (P=0.081), Vitamin digestion and absorption (P=0.089), and Oxidative phosphorylation (P=0.090), and other pathways all had P value higher than 0.1 (Fig.6F).
To explore the potential relationships between the gut microbiome changes and metabolic products, a correlation matrix was generated using Spearman correlation, and only top ten genera enriched in IMN and correlation with statistical difference were shown in Fig.6G. All the abundance of Bifidobacterium, Fusicatenibacter, and Lactobacillus positively correlated with the level of threitol, myricetin, dUMP, toltrazuril, geranylgeranyl pyrophosphate, xylitol, tanespimycin, and 3-[2-(2-pyridyl)ethyl]-1H-indole, and their correlation coefficient was higher than 0.7. Intestinibacter and Citrobacter shared similar metabolic pattern and positively correlated with Sulfaquinoxaline, Esculetin, Hydroxypyruvic acid and 2-Hydroxyestradiol. L-Arginine was positively correlated with Romboutsia with coefficient was 0.92. Whether these compounds play roles in IMN occurrence and progression deserves further clarification. The detailed correlation coefficients and significances between all the differential genera and all the differential metabolites (fold change>2, P<0.05, and VIP>1) were provided in supplemental table S5 and S6.
Aromatic amino acid, tyrosine, phenylalanine and tryptophan, and their metabolites in the intestine, contribute to the resource of main uremic toxins 37. In the present research, as shown in table 3, only tryptophan significantly increased in IMN feces sample compared with healthy control (20% increased, P<0.01), which was partly consistent with enhanced tryptophan biosynthesis pathway in gut microbiota of IMN group (Fig.5C). Indole, one of tryptophan uremic toxin metabolite precursor, significantly decreased almost half in IMN group (P=0.002), which was explained that that tryptophan accumulation in the faeces of IMN patients. Another endogenous tryptophan metabolite 5-methoxytryptophan, was reported to be one of most promising biomarker metabolites for detection of early-stage CKD in serum, decreased in the feces of IMN (P<0.05), which was consistent with previous report 38. Other tryptophan metabolites, such as 5-Methoxytryptamine, skatole, 3-Indoleacrylic acid were all significantly decreased in IMN group. Meanwhile, 3-indoxyl sulfate was higher in IMN group without statistical significance. We speculated that higher 3-indoxyl sulfate might contribute from plasma accumulation, instead of bacterium metabolism. tyrosine, phenylalanine and their uremic metabolite, p-cresol, did not change significantly between IMN and healthy group (table 3). The other well-known gut microbiota derived uremic toxin, trimethylamine N-oxide (TMAO), was also not altered between two groups (table 3).
3.8. Fecal bacterial cell counts and viability test before FMT
Antibiotic mixture can clear more than 90% of bacteria from the intestine, which were confirmed by counting the bacterium colonies in streak culture using faeces from animals (Supplemental Fig. S3B). The color of feces in antibiotics-treated animals seemed to be darker than before treatment (Supplemental Fig. S3C). The fecal bacterial cell counts and intactness in human samples were examined by flow cytometry, and the number of intact and damaged bacterial cells did not differ between IMN and healthy control, and about 90% bacteria are intact and live bacteria (Supplemental Fig. S3D). We calculated the live number of bacteria per gram of human feces, to make sure that same number of live bacteria was transfected into pseudo germ-free mice.
3.9. FMT affected renal function and lipid metabolism in mice
Four days after final FMT, blood and urine of mice were collected for laboratory examination. It could be found in Fig.7A that the levels of BUN and Scr in the FMT-IMN group was significantly higher than FMT-healthy group (P<0.01), but not different from FMT-saline group. The serum albumin levels were not different among three groups (Fig.7A). As for the lipid metabolism parameters, the serum LDL were significantly increased in FMT-IMN group compared with the FMT-healthy group (P<0.05), but not serum TG and total CHO (Fig.7A). As for the urinary indexes, the ratio of microalbumin/creatinine, NAG/creatinine and NGAL/creatinine were all significantly elevated in FMT-IMN group compared with other groups, which suggested that more renal serious injuries had been caused by FMT with IMN faeces (Fig.7B). Further HE staining showed that there were more glomerular hyperplasia and enlargement of tubular lumen in FMT-IMN group than FMT-healthy group. Immunohistochemistry using IgG indicated that more IgG immune complex was deposited in glomeruli of FMT-IMN group, and immunohistochemistry using NGAL also demonstrated that renal local inflammation and tubular slight injury in FMT-IMN group was aggravated than FMT-healthy group (Fig.7C).
Antibiotics treatment could cause body weight loss compared with normal control, and this loss was gradually reverse after terminating antibiotics. As shown in Fig. 7D, the growth curve of body weight in the FMT-healthy group and FMT-IMN group were both higher than that in the FMT-saline group, suggesting that intestinal flora has the function of providing nutrition. Body weight of FMT-IMN groups was slightly higher than FMT-healthy group, and also consistent with that BMI index in IMN patients was higher than healthy control.
3.10. Intestinal inflammation, endotoxin and NOD-like receptor activation contribute to the aggravated kidney injury by IMN-FMT
Aims to understand the molecular mechanisms of FMT with IMN feces aggravating kidney injuries, the mRNA sequencing was performed using total mRNA from kidney tissue in each group. Differential genes between FMT-IMN and FMT-healthy groups were mainly enriched in the following pathways by KEGG analysis (Fig.8A): Cytokine-cytokine receptor interaction, TNF signaling pathways, chemokine signaling pathways, and NOD-like receptor signaling pathways, and these pathways were all associated with inflammation. Specifically, the cytokine receptor interaction pathway mainly enriched the following genes: CCL12, CXCL2, CCL7, CCL5, IL9R and CCL20; GM5431, CCL12, CXCL2, CCL20 and CCL5 was mainly enriched in TNF signaling pathway; CCL12, CXCL2, CCL7, ADCY2, CCL5 and CCL20 were mainly enriched in the chemokine signaling pathway; and MEFV, CXCL2, CCL12, LCN2 and CCL5 were mainly enriched in NOD like receptor signaling pathway. The expression levels of the above genes in each group were further confirmed by QRT-PCR, and it could be found that the expression levels of these cytokines in the kidney tissues from FMT-IMN group were significantly higher than those from the FMT-healthy and FMT-saline groups (Fig.8B). Besides that, the “intestinal immune network for IgA production” and “systemic lupus erythematosus” pathways were also upregulated in FMT-IMN group, and activation of these pathways also contributed to the pathophysiology of IMN (Fig.8A).
NOD-like receptor pathway was most enriched pathway in KEGG analysis, which suggested that pathogens, like bacteria and endotoxin, might translocate into the systemic circulation through the impaired intestinal mucosal permeability. Elevated serum LPS level (Fig.8C) and more damaged structural integrity of intestinal tissue (Fig.8D) in FMT-IMN group confirmed this speculation. Immunohistochemistry further demonstrated higher expression of pro-inflammation cytokines and macrophage infiltration into the colon tissues of FMT-IMN group than the FMT-healthy group (Fig.8E).