TAK1 deletion is rare and TAK1 expression is upregulated in developed HCC patients
We first analyzed the mutation status and expression of TAK1 in silico using The Cancer Genome Atlas (TCGA) database, Gene Expression Omnibus (GEO) dataset [GSE14520[20]], and our own data set [Sir Run-Run Shaw Hospital (SRRSH)]. We observed that TAK1 deletion is rarely found in HCC patients (6/366) not to mention missense mutation (3/366) with unknown function in TCGA dataset (Fig.1A). But messenger RNA (mRNA) expression of TAK1 was significantly elevated in human HCC tissues as compared with non-tumorous livers (Fig.1B). Moreover, analysis of GSE6764[21] dataset revealed that TAK1 expression was already upregulated in very early HCC and tended to increase with HCC progression (Fig.1C). We also observed ranging TAK1 protein level among different HCC cell lines, almost all of which exhibited higher TAK1 expression than that in normal liver cells (Figure 1D). Survival analysis of TCGA dataset showed that TAK1 expression was negatively corelated with overall survival (OS) and disease-free survival (DFS) of HCC patients (Fig.1E). Moreover, SRRSH set analysis revealed the similar results (Fig. 1E). To address the role of TAK1 in HCC patients, we carried out Gene Set Enrichment Analysis (GSEA) using TCGA data and revealed that high TAK1 expression was positively correlated with a series of upregulated gene sets in HCC and was negatively correlated with those downregulated in HCC (Fig. 1F). Taken together, these data suggested that although artificial TAK1 deletion leads to HCC initial, TAK1 functions as a tumor promoter in developed HCC and is a potential prognostic marker of HCC patients.
TAK1 suppression inhibits clonogenicity, proliferation and oncogenic signaling in HCC
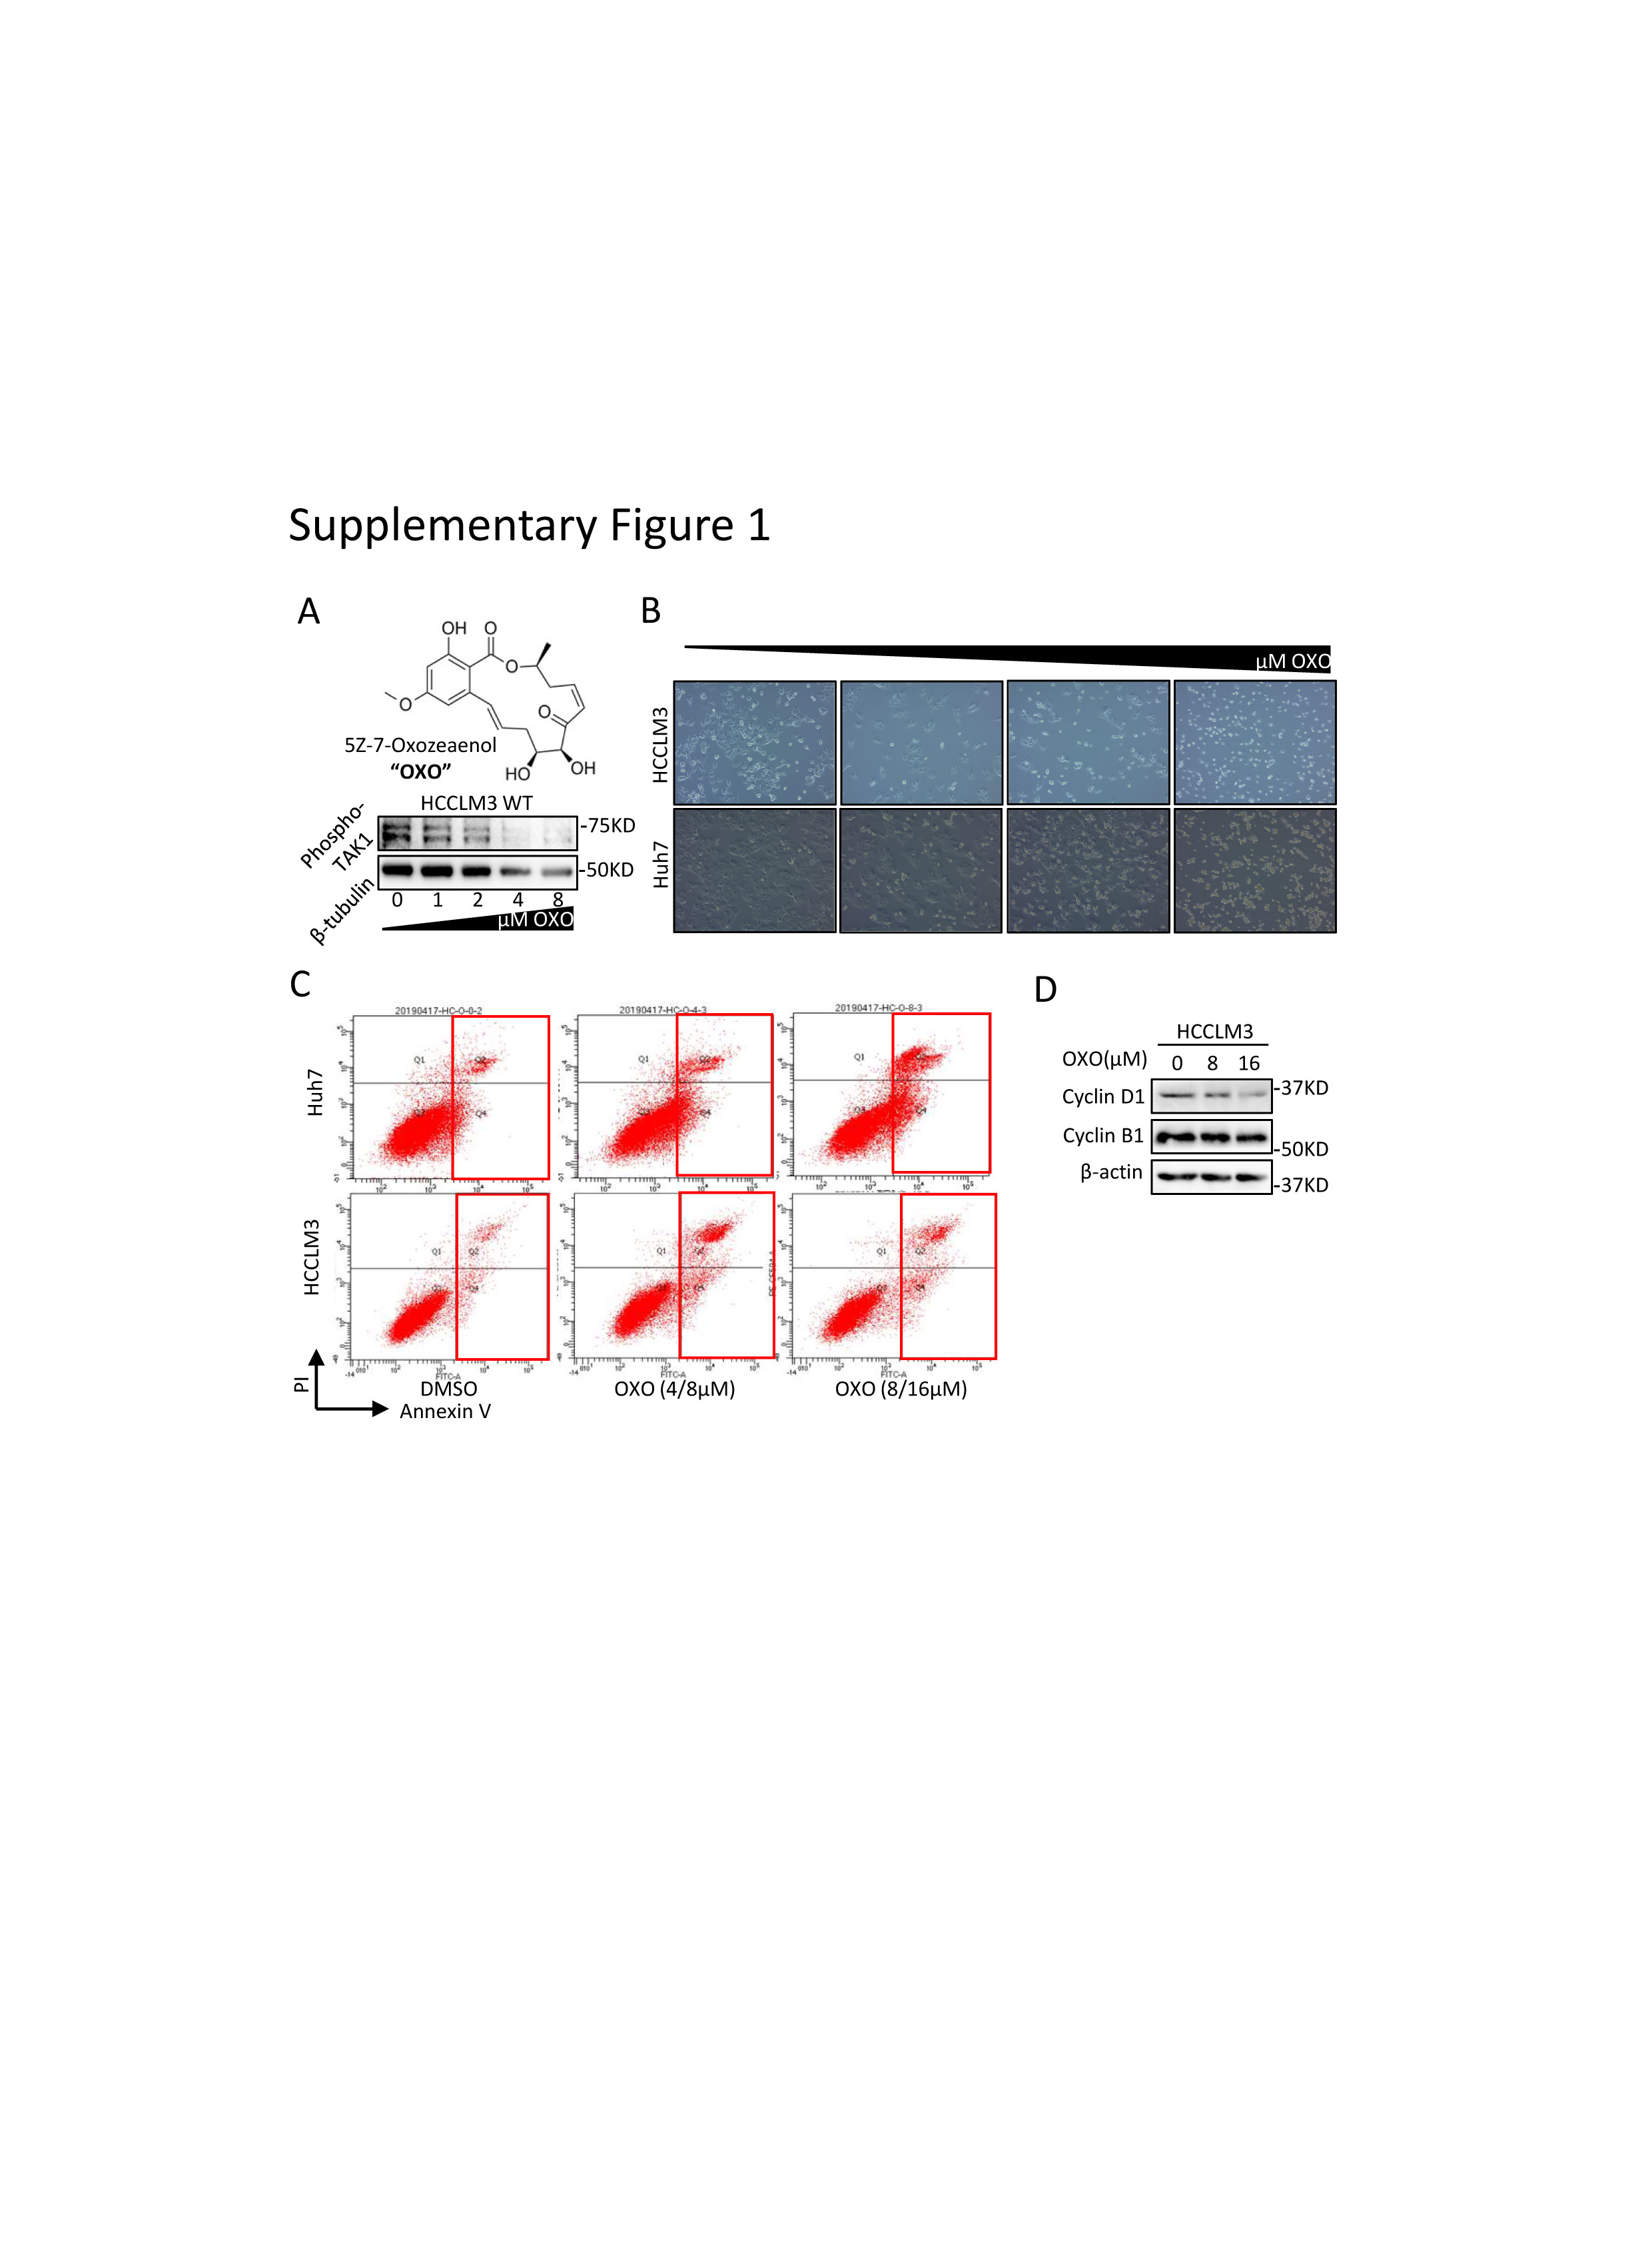
To better address the functions of TAK1 in HCC, we carried out experiments to determine the functional impact of TAK1 in Huh7 and HCCLM3 cell lines. Genetic knockdown of TAK1 by specific small interfering RNA (siRNA) and pharmacological inhibition of phospho-TAK1 by 5z-7-oxozeaenol (OXO)[22, 23] both strongly induced apoptosis in these two cell lines, with increased Annexin V-stained apoptotic cells and accumulated floating cell fragments(Fig.2A; Supplementary Fig.1A-C). In addition, TAK1 suppression also caused cell cycle arrest in G1 phase and inhibited clonogenicity of HCC cells (Fig.2B-C). Moreover, TAK1 suppression inhibited cell proliferation in most HCC cell lines (Fig.2D). TAK1 was known to boost NF-κB phosphorylation and its transcriptional activity[12], which mediates the transcription of numerous pro-survival and anti-apoptosis signals in HCC.[24] Therefore, we tested the mRNA expression of NF-κB targets through quantitative polymerase chain reaction (qPCR) and the results showed lower expression of Bcl-2,an anti-apoptosis regulator, and higher expression of GADD45B, a DNA damage inducer, upon OXO treatment (Fig.2E). TAK1 activates multiple oncogenic signals, which were known to be critical players in HCC tumorigenesis. Indeed, OXO treatment or TAK1 knockdown significantly reduced the protein expression of phosphorylated ERK, phosphorylated AKT, phosphorylated mTOR, phosphorylated Rb, and cyclin D1 but not cyclin B1 (Fig.2F-G; Supplementary Fig.1D). Altogether, TAK1 suppression induced cell cycle arrest and cell apoptosis in HCC cells and inhibited clonogenicity, proliferation and oncogenic signaling in vitro, indicating TAK1 a potential target for developed HCC.
TAK1 expression can be reduced by targeted drugs and is retained in sorafenib-resistant cell lines
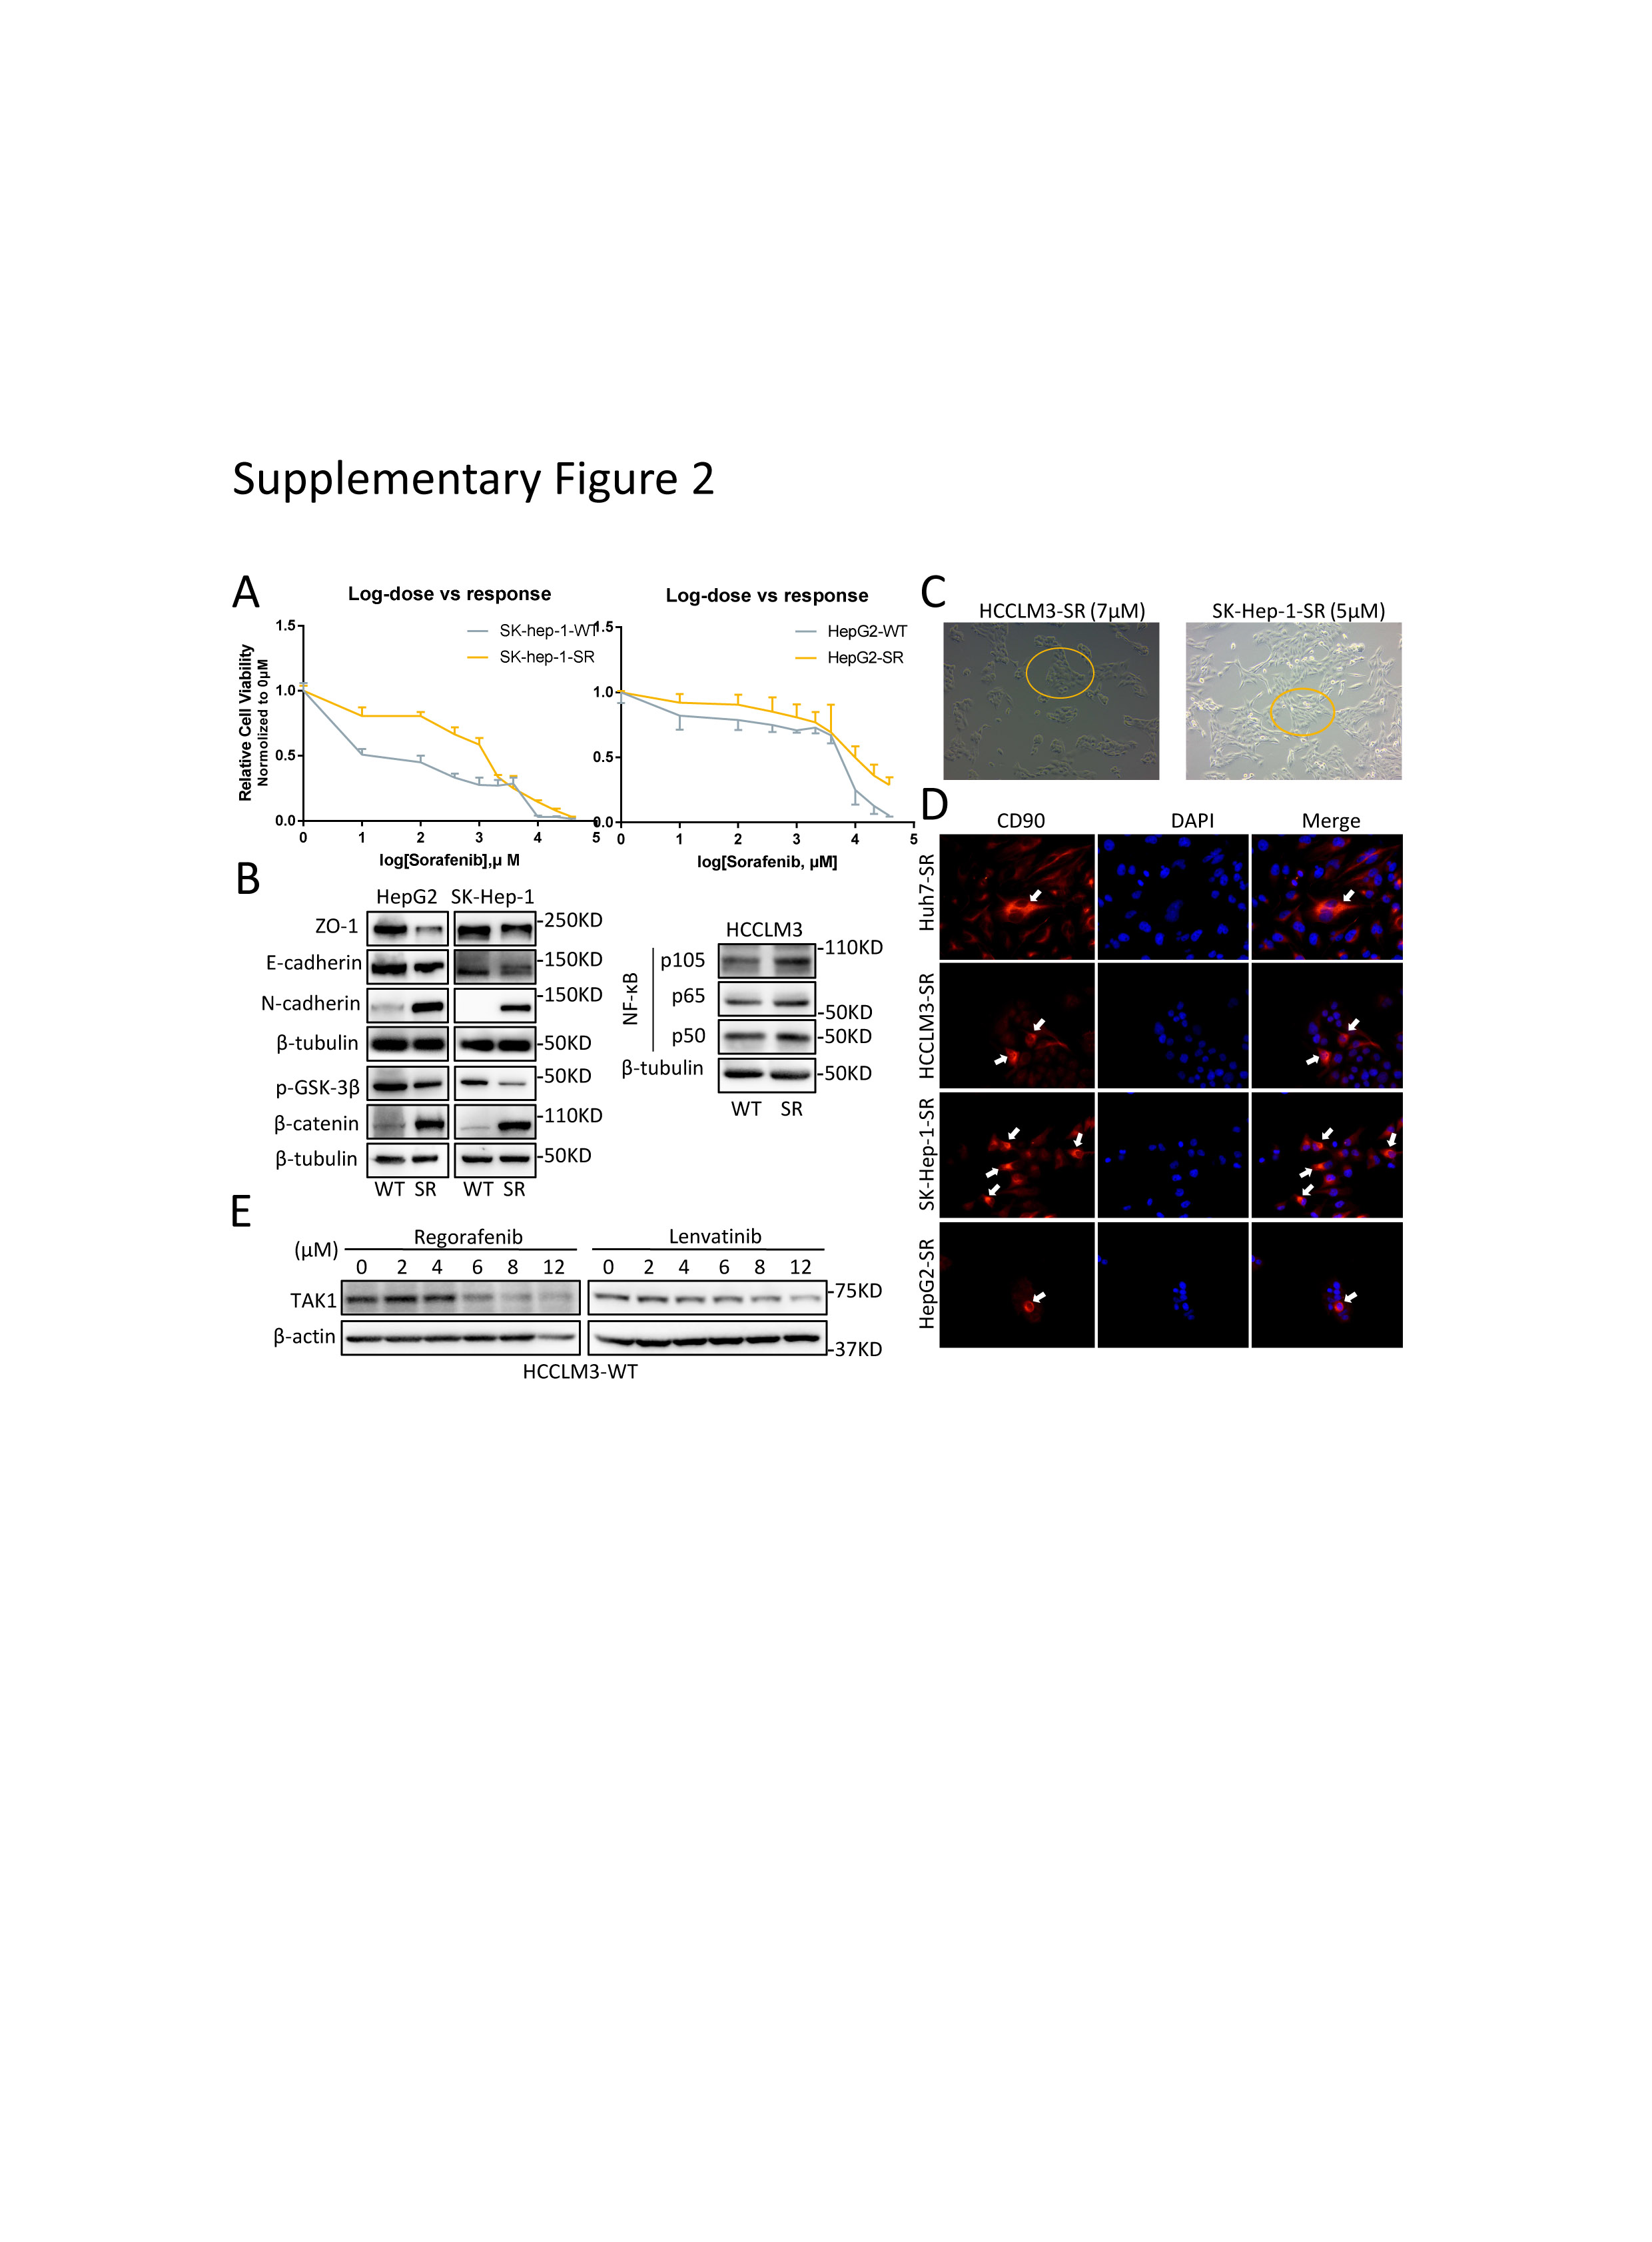
To unravel the role of TAK1 in sorafenib resistance, we established stable sorafenib-resistant (SR) models of normal HCC cell lines (Huh7, SK-hep-1, HepG2, and HCCLM3), following the instruction in previous study.[6, 25] The sorafenib resistance was determined by that the IC50 shift towards a higher concentration in all the resistant cell lines compared to the parental cell lines (Fig. 3A; supplementary Fig.2A). The colony formation assays also showed that SR cells are more proliferative under sorafenib treatment (Fig.3B). Both primary and second drug resistance are mainly attributed to tumor heterogeneity.[26, 27] In many tumor entities including HCC, therapy-induced evolving are achieved through epithelial-to-mesenchymal transition (EMT) and cancer stemness acquisition.[28-30] Therefore, we first characterized the mesenchymal state and stemness features in SR cell line models. As expected, we observed profound morphological changes in SR cells transforming into spindle-like shape under an electron microscope (Fig.3C), indicating that SR cells were undergoing EMT process, which was one of the well-known underlying mechanisms of sorafenib resistance.[31] The EMT status in SR cells was further characterized by loss of ZO1 and gain of mesenchymal markers such as N-cadherin, although the expression of another epithelial marker E-cadherin was not consistently changed among four SR cell lines (Fig.3D; supplementary Fig.2B). Unlike other studies,[25] the SR cells we build tend to cluster together rather than being separated from each other, especially under sorafenib treatment, and this might be attributed to the retain of E-cadherin to maintain cell-to-cell contacts (supplementary Fig 2C). These features might also be explained by the existence of intermediate EMT states and multifunction of E-cadherin according to recent advances in research.[32, 33] Given that gain of stemness improves drug tolerance of normal tumor cells,[26] we examined the stem features of SR cells by CD90 staining, a stemness marker. Expectedly, CD90 positive SR cells were enriched in the center of normal SR cell clusters (supplementary Fig 2D), suggesting that some of SR cells acquired stemness traits and became the origin of sorafenib resistance. Oncogenic pathways activation and intracellular signaling compensation upon drug treatment are important layers of HCC progression and sorafenib resistance.[34] Indeed, we revealed higher pERK, pAKT and β-catenin expression in SR cells, indicating activation of MAPK, PI3K/AKT, and Wnt pathways in sorafenib resistance (Fig.3D-E).
Next, we detected the TAK1 expression in SR cells compared to the parental cells, and observed significant higher protein level of TAK1 in SR cells (Fig 3F). We also stained the TAK1 protein in tumor samples from 59 HCC patients that received surgery prior to sorafenib treatment. Further Kaplan–Meier survival analysis revealed that HCC patients with higher level of TAK1 expression had a shorter OS and DFS (Fig.3G). Taken together, these data indicated that TAK1 was involved in the development of sorafenib resistance and its level predicts sorafenib response in HCC patients. Interestingly, upon sorafenib treatment, the protein level of TAK1 decreases as the concentration increases in the parental HCC cells but decreases more slowly in SR cells (Fig.3H). Such TAK1 protein decreases could also be observed upon Regorafenib or Lenvatinib treatment (supplementary Fig 2E). These suggested TAK1 a direct or indirect target of targeted drugs. Indeed, one study reported that TAK1 mediated sorafenib-induced hand-foot skin reaction. [35] More importantly, it also indicated that unknown mechanism mitigated the inhibitory effect of sorafenib on TAK1 expression in SR cells.
FBXW2 E3 ubiquitin ligase targets TAK1 for ubiquitination and degradation
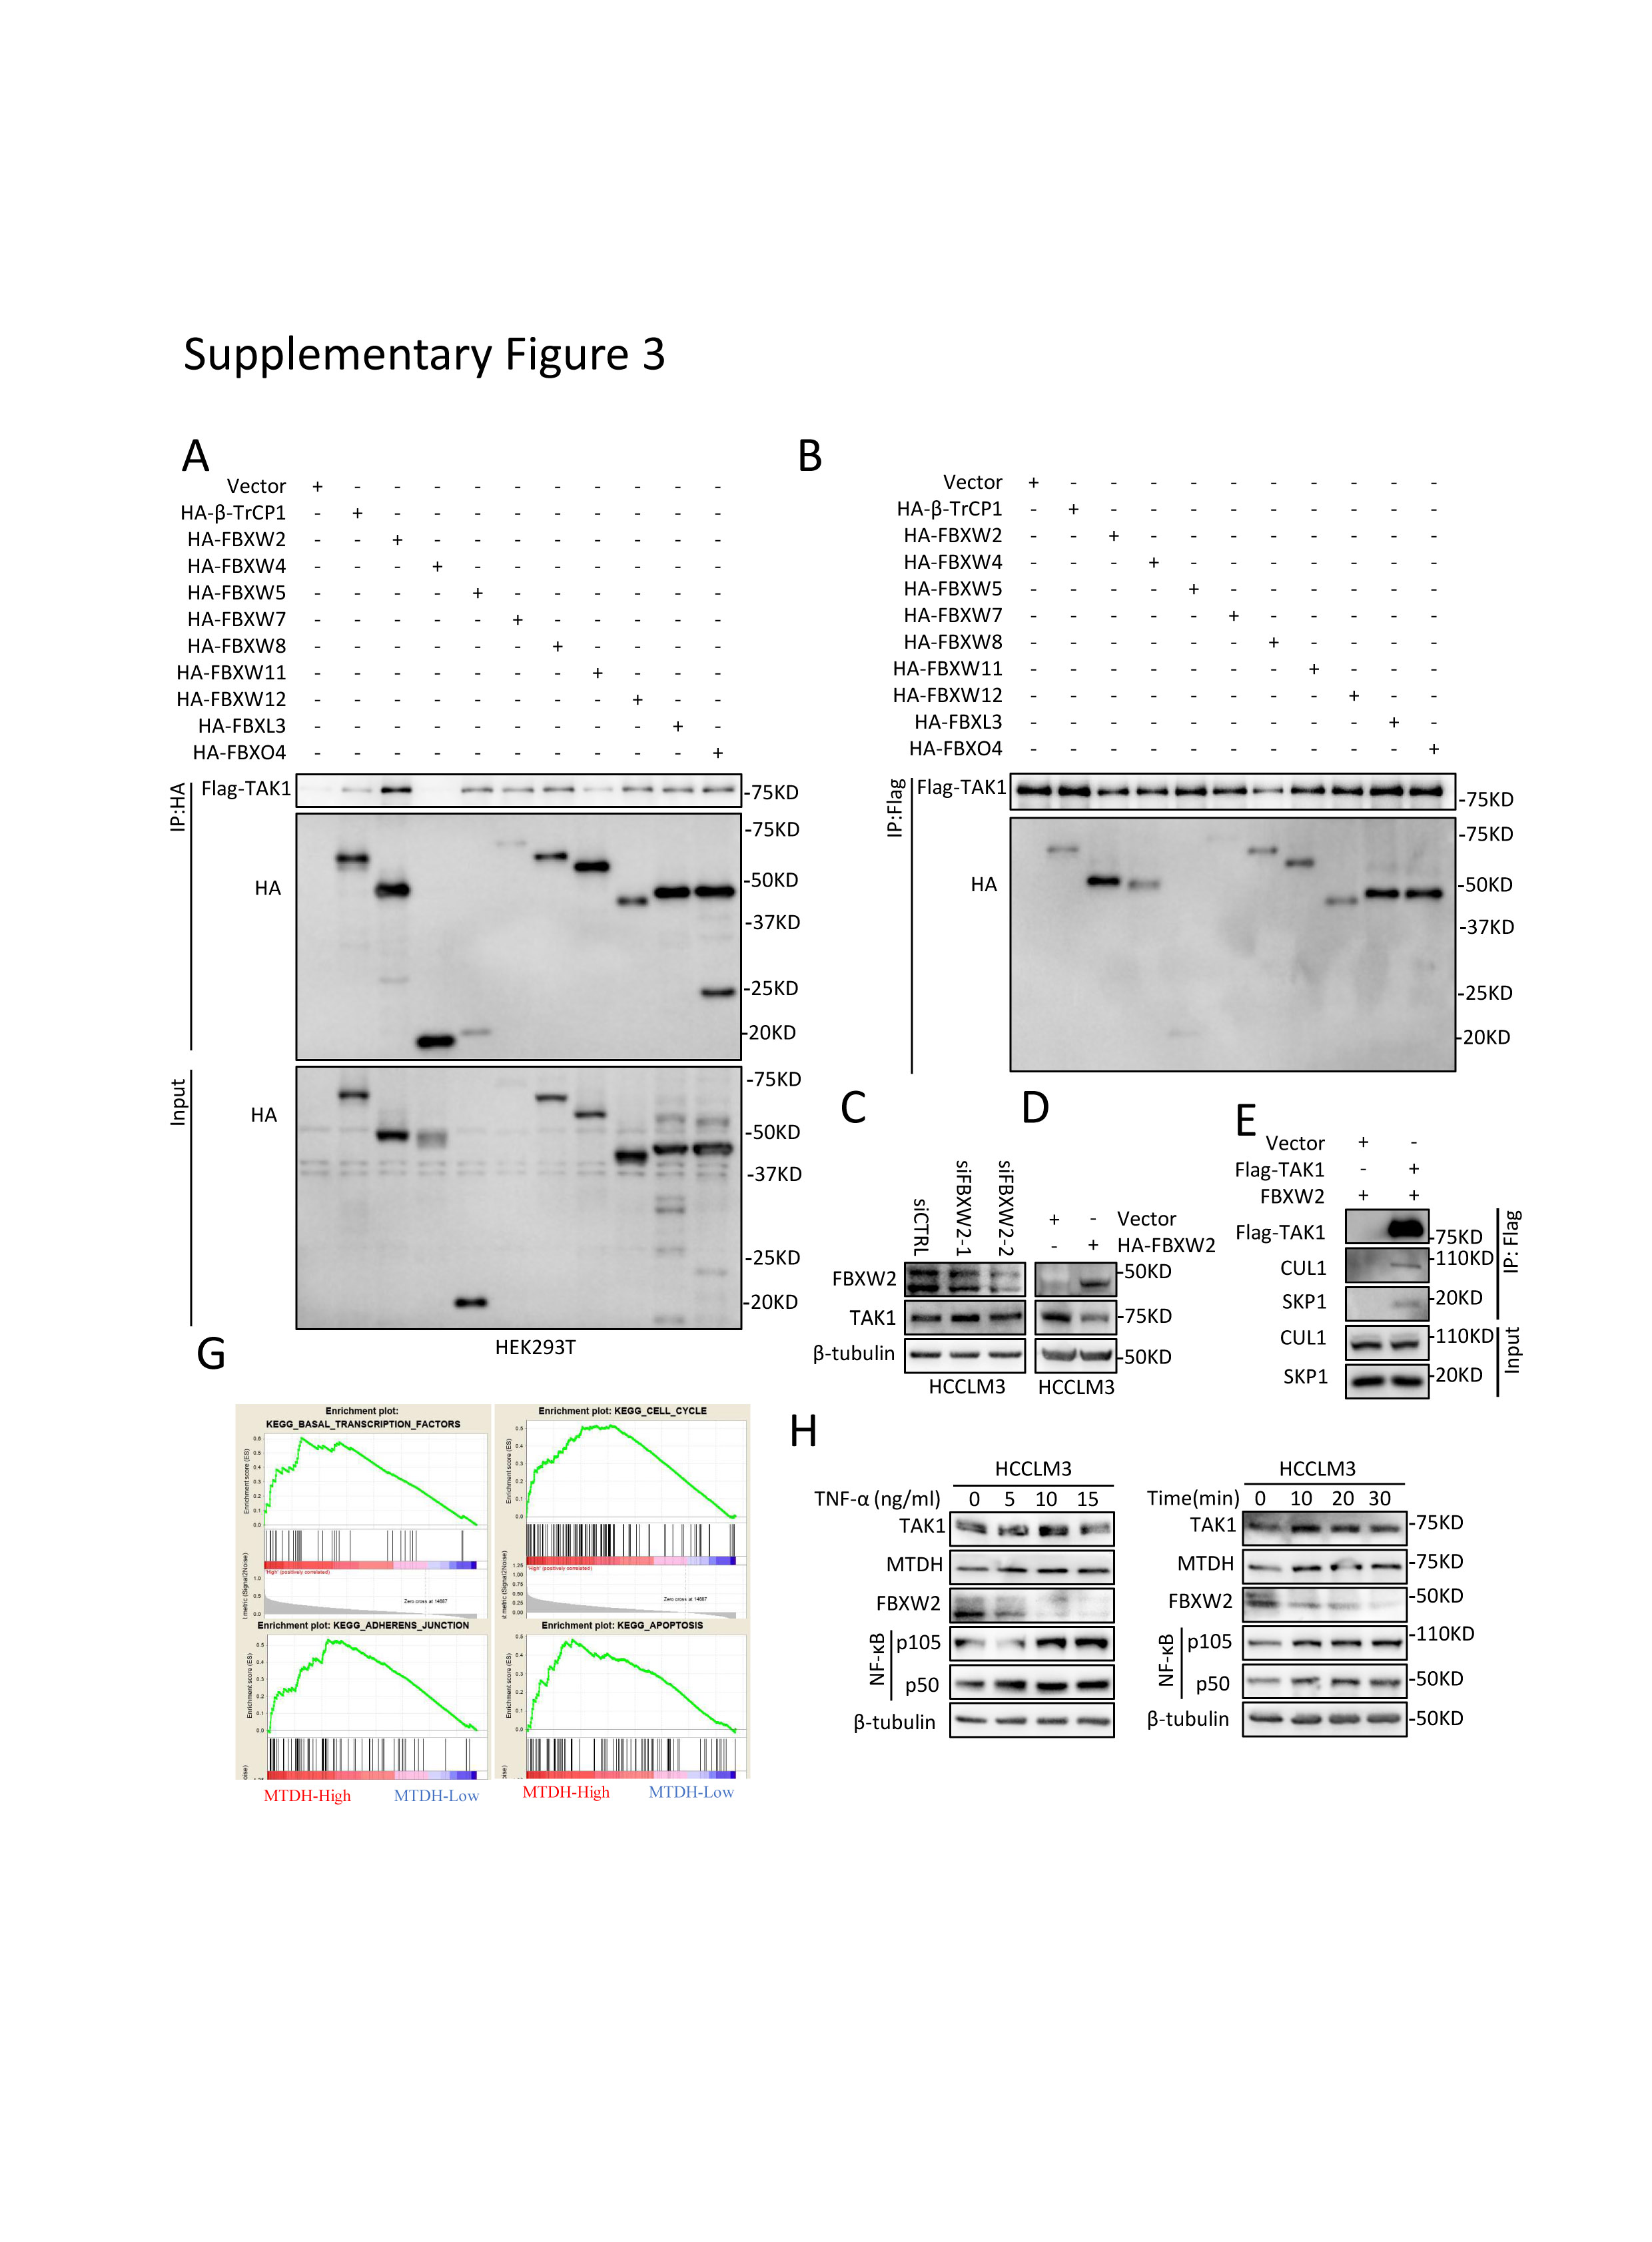
To uncover the regulatory mechanism of TAK1 expression in SR cells, we first detected mRNA level of TAK1 and observed no consistently significant changes between SR cell lines and their parental cells (Fig.4A). Further, chlorhexidine (CHX) assay indicated that the TAK1 protein degradation was retarded in SR cells (Fig.4B). As discussed above, K48-linked poly-ubiquitination and degradation of TAK1 are largely unknown. F-box proteins are components of SKP1–cullin 1–F‑box protein (SCF) E3 ligase complexes and have pivotal roles in multiple cellular activities.[36] However, none of F-box proteins have been proved to mediate TAK1 degradation. F-box proteins bind short, defined degradation motifs in substrates.[37] Regarding FBXW2 of which the substrates remains largely unknown, the consensus degron sequences defined as TSXXXS was required for its binding to substrates such as SKP2.[38, 39] Interestingly, we identified such motif in TAK1 which is evolutionarily conserved (Fig.4C), suggesting TAK1 a potential substrate of FBXW2. Notably, it was found that FBXW2 protein expression was downregulated in SR cells compared to parental HCC cells (Fig.4D). Following this lead, we first used immunoprecipitation (IP) pull down and identified in vitro interaction between FBXW2 and TAK1 (Fig.4E). We also ectopically expressed a variety of F-box proteins including FBWX2 followed by IP assay and found that FBXW2 is not the only F-box proteins that could bind to TAK1 but has the highest immunoprecipitation affinity of TAK1 (supplementary Fig 3A-B). Next, we assessed the effect of FBXW2 on TAK1 level. Indeed, FBXW2 knockdown increased the levels of total TAK1 protein, while FBXW2 overexpression reduced them, which could be reversed by MG132 or MLN4924, a NEDD8-activating enzyme inhibitor that inhibits the neddylation of the Cullin subunits of Cullin RING E3 ligases (Fig.4F; supplementary Fig 3C-D). These data together with the existence of SKP1 and CUL1 protein in TAK1 immunoprecipitants (supplementary Fig 3E), suggested that FBXW2 regulated TAK1 protein level through SKP1-CUL1-FBXW2 complex. Indeed, FBXW2 promoted TAK1 K48-linked polyubiquitylation and shortened its protein half-life (Fig.4G-H). Immunofluorescence analysis suggested that TAK1 and FBXW2 were colocalized in cytoplasm (Fig.4I). Taken together, we identified FBXW2 as a new E3 ubiquitin ligase targeting TAK1 for K48-linded polyubiquitylation and degradation.
MTDH regulates TAK1 at protein level through promoting FBXW2 mRNA degradation
MTDH has been regarded as a diver oncogene in HCC.[40] TAK1 and MTDH function similarly in tumor progression and therapy resistance, activate common downstream pathways, and response to similar intra- or extra cellular stimuli according to recent researches. [7, 19] However, the relationship between MTDH and TAK1 is unknown. Gene Set Enrichment Analysis (GSEA) using TCGA data revealed that MTDH expression was closely related to the regulation of transcription factor activity, cell cycle, apoptosis, mTOR pathways, TGFβ pathway, and so on (Supplementary Table 1; supplementary Fig.3G), consistent with previous studies.[41-43] It is possible that TAK1 could be regulated by MTDH in the HCC progression and sorafenib resistance. We first altered the MTDH levels to examine its effect on TAK1 level. MTDH knockdown significantly reduced TAK1 protein expression, while the mRNA levels of TAK1 were not consistent among four HCC cell lines (Fig.5A-B), indicating that post-translational regulations were involved. Indeed, further mechanistic dissection demonstrated that MTDH knockdown could accelerate the protein degradation of TAK1 (Fig.5C).
Importantly, the Top 3 GSEA defined gene sets presented that MTDH was highly involved in RNA degradation and ubiquitin-mediated proteolysis (Fig.5D). Several researches had implied that MTDH acted as an RNA-binding protein (RBP).[44-46] Also illustrated was the decreased mRNAs that could bind to MTDH including a large amount of E2 and E3 ubiquitin ligases such as FBXW2 upon a dual PI3K/mTOR inhibitor treatment.[44] This indicates that MTDH could accelerate the degradation of these mRNAs in response to drug stimuli. Yet, the role of MTDH in RNA stability or translation are not known. We thus detected the mRNA expression of those E2 and E3 ligases upon MTDH knockdown and found that the decrease of MTDH expression increased their mRNA level (Fig.5E). Regarding FBXW2, MTDH knockdown also increased its protein level in HCC cells. (Fig.5F). Thus, we hypothesized that MTDH regulates K48-linked poly-ubiquitination and degradation of TAK1 through downregulating its E3 ubiquitin ligase FBXW2. We found that MTDH overexpression partially recued TAK1 protein level and reduced K48-polyubiquitylation upon FBXW2 transfection (Fig.5G), suggesting FBXW2-mediated TAK1 degradation could be mitigated by MTDH. RNA-immunoprecipitation (RIP) revealed much higher MTDH-bound FBXW2 mRNA compared to IgG, suggesting the specific association of FBXW2 mRNA and MTDH (Fig.5H). Immunofluorescence and fluorescence in situ hybridization (FISH) assay for MTDH protein and FBXW2 mRNA also showed that FBXW2 mRNA overlapped with those MTDH localized at cytoplasm (Figure.5I).
Tumor necrosis factor alpha (TNF-α)/NF-κB pathway plays important role in the development of inflammation-driven HCC including viral hepatitis-related and NASH- or NAFLD-related HCC.[47] Recent study also indicated that TNF-α might serve as a predictor of sorafenib response in HCC patients.[48] Given that MTDH and TAK1 both activate NF-κB signaling, we treated HCC cells with TNF-α. Results showed TNF-α treatment increased MTDH and TAK1 protein expression, as well as decreased FBXW2 protein level in a time course and a dose-dependent manner (supplementary Fig.4H). These findings indicate that MTDH/FBXW2/TAK1 might mediate TNF-α-promoted HCC progression and sorafenib resistance. In summary, MTDH regulates TAK1 protein level through binding to and subsequently degrade FBXW2 mRNA.
MTDH promotes HCC and sorafenib resistance
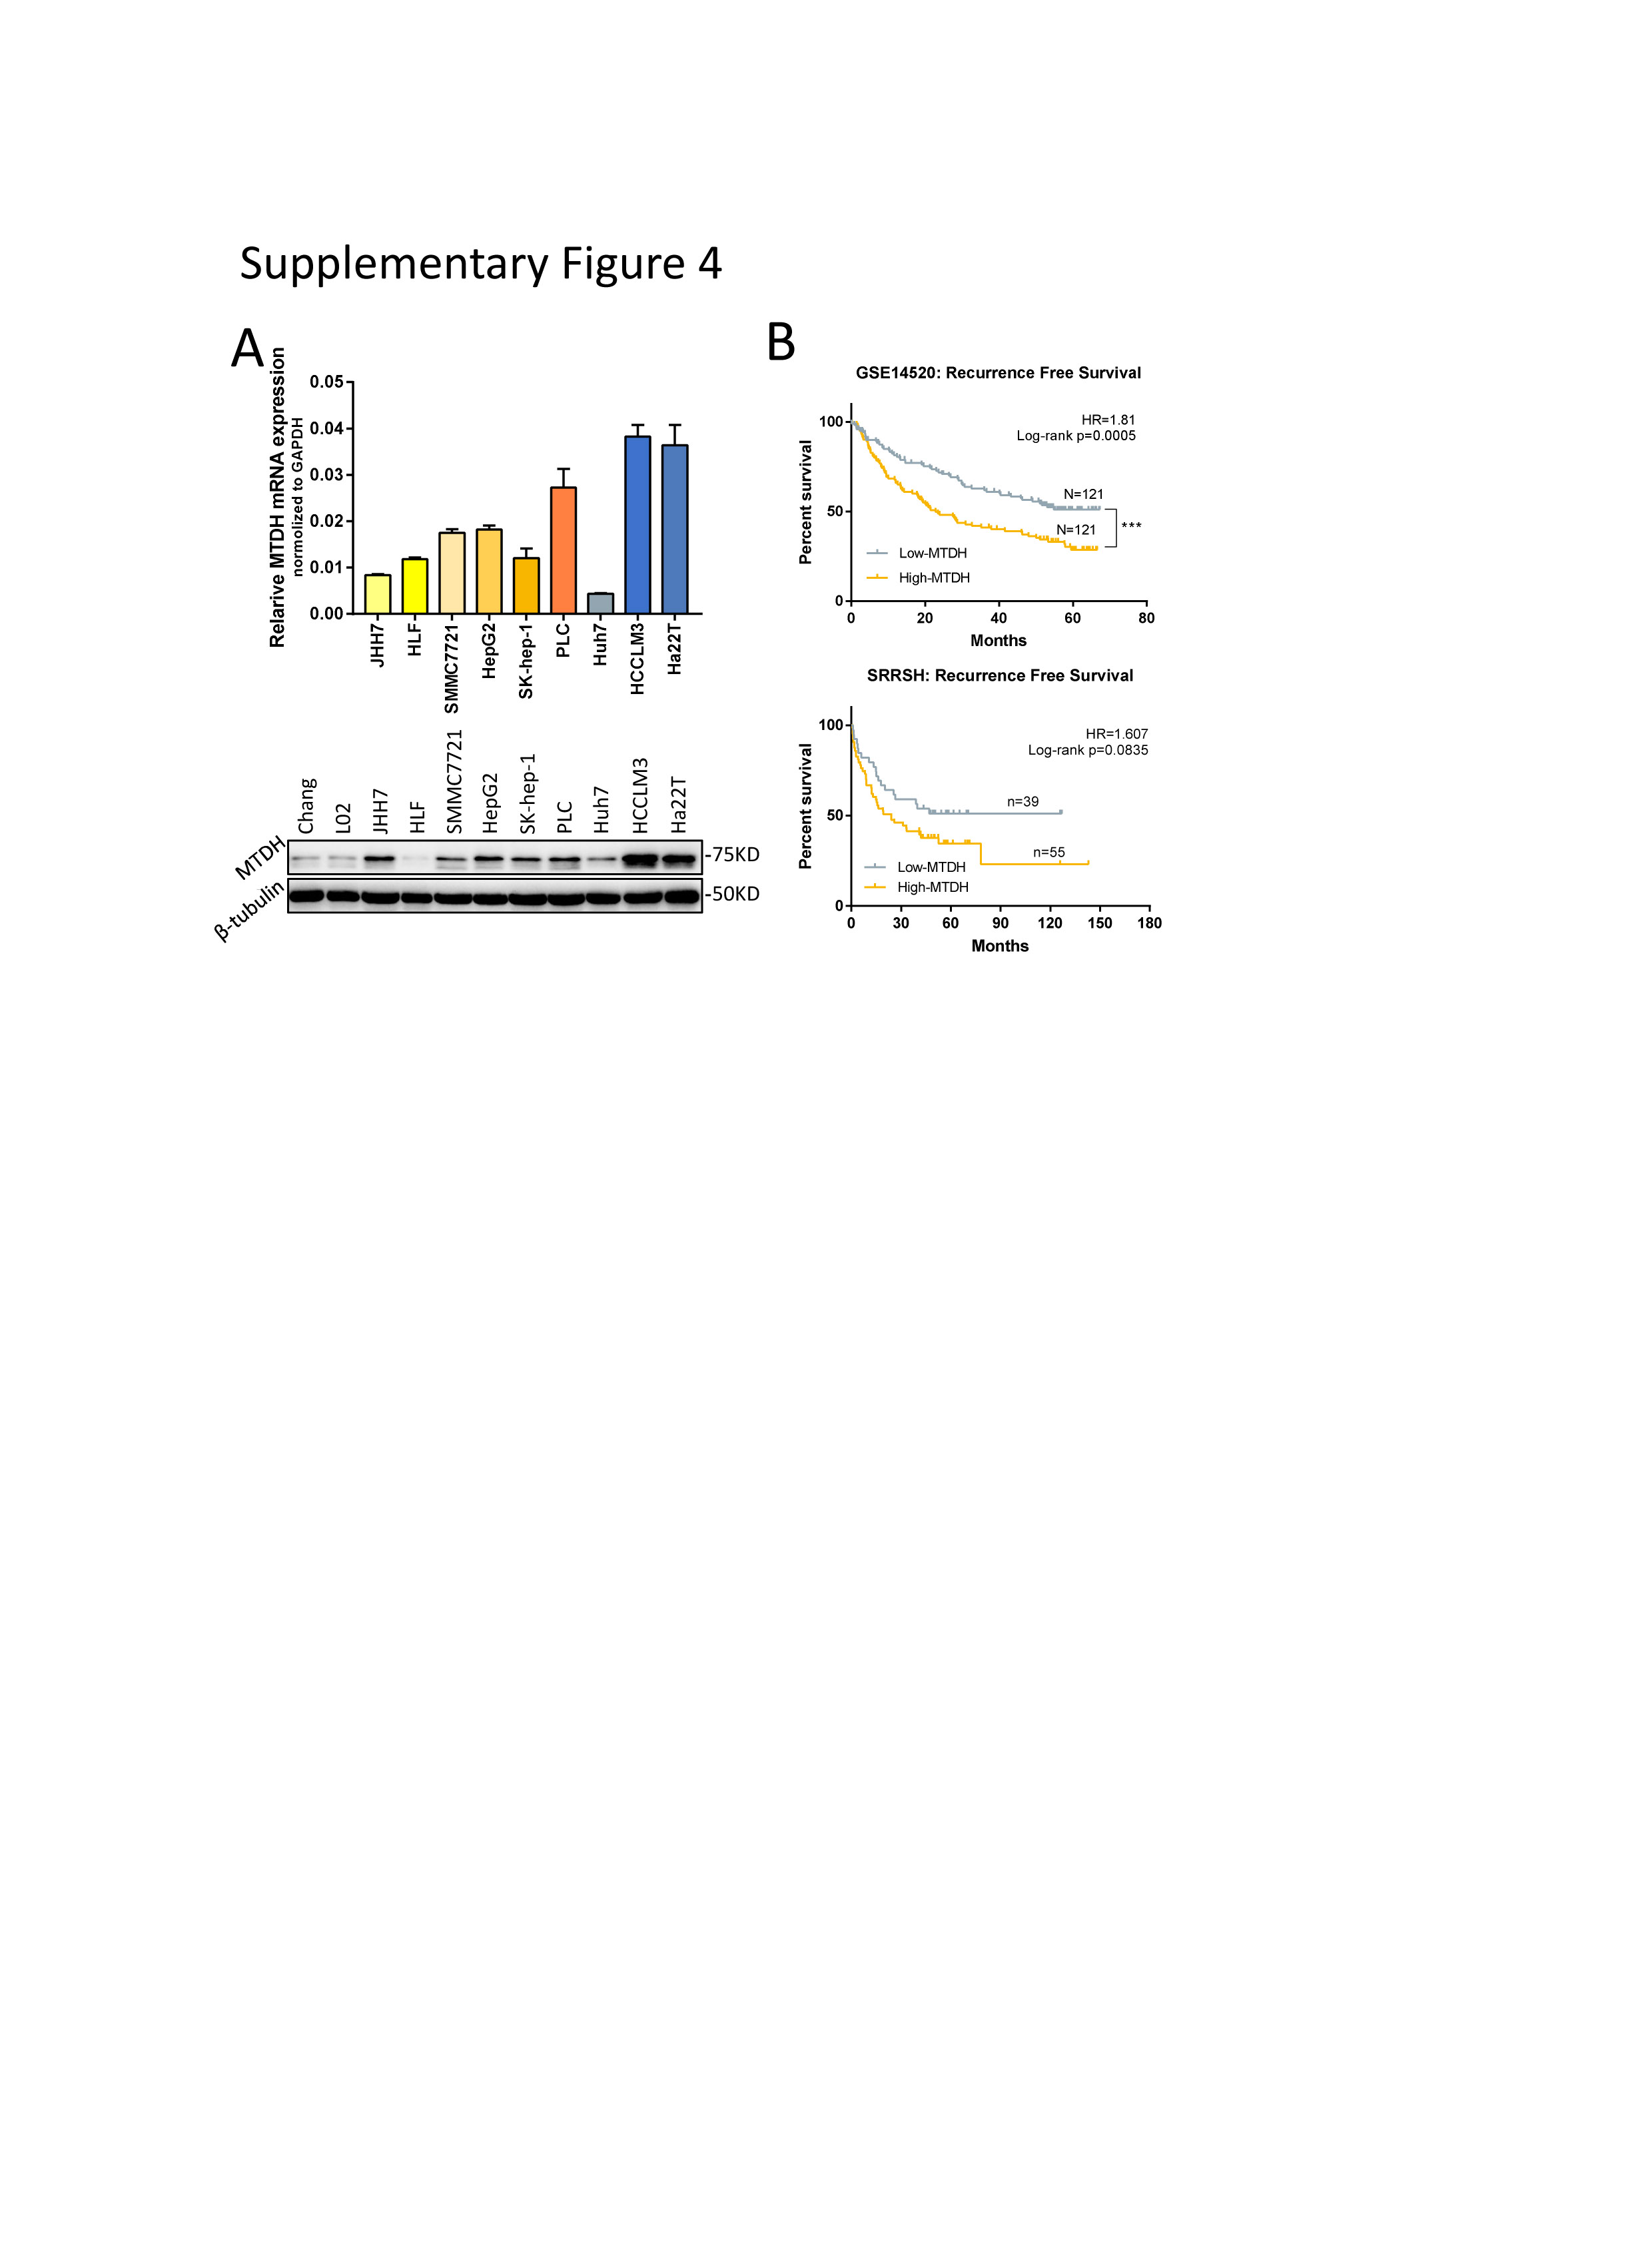
Next, we aim to elucidate the function of MTDH in HCC and sorafenib resistance and whether TAK1 mediates these functions. Similarly, in silico analysis revealed elevated mRNA expression of MTDH in human HCC tissues as compared with non-tumorous livers (Fig.6A), which was attributed to amplified somatic copy numbers of MTDH that were consistent with the protein level according to IHC scoring in HCC patients (Fig.6B-C).[40] In addition, MTDH mRNA was increasing from very early HCC to very advanced HCC according to GSE6764 (n=75) dataset (Fig.6D), suggesting that MTDH was involved in progression and aggressive phenotype of HCC. We also observed higher MTDH mRNA and protein expression in most HCC cells than that in normal liver cells (Supplementary Fig.4A). Survival analysis based on MTDH mRNA level in GSE14520 and SRRSH dataset indicated that high expression of MTDH predicts worse OS and DFS or RFS (Fig.6E; Supplementary Fig.4B). MTDH has been widely proved to be involved in chemotherapeutics resistance,[19] however, its role in targeted therapy sensitivity remains unknown. We then detect the expression of MTDH in our SR cell models and observed significantly higher protein and mRNA levels of MTDH in SR cells (Fig.6F). Of note, among the HCC patients with sorafenib treatment after surgery, those with higher MTDH expression had significantly worse OS and DFS compared to those with lower MTDH expression (Fig.6G), indicating an important role of MTDH in sorafenib resistance of HCC.
TAK1 mediates MTDH-induced sorafenib resistance
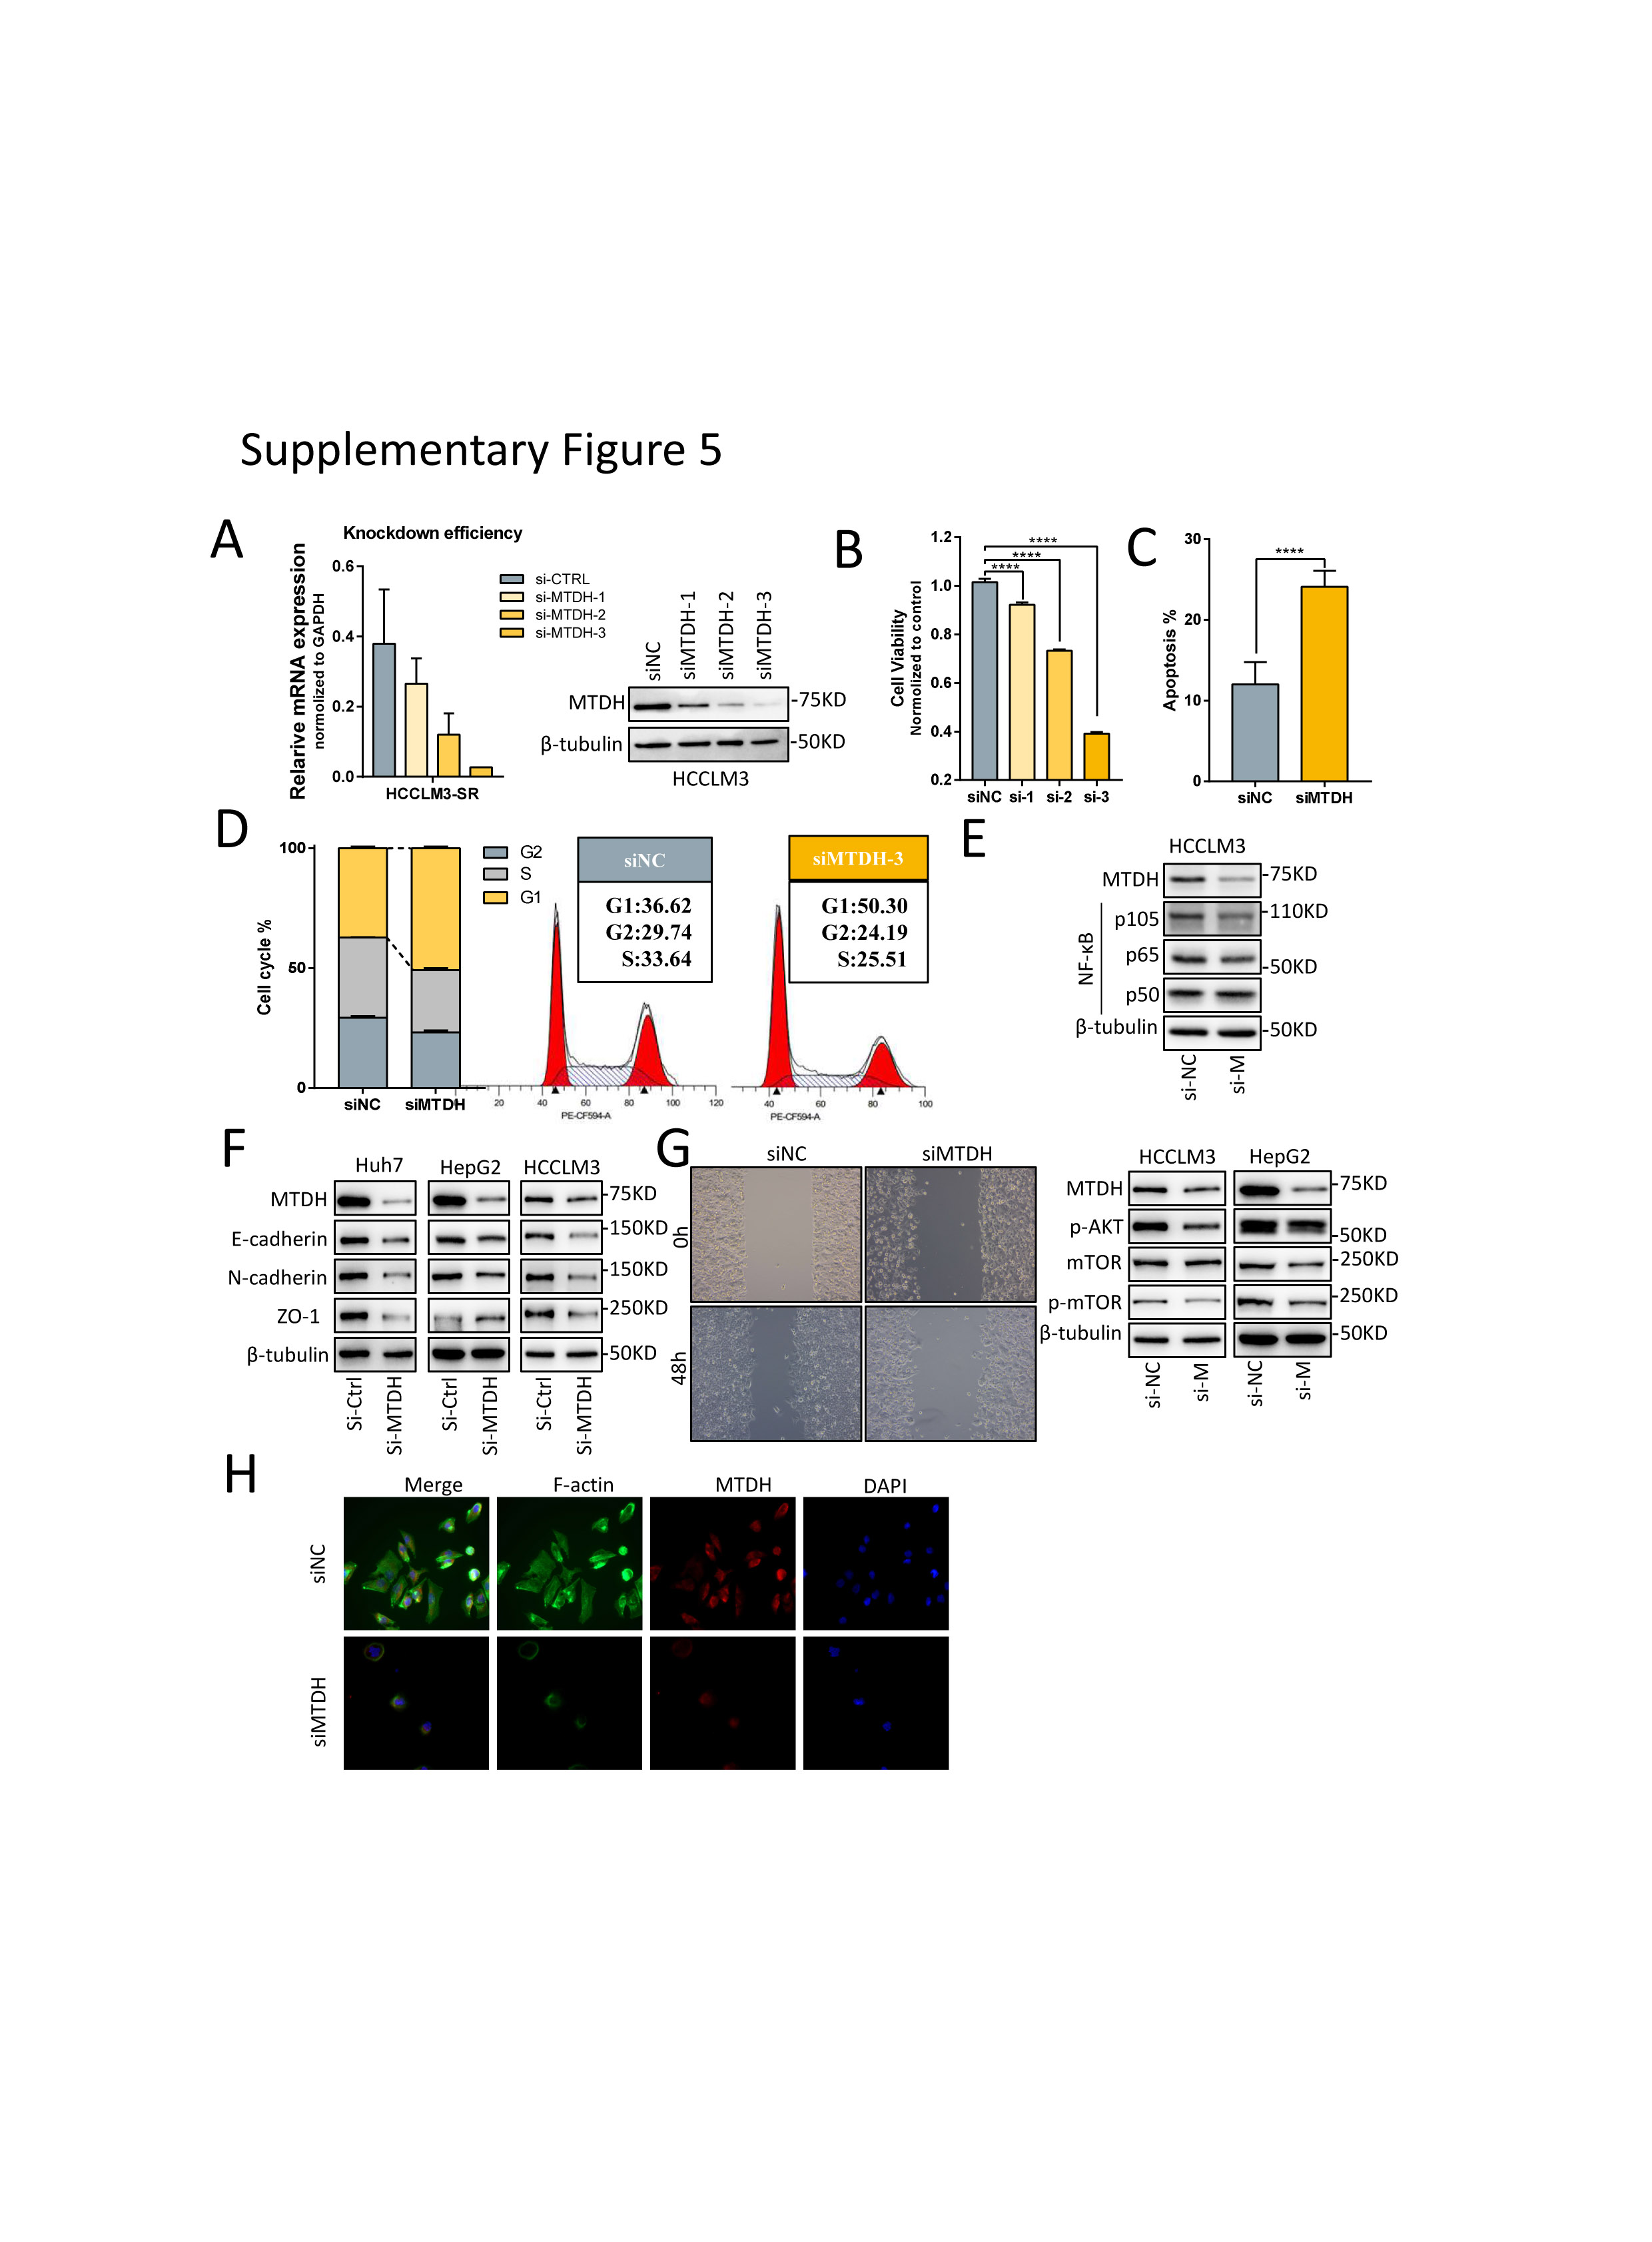
To verify the role of MTDH in HCC and targeted-therapy resistance, we carried out functional experiments and revealed that MTDH knockdown by three siRNAs inhibited proliferation of HCC cells and the third siRNA performed best according to the decrease in cell viability, as well as the knockdown efficiency (Supplementary Fig.5A-B). Knockdown of MTDH also induced apoptosis and cell cycle arrest in G1 phase of HCC cells (Supplementary Fig.5C-D). Mechanistically, MTDH suppression reduced classical oncogenic signaling such as pAKT, p-mTOR, and NF-κB p105 (supplementary Fig.6E). We overexpressed MTDH in HCC cell lines and assessed the relationship between MTDH and the half maximal inhibitory concentration (IC50) of several targeted drugs including Sorafenib, Regorafenib, and Lenvatinib. The results showed that IC50 of these three drugs, especially sorafenib, were higher in HCC cells that stably expressing MTDH (Fig.7A). We then combined MTDH knockdown and sorafenib treatment in SR cells to further evaluate the function of MTDH in sorafenib resistance. Results showed that MTDH knockdown re-sensitized SR cells to sorafenib-induced apoptosis and inhibitory of proliferation (Fig.7B). Regarding the EMT transformation and mesenchymal state in SR cells, we found that the expression of EMT markers were significant reduced and the migratory potential of SR cells were inhibited upon MTDH suppression (Supplementary Fig.6F-G). Furthermore, phalloidin staining analysis revealed that MTDH knockdown curbed SR cell stretching via inhibiting actin remodeling and subsequent cell-to-cell contacts (Supplementary Fig.6H).
As presented above, we found that MTDH could regulate TAK1 protein level through binding to and subsequently degrade FBXW2 mRNA. Next, we aim to explore whether TAK1 is involved in MTDH-mediated sorafenib resistance. Consistent with previous findings, HCC cells with ectopically expressed MTDH became more resistant to sorafenib, and such resistance could be reversed by sorafenib in combination with OXO or NG-25, another TAK1 inhibitor (Fig.7C-D). These data suggested that MTDH functions as a promoter of HCC progression and sorafenib resistance and targeting TAK1 could overcome MTDH-mediated sorafenib resistance.
Targeting TAK1 overcomes sorafenib resistance in vitro and in vivo
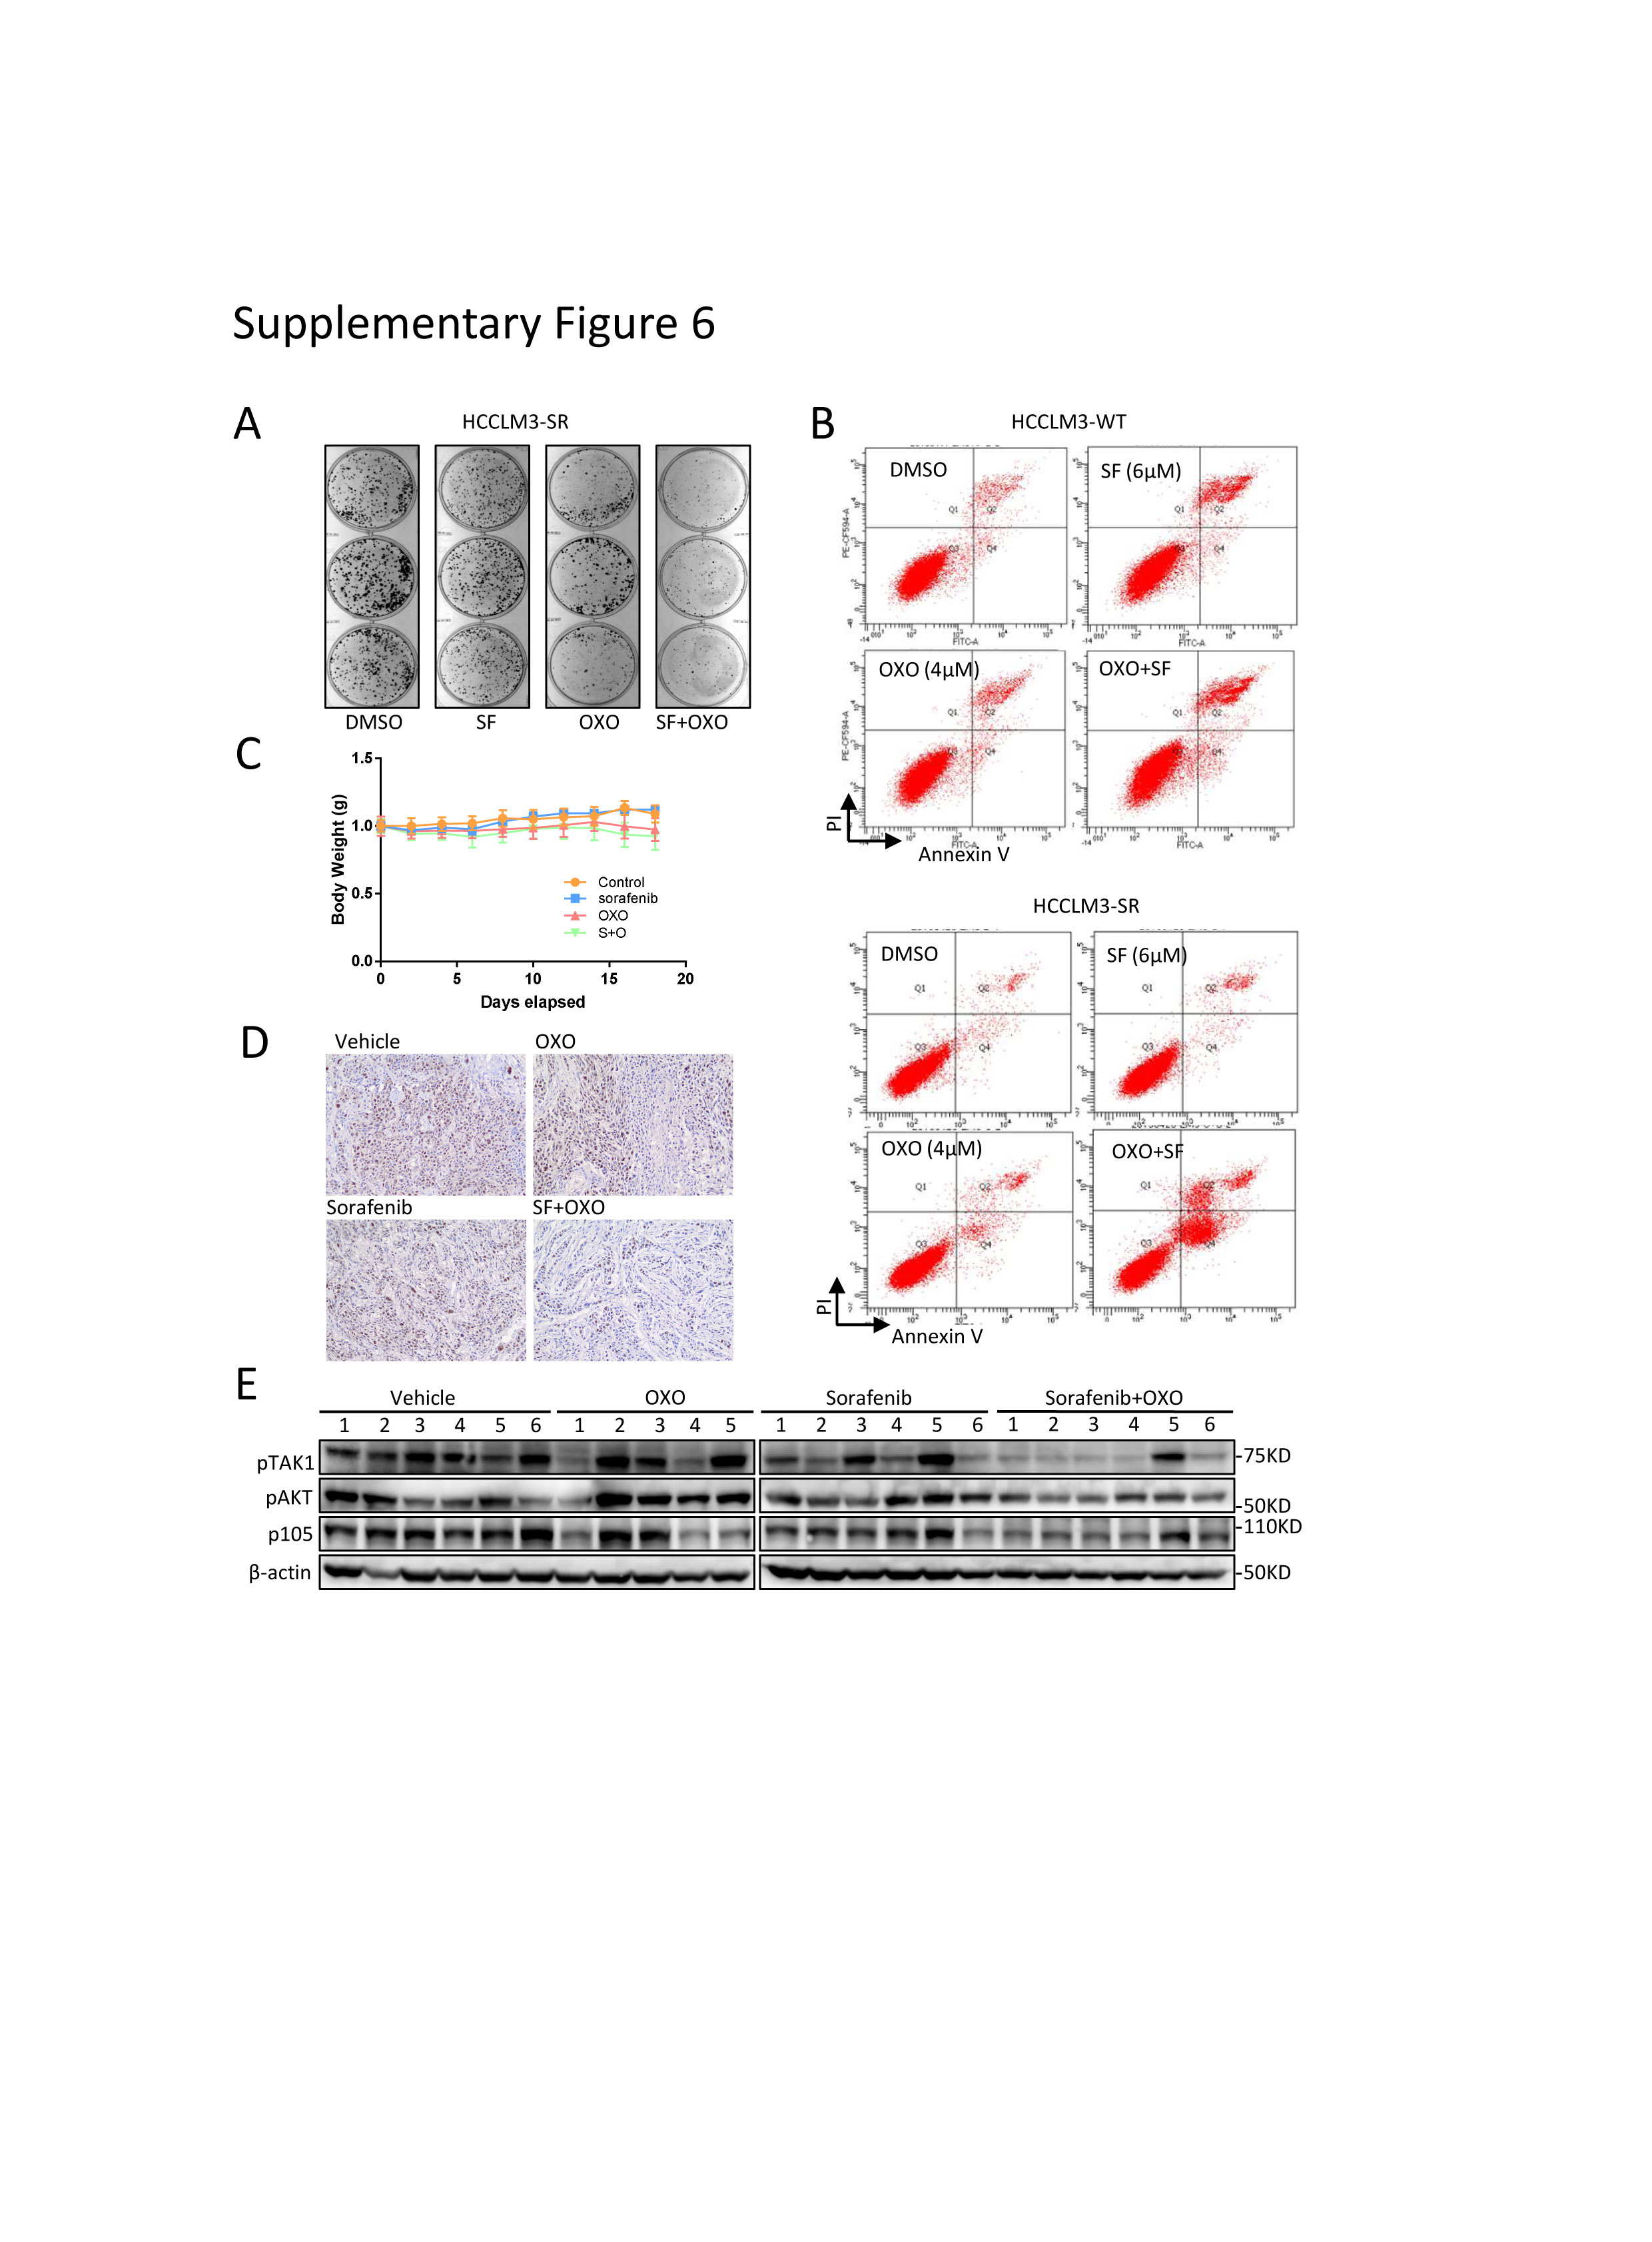
Since there are no drugs available for MTDH inhibition, targeting TAK1 might be an alternative approach to overcome MTDH-dependent or independent sorafenib resistance. Indeed, combination of sorafenib and OXO strongly inhibited its clonogenicity and proliferation compared to sorafenib or OXO treatment alone in SR cell models (Fig.7E; supplementary Fig.6A). Flow cytometry assays showed that OXO in combination with sorafenib largely increased proportion of apoptotic HCC cells and re-sensitized SR cells to sorafenib-induced apoptosis, while both sorafenib and OXO alone induced apoptosis in parental cells (Fig.7F; supplementary Fig.6B). Particularly, we used an in vivo xenograft tumor model to evaluate the combined anticancer effect of sorafenib and OXO by inoculating subcutaneously the HCCLM3-SR cells into the flank sides of nude mice, followed by treatment with vehicle control, OXO, or sorafenib alone or in combination. When used non-toxic concentrations (Supplementary Fig.6C), sorafenib or OXO alone did not suppress the tumor growth in vivo, however, significant suppression was observed in combination group in terms of tumor volumes, tumor weights, and Ki67-staining, as well as downstream oncogenic proteins (Fig.7G-H; supplementary Fig.6D-E). Thus, TAK1 inhibitors sensitized HCC SR cells to sorafenib as tested in both in vitro cell-culture and in vivo xenograft models.