Fusion transcript detection using STfusion and the poly(A) tail presence
During the correct transcription of two adjacent genes, the poly(A) tail is attached to each of the genes. The poly(A) tail serves as a proxy for the transcription level of each gene.
In the case of a fusion transcript caused by a cis-SAGe mechanism or chromosomal rearrangement, however, the poly(A) tail is absent from the 5´ gene. In this case, the 5´ gene expression level defines the fusion transcript expression. The poly(A) tail is attached to the 3´ end of the parental 3´ gene. In the proposed method, the number of sequenced poly(A) tails that can be mapped to the 3´ gene, and the absence of poly(A) tails at the 5´ gene, is used to indicate a fusion transcript. The number of poly(A) tails aligned to the 3´ gene mirrors the expression level of the fusion transcript (Figure 1).
STfusion verification in HeLa cells
In order to verify STfusion, sequenced mRNA from HeLa cancer cells were analysed. The occurrence of poly(A) tails aligned to the parental genes of experimentally confirmed fusion transcripts was tracked (Tables 1, 2, S1-S11).
The sequenced mRNA data produced by TAIL-seq [13], and the results published in the same paper, were used. This tool sequenced the end of the mRNA and thus includes the poly(A) tail sequence. Chang et al. [13] applied TAIL-seq to HeLa and found 4,000 genes have a poly(A) tail.
Additionally, for parental genes of the known HeLa fusion transcripts with no poly(A) tails, according to the results by Chang et al. [13], the raw RNA-seq data from the same publication were aligned and analysed in-depth. We were only interested in reads that contain a poly(A) tail sequence, which is the file that contains the second read (read 2, read length 230 bp). First, the potential poly(A) tail sequence nucleotides were removed. Second, the reads were further trimmed by 64 nucleotides (nt) to remove additional adapter sequences. The trimming was performed with Cutadapt [14]. The resulting reads were aligned with Tophat2 [15] and STAR [16] to the human assembly GRCh38 Ensembl (release 84) [17]. Uniquely mapped reads (Tophat2 mapping quality ≥ 10, STAR mapping quality = 255) were kept. Finally, reads that were aligned to a reference sequence with multiple adenine or thymine nucleotides in the direct vicinity were removed, because the eliminated sequence assumed to be a poly(A) tail is part of the genome. All reads that mapped to the 3´ UTR of the parental genes were considered (Table S12).
STfusion applied to clinical tissue samples
Spatial transcriptomics data, transcriptomic factors and activity maps
Spatial transcriptomics [18] (The Spatial Transcriptomics method, Suppl.), a novel technology, allows one to obtain expression levels throughout tissue samples while maintaining spatial information. Spatial transcriptomics opens new possibilities for the investigation of altered expression levels, especially under modified conditions (e.g., cancerous cells within tissue samples). In a recent publication, Berglund et al. [19] showed that the cells in the centre, periphery and vicinity of prostate cancer areas develop a unique expression pattern that is clearly differentiated from areas with healthy cells of a similar type. Thus, this technique can provide insights into cancer progression.
Spatial transcriptomics produces very rich expression levels data throughout a tissue sample. In order to identify hidden patterns of gene expressions that characterise cell types, spatial transcriptomics deconvolution (STD) was developed by Maaskola et al. [20]. This method, based on negative binomial regression, reveals unique expression profiles across tissue sections that present different cell types, microenvironments or tissue components. For each identified expression profile, i.e., transcriptomic factor, the method provides a spatial activity map that represents where the transcriptomic factor is active in the tissue sample. For example, the transcriptomic factor that represents “cancerous epithelial” cells exhibits a unique expression pattern that reveals genes strongly or differentially expressed compared to another transcriptomic factor. The activity map for the transcriptomic factor “cancerous epithelial” shows where the expression pattern is active within a tissue sample.
Berglund et al. [19] applied spatial transcriptomics to 12 tissue sections obtained from a patient diagnosed with prostate cancer. The spatial transcriptomics data comprised the expression levels of 5,053 protein-coding genes in 1,007 spots in each of the tissue sections. Further, the 12 tissue sections were analysed with STD in three different joined approaches: (i) cancerous samples 1.2, 2.4 and 3.3, (ii) samples 3.1 and 4.2 with inflamed and early-state cancerous areas, and (iii) the 12 tissue sections joined. The spatial transcriptomics data, STD transcriptomic factors and activity maps were used in this paper to localise the cis-SAGe SLC45A3-ELK4, link it to diseased areas, calculate differentially expressed genes and perform pathway annotation (Figures 2-4, S2 and S3).
Fusion transcript localisation using STfusion and C-scores
In spatial transcriptomics, the poly(A) tail of a transcript is captured and measured as a proxy for the expression level of a gene in a tissue sample on an almost single-cell level. However, for a gene that is abnormally transcribed, as it is the case for a fusion transcript, the amount of poly(A) tails provides shifted results. This deviation is measured.
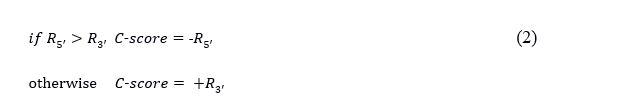
For each parental gene, the ratio (R) of the gene expression in each spot divided by the sample mean expression was calculated. To avoid divisions of 0, a pseudo-count of 1 was added to both dividend and divisor. The C-score of a spot is the maximum value of both ratios and presents the presence or absence of the fusion transcript. In the case of absence, the C-score level mirrors the 5´ gene expression. In the case of a fusion transcript, the C-score level mirrors the fusion transcript expression level.
See Formulas 1 and 2 in Supplementary Files.
The proposed poly(A) tail detection method, STfusion using C-scores, was applied to clinical tissue samples analysed with spatial transcriptomics. The level of the C-score mirrors an abnormally high amount of poly(A) tails on the 3´ gene ELK4 and predicts the cis-SAGe SLC45A3-ELK4 (Figures 2, 3 and S2).
The C-score distribution contained peaks between 0.35 and 0.8 (Figure S4) caused by a parental gene expression of 0 in a spot and a parental gene mean expression in a sample below 1. To avoid a bias towards these low C-scores, the minimal detectable signal (MSD) threshold was set to the C-score frequency maximum. For spots with , the C-score was set to 0.
Differentially expressed genes and pathway annotation
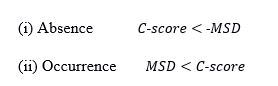
Spots with fusion transcript presence and absence were compared to investigate differentially expressed and co-expressed genes and activated pathways (Figures 4 and S3). Spots were only chosen according to their C-score, thus the likelihood and expression level of the cis-SAGe, and regardless of an annotation as stroma or epithelial.
To assign a spot to the group ‘occurrence’ or ‘absence’, C-score thresholds were applied:
See Formula 3 in Supplemental Files
The spatial transcriptomics data with read counts for the 5,053 protein-coding genes across the spots, was checked for quality. Spots with a log-library size smaller than three median absolute deviations below the median log-library size were removed. Low-abundance genes with a read count of zero or close to zero among the spots were removed. The resulting data set was normalised per tissue sample using the R package “scater” [21]. The optimal pool size was calculated with the R package “scran” [22]. Genes with a very low standard deviation (sd) for the normalised expression levels among the chosen spots (sd < 10% of the expression mean) were removed.
The fold change per gene was calculated as gene expression mean of spots with C-scores > MSD (occurrence) divided by gene expression mean of spots C-scores < -MSD (absence). Differentially expressed genes were calculated with a two-sample t-test (confidence level 0.95) [23]. P-values were corrected for multiple testing with the Benjamini-Hochberg procedure[24]. Significantly differentially expressed genes (false discovery rate [FDR], q-value < 0.1) were submitted to PathwAX [25] on the Kyoto Encyclopaedia of Genes and Genomes (KEGG) database [26].
Fusion transcript detection in bulk sequenced RNA from prostate cancer tissue samples
Bulk-sequenced mRNA from each of the 12 tissue sections were used to confirm the cis-SAGe SLC45A3-ELK4. The sequenced reads were aligned using two aligners to increase the possibility of identifying the cis-SAGe. The alignments of fastq reads were performed using Tophat2 (b2-sensitive and otherwise default parameters) [15] and STAR [16], both alignments against the human assembly GRCh38 Ensembl (release 84) [17]. Conversion from sam to bam format and indexing was done using Samtools [27].
Fusioncatcher [28] using Blat [29], Star and Bowtie2 [30] was applied to the aligned RNA-seq data to confirm the cis-SAGe. Additionally, the alignments were searched for encompassing reads, i.e., read pairs with each of the reads mapped to one of the parental genes, and for spanning reads that cover the fusion points identified with Fusioncatcher. The search was performed using Samtools (Tables S15 and S16).