Animals and drugs
Male Wistar rats, aged 8-10 weeks weighing 220-260 g (Japan SLC), were maintained at 22±2 °C under a 12-h light/dark cycle with free access to food and water. The clinical signs of rats were observed at least twice a day. If the criteria of humane endpoints were met, rats were sacrificed. Humane endpoints were considered as severe respiratory distress, poor physical appearance, seizure, vomiting or skin problems (wounds or signs of inflammation). The animal experiments were performed under a protocol approved by the Institutional Animal Care and Use Review Committee of the Kobe University of Medicine (approval number P170705) which complied with the ARRIVE guidelines. GGA (ab146190, Abcam) was dissolved in 100% dimethyl sulfoxide (DMSO) (D8418, Sigma) and stored at -20 °C.
Animal grouping and sample collection
For GC-MS analysis, the rats were randomly assigned to 6 groups by lottery method: the sham-operated group (control) and the cerebral ischemia-reperfusion injury model groups, which underwent 1-h MCAO followed by 0, 1, 3, 5, or 24-h of reperfusion (n=7 in each group; total n=42). Each rat was euthanized at the designated time point by the intraperitoneal administration of 100–150 mg/kg pentobarbital sodium (Somnopentyl, Kyoritsu Seiyaku Co.) and decapitated after transcardial perfusion with 150-200 mL of ice-cold saline. A total of 30 mg of the infarcted cortex was collected.
For the intracerebroventricular GGA injection study, the rats were randomly assigned to 4 groups by lottery method: the 1-h MCAO and 24-h reperfusion (MCAO-R) after intracerebroventricular GGA injection group (group G), the MCAO-R after intracerebroventricular injection of DMSO as vehicle group (group D), the sham MCAO-R after intracerebroventricular GGA injection group (group GS), and the sham MCAO-R after intracerebroventricular DMSO injection group (control group). Five rats were used for each group (total n=20). In addition, six additional rats from group G and D were used to measure the infarct size (total n=12). Power analysis (two-tailed) with an α of 0.05 and a β of 0.2 (power = 80%) revealed that 6 subjects per group were required to detect a 15% difference in infarct size between group D and group G (estimated standard deviation = 9%). The difference and standard deviation were estimated from the results of our previous study and preliminary study [6]. Age and sex as potential confounders were controlled through inclusion criteria. Decapitation and sample collection were performed in the same manner as above.
Surgical procedure for MCAO
The rats were anesthetized by the inhalation of 4% isoflurane and maintained with 1.5-2.0% isoflurane in O2 (0.4 L/min) and N2O (0.8 L/min) using a face mask. Regional cerebral blood flow (rCBF) was measured in the right temporal window by laser doppler flowmetry (TBF-LN1, Unique Medical, Inc.) during surgery. Focal cerebral ischemia was induced by the suture occlusion technique using 4-0 silicon coated nylon monofilament (Doccol Corporation) with some modifications [5,29]. Only rats in which the rCBF was reduced by more than 70% of the preischemic value during MCAO were included in subsequent analyses. Rats in which the rCBF was not rapidly restored after thread removal were also excluded from subsequent analyses. Rats with subarachnoid hemorrhage during brain extraction were also excluded.
Surgical procedure for intracerebroventricular injection
An intracerebroventricular injection of GGA or DMSO was administered 3 h prior to MCAO. We selected a 3 h pretreatment with GGA because our preliminary study demonstrated that phosphorylation of HSP27 was increased 3h after intracerebroventricular administration of GGA (data not shown). The rats were anesthetized and placed in a stereotaxic apparatus. A small hole was made in the skull 1.0 mm posterior to bregma and 1.8 mm lateral (left) to the midline to puncture the left lateral ventricle. A gas-tight microliter syringe (Hamilton, Reno) was carefully inserted at a depth of 4.5 mm from the skull surface. A total of 10 μL of GGA (0.33mg, 100 μmol/L) or 10 μL of DMSO was injected at a rate of 2 μL/min. The ventricular puncture was performed to the nonischemic (contralateral to MCAO) side because the puncture itself contributed to the stress-induced local increase of HSP27 (data not shown).
GC-MS
Low-molecular-weight metabolites were extracted from 30 mg of infarcted cortex, and GC-MS analysis of the infarcted cortex tissue was performed using a GCMS-QP2010 Ultra instrument (Shimadzu Co.) according to previous reports [5,6]. The MS data were exported in netCDF format. Peak detection and alignment were conducted using MetAlign software (Wageningen UR). The resultant data were analyzed using in-house analytical software (AIoutput) or semiquantitative assessment [30], the peak height of each quantified ion was calculated and normalized to the peak height of 2-isopropylmalic acid as an internal standard.
RT-PCR
Quantitative RT-PCR analysis of infarcted cortical tissue obtained from each group was performed. Complementary DNA (cDNA) was synthesized from 80 ng of total RNA using a Highcapacity cDNA reverse transcription kit (Thermo Fisher Scientific) according to the manufacturer’s instructions. Quantitative RT-PCR was conducted with 3 μL of diluted cDNA using TaqMan gene expression assays (Applied Biosystems) following the manufacturer’s instructions. β-actin RNA was used as an endogenous control. Quantitative mRNA expression data were acquired and analyzed via the ΔΔCt method. TaqMan gene expression assays with FAM-MGB dye were conducted for the following genes in this study: G6PD (Rn01529640_g1), HSP27 (Rn00583001_g1), and β-actin (Rn00667869_m1). The experiments were repeated two times (each with 2 technical replicates per group).
Immunoblotting analysis
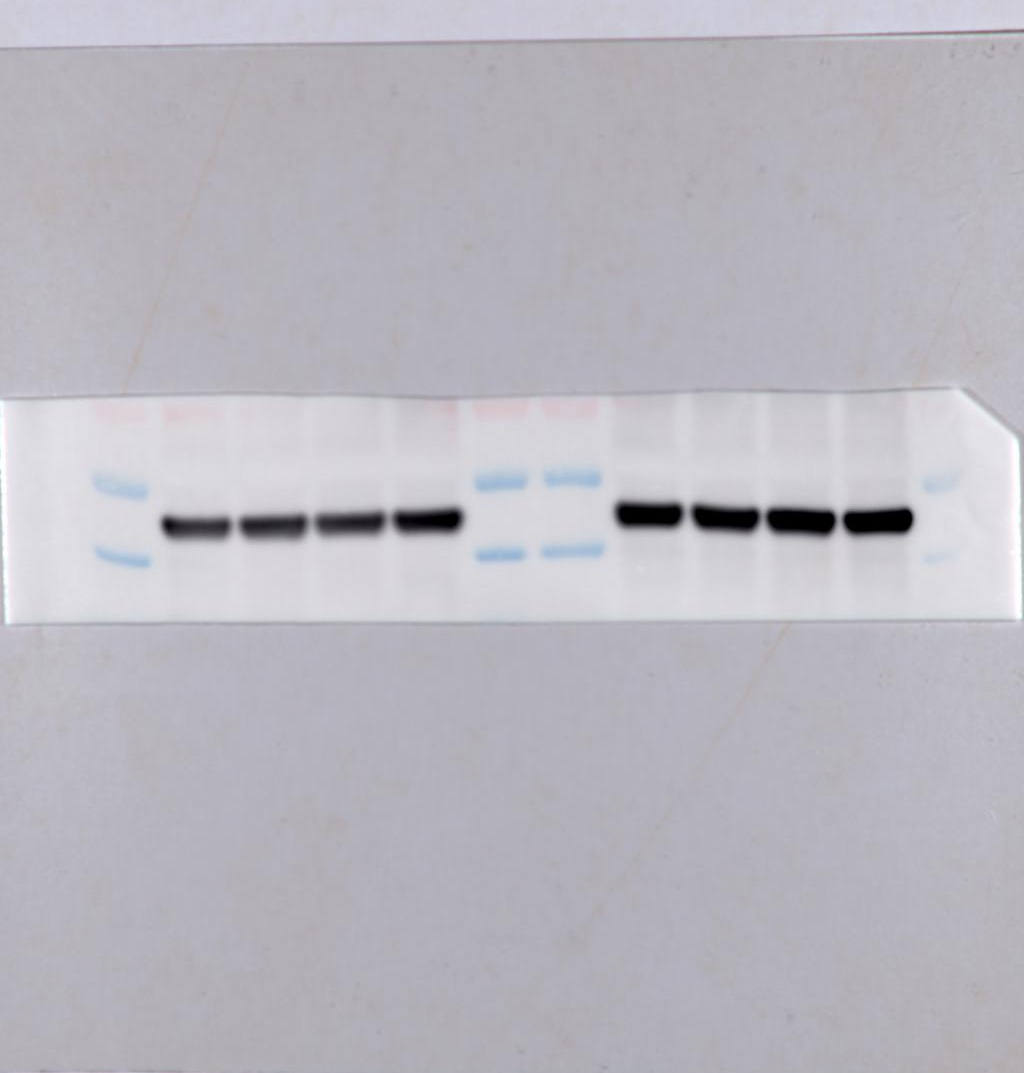
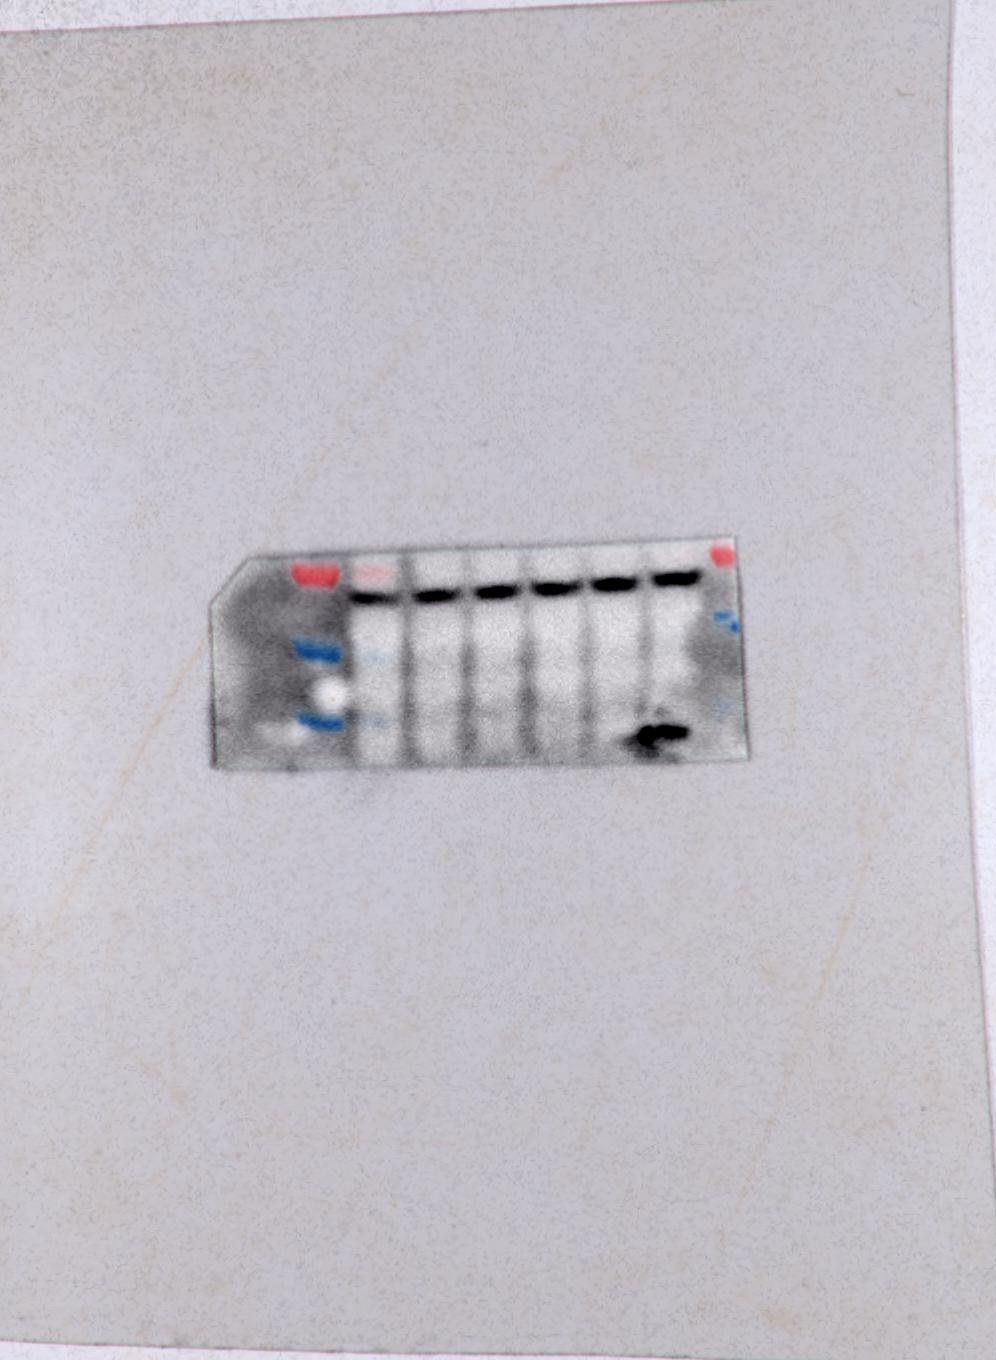
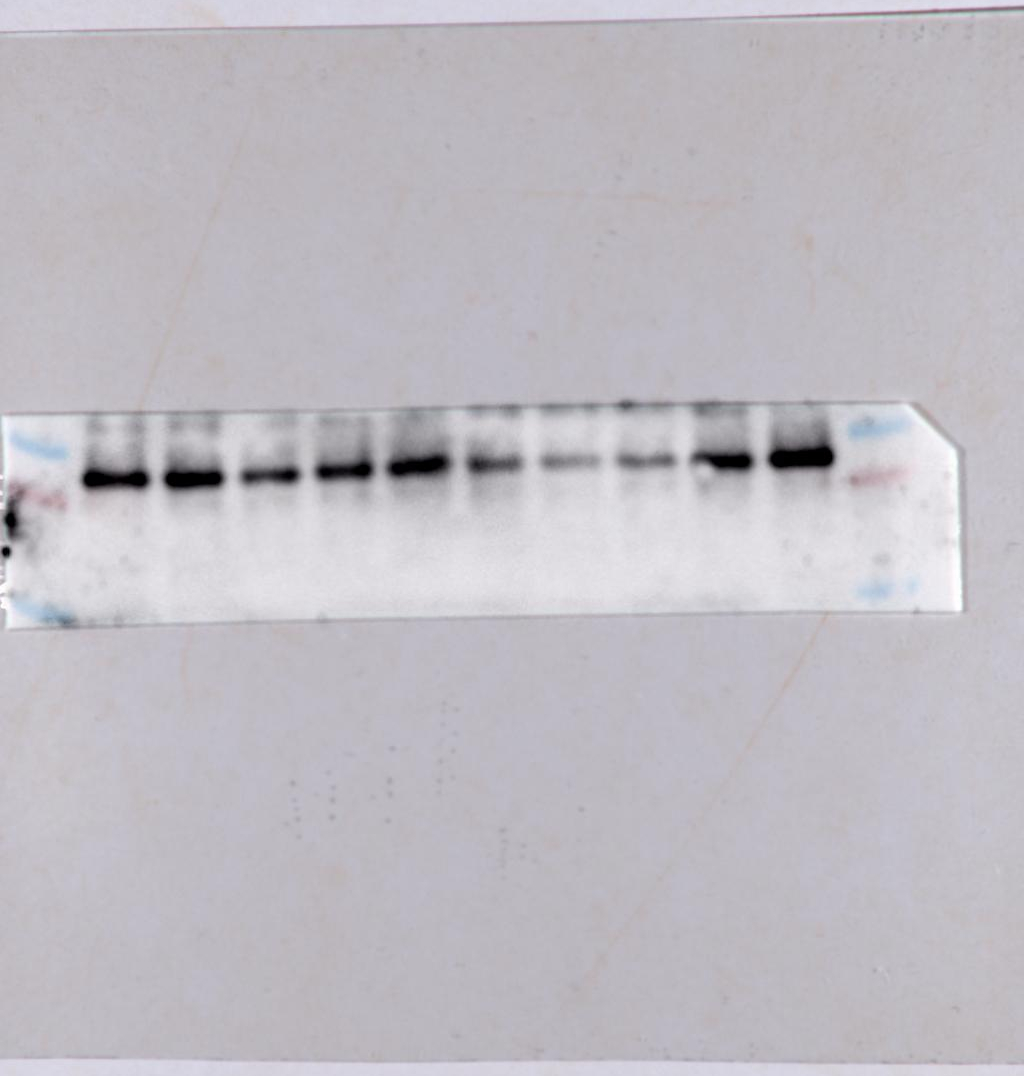
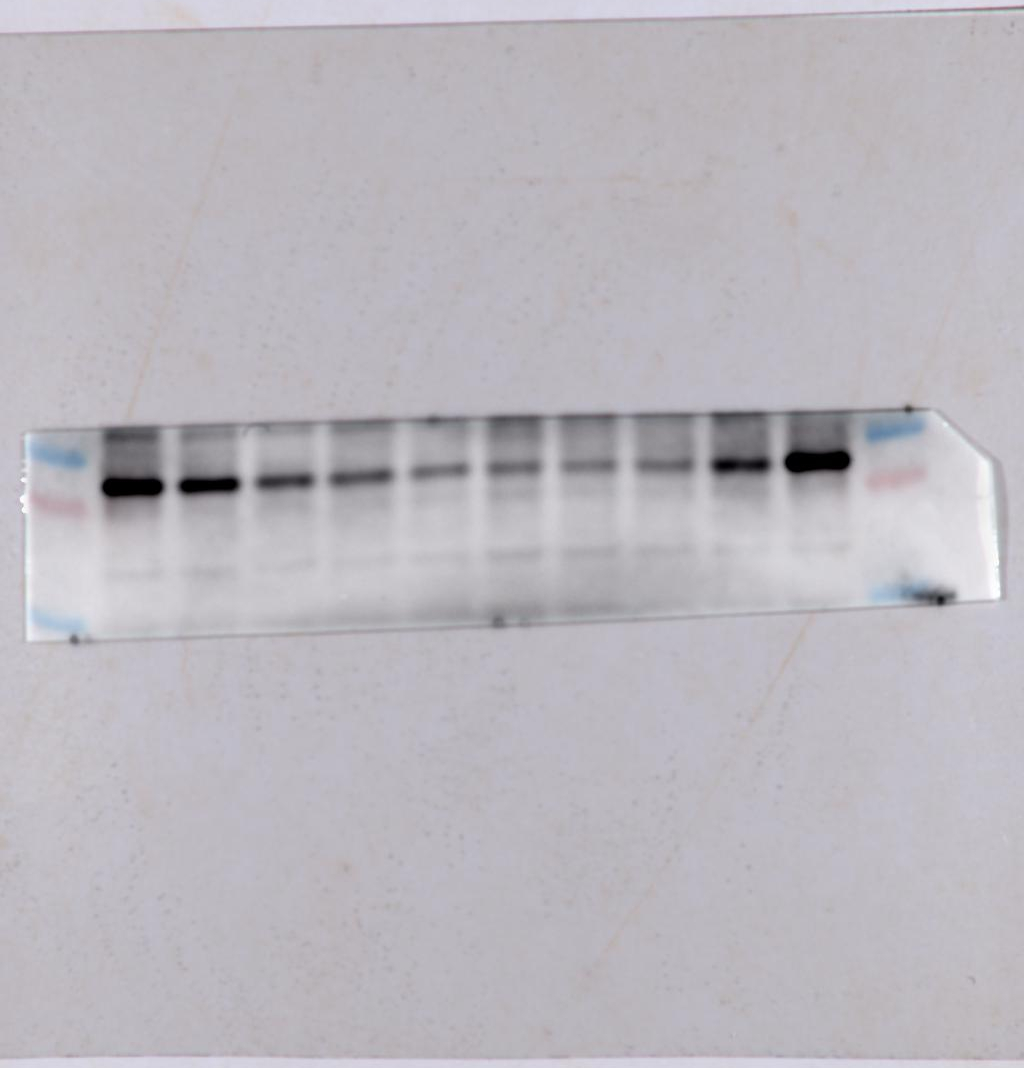
The protein levels of HSP27, pHSP27, and G6PD in infarcted cortical tissue from each group were determined by immunoblotting according to a previously described method [6]. Five percent bovine serum albumin (BSA, Nacalai Tesque) was used for blocking, and primary antibodies were diluted in Can Get Signal (TOYOBO) at 4 °C overnight. The following antibodies were used: rabbit polyclonal antibodies against G6PD (1:1000, #8866, Cell Signaling Technologies), HSP27 (1:1000, #2442, Cell Signaling Technologies), and pHSP27 (S85) (1:4000, ab5594, Abcam) and a mouse monoclonal antibody against β-actin (1:4000, AM4302, Thermo Fisher Scientific). The blots were quantified using densitometric analysis performed with NIH ImageJ software (ver. 1.51, https://imagej.nih.gov/ij/). β-actin was used as a loading control. The experiments were repeated two times.
G6PD activity
G6PD activity in infarcted cortical tissue obtained from each group was determined by measuring the rate of production of reduced nicotinamide adenine dinucleotide (NADH) at 450 nm using a Glucose 6 phosphate dehydrogenase assay kit (ab102529, Abcam) according to the manufacturer's instructions with slight modification [6]. The protein concentration was determined for each sample, and enzyme activity was calculated using a reduced NADH standard curve and are expressed as nmol/min/mg protein. The experiments were repeated three times (each with 2 technical replicates per group)
Protein carbonyl measurement
Protein carbonylation is an indicator of severe oxidative damage and often leads to the loss of protein function [31]. Protein carbonyl levels in infarcted cortical tissue from each group were measured by using an OxiSelect protein carbonyl ELISA kit (Cell Biolabs) according to the manufacturer’s protocol [6]. The protein concentration was determined for each sample; the level of carbonylated protein was calculated based on a standard curve consisting of a mixture of oxidized and reduced BSA and are expressed as nmol/mg. The experiments were repeated two times (each with 2 technical replicates per group)
Determination of Infarct volume
The infarct volume was measured for group G and D. The rats were euthanized after 24-h reperfusion following 1-h MCAO. The brains were removed after transcardial perfusion and decapitation, and 7 consecutive coronal brain slices (2 mm) from the forebrain were stained with 1% 2, 3, 5-Triphenyltetrazolium chloride (TTC, Sigma) in phosphate buffered saline at 37 °C for 30 min in the dark. Each slice was photographed by a digital camera (GR Digital IV, Ricoh). The infarct area and the ipsilateral hemispheric area were measured directly by the modified autothreshold method using NIH ImageJ software by an observer who was blinded to the treatment [32]. The infarct volume was calculated by multiplying the sum of the areas by the slice thickness (2 mm), and the infarct percentage was calculated as follows: ipsilateral infarct volume/ipsilateral hemisphere volume × 100%.
Statistical analysis
All statistical analyses were performed with R software version 3.6.1 (https://www.r-project.org). The statistical significance of differences between two groups was determined using the two-sided Mann-Whitney U test. The statistical significance of differences among more than two groups was determined using the Steel-Dwass test. The statistical significance of differences between each experimental mean and the control mean was determined using the nonparametric Dunnett’s test and the Tukey-Kramer test in the nparcomp package in R. Non-parametric statistical tests were used because our data did not follow a normal distribution. A probability (P) value <0.05 was considered statistically significant.
Pathway Activity Profiling analysis
Comparative metabolite changes were determined using PAPi analysis, using an R package [33]. The analysis of the correlation between metabolite level and metabolic pathway activity is still considered a complex task to achieve. When relating metabolite level to pathway activity, there are only few tools available and most of them need extensive data pre-processing and demand great knowledge about cellular metabolisms [33]. A new algorithm PAPi that use the metabolite profile and KEGG database, could compare the activity of metabolic pathways between different experimental conditions. The PAPi algorithm was utilized to calculate the activity score for each metabolic pathway. The calculation of activity score is based on the number of metabolites identified from each pathway and their relative abundances, engaging the function buildDatabase to build new local databases which makes use of the information available at KEGG [33]. The local database consists on two CSV files containing the required data about metabolites (Supplemental table 2[COMPbase]) and metabolic pathways (Supplemental table 3[PATHbase]). The COMPbase.csv consists of 3 columns, which are names of metabolites, KEGG compound codes and KEGG pathway codes. The PATHbase.csv also consists of three columns, which are names of metabolic pathways, KEGG pathway codes and number of metabolites.
As a result, the activity score represents the likelihood that a metabolic pathway is active inside the cell. Accordingly, it allows the comparison of metabolic pathway activities by use of PAPi functions of performing a t-test or analysis of variance on the activity scores for calculation of p-value. Additionally, PAPi has the function to generate graphical summaries of the results. Before constructing the graph, scaling is performed by setting the activity score of one of the conditions to 0, and by referring to this as the reference condition. Then PAPi scales the activity score of the other target condition relative to the reference condition. This time, only the metabolic pathways with p <0.05 in analysis of variance test among six different groups, were extracted and shown.