Volunteers’ information and ethical statement
Samples were collected from women volunteers and the procedure adopted was approved by the Institutional Ethical Committee (DM/2014/101/38), Bharathidasan University. The saliva samples were collected between 8.00 to 9.00 AM from 30 healthy female volunteers (age, mean = 24, range = 19 - 30), with prior written consent [16]. The volunteers were instructed to abstain from smoking and drinking and not to consume food for 10 h before the sample collection. The volunteers were also asked to brush the teeth before collection of saliva so as to prevent microbial contamination.
Sample collection and process
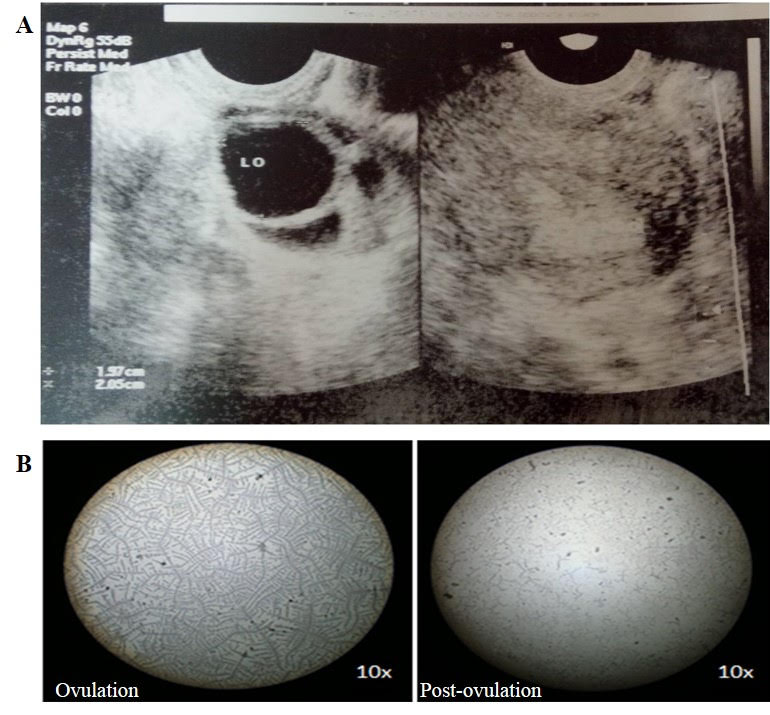
The saliva was collected by spitting into a sterile vial, which was immediately kept in an ice box and brought to the laboratory. The duration of collection of saliva was about 10 min and the saliva secretion over the first minute was discarded. The samples were centrifuged at 16000 x g for 15 min to remove insoluble materials and cells, if any. The samples were stored at –80˚C until further use. The saliva samples were assigned among three phases, viz., preovulatory (days 6 to 12), ovulatory (days 13 and 14) and postovulatory (days 15 to 26) phases according to the pattern of salivary hormones and fern pattern analysis, as was done in our previous study[16].
Protein precipitation and estimation
The salivary proteins were precipitated by trichloroacetic acid (TCA)-acetone precipitation method [17]. The samples were mixed with TCA:acetone (TCA–20% W/V; Acetone–90% V/V) in 1:1 ratio and 20 mMdithiothreitol (DTT) and incubated overnight at –20 °C. After incubation, the samples were centrifuged at 5000 x g at 4 °C for 30 min. The pellets were washed twice with cold acetone and centrifuged at 5000 x g at 4 °C for 30 min. Finally, the pellets were air-dried and re-suspended in UTC (6M Urea, 3M Thiourea, 8% CHAPS) buffer. The protein concentration was determined adopting modified protocol of Bradford (1976) [18].
1D—Gel electrophoresis
The protein concentration in saliva differed slightly between ovulation and post-ovulation phases. The total proteome was fractionated by 12% SDS-PAGE (Figure 1A). The protein profile of ovulatory phase saliva was compared to that of postovulatory phase. Put together, during the two phases, a total of 12 distinct protein bands appeared in the Coomassie Brilliant blue-stained gels, and their molecular mass ranged from 14 to 97 kDa. Further, the protein pattern was verified in the gradient gel (Figure 1B) also and it was found to be similar to that revealed in SDS-PAGE. Among the various bands 66, 43, and 14.5 kDa were in the highest intensity during the ovulation phase compared to postovulatory phase.
Iso-electric focusing
Protein samples were mixed with an equal volume of UTC buffer (6M Urea, 3M Thiourea, 8% CHAPS, 100 mM DTT, and 2% IPG buffer (GE, Amersham), and incubated for 30 min in ice. The content was then diluted to the required volume using rehydration buffer (7M Urea, 2M Thiourea, 4% CHAPS, 0.5% ampholytes, 50 mM DTT, 1% IPG buffer (GE, Amersham), and 0.004% Bromophenol blue. De-streak TM reagent (GE Healthcare) was used for better resolution. The strips were then focused in IPGphor III after 16 hr of passive rehydration. The programme used for focusing 11 cm (3–10 pH) IPG strips was as follows: 200 V–3 hrs (Step and Hold); 500 V–2 hrs (Step and Hold); 2000 V–1 hr (Gradient); 4000 V- 2 hrs (Gradient); 6000 V—2 hrs (Gradient); 8000 V—6 hrs (Step and Hold). The total of 8000 V was applied in 66842 V (16 hr). The focused strips were stored at –80 ºC until further analysis.
2D—Electrophoresis
The frozen strips were brought to room temperature and subjected to reduction and alkylation. The strips were incubated in SDS-Equilibration buffer I (6 M Urea, 50 mMTris-Cl, 30% Glycerol, 2% SDS, 0.004% Bromophenol blue, and 1% DTT) for 15 min in a gel rocker. For alkylation, the strips were incubated in SDS-Equilibration buffer II (6 M urea, 50 mMTris-Cl, 30% Glycerol, 2% SDS, 0.004% Bromophenol blue, and 2.5% Iodoacetamide) for 15 min in a gel rocker. The strips were then placed on top of 12% polyacrylamide gel (14 cm x 14 cm x 1 mm) and sealed with an overlay of 0.5% agarose solution. In the electrophoresis apparatus, the upper tank contained 2x Tris-Glycine buffer (0.6 % Tris, 2.88% Glycine, and 0.2 % SDS) and the lower tank was filled with 1x buffer. The electrophoresis conditions were 0.5 W for 45 min and 2 W for 5 to 6 hrs until the tracking dye reached the bottom of the gel plate.
Colloidal Coomassie blue staining
After electrophoresis the gels were rinsed with distilled water and fixed with fixative solution (10% Acetic acid, 40% Ethanol, and 50% Distilled water), following which gels were stained with colloidal Coomassie blue stain (0.02% CBB G–250, 5% Ammonium sulfate, 10% Ethanol, and 2% Orthophosphoric acid) solution according to Dyballa and Metzger (2009)[20].
Gel analysis
Digital images of 2D-gels were acquired using ChemiDoc™ XRS imaging system (Bio-Rad) with internal calibration. The acquisition parameters were 300 dpi and epi white illumination. Gel analysis was performed by adopting PDQuest software (Bio-Rad) for spot detection, according to manufacturer’s protocol. Spot volume normalization, in the various 2-DE maps, was carried out using the relative spot volumes (% Vol). Initially, automatic spot detection was performed, followed by manual editing for spot splitting and noise removal.The gels containing the largest number of protein spots for each phase were chosen as the reference gels. All other gels were matched with the reference gel by placing user landmarks on approximately 10% of major and minor protein spots, which were visualized to assist in automatic matching. Finally, all matches were checked for errors editied by manually.
HR-LC-MS/MS
The 1D protein spots were analyzed using 6550 i-Funnel QTOF-LC-MS/MS coupled with 1260 Infinity Nano pump and 1260 Cap pump along with 1260 Chip-cube (Agilent Technologies). The peptides were fractionated along with Solvent A (0.1% formic acid in milliQ water) and Solvent B (90% acetonitrile + 0.1% formic acid + 10% milliQ water). For MS measurements, we employed the positive-ion mode with mass range of up to m/z 4000 with the resolution setting 60,000 at m/z 400. The proteins were identified by comparison with the SWISS-PROT database entries. Search parameters for MS data were, species: Homo sapiens; Protein Mass: 0–500 kDa; Protein pI: 3–10; Enzyme: trypsin; Miscleavage: 1; Mass type: monoisotopic; Charge state: MH+; precursor and product mass tolerance +/–50 and +/–100ppm, respectively; Fixed modification: carbamidomethylation of Cystine (C); Variable modifications: oxidation of methionine (M). All the mass spectrometry data have been deposited in the ProteomeXchangeConsortium [21] PRIDE (http://proteomecentral.proteomexchange.org) partner repository with the dataset identifier PXD004511. The protein dataset of ovulation (Supplementary file. S1) and the post-ovulation (Supplementary file. S2) was obtained and listed.
MALD TOF/TOF analysis
2D protein spots were processed using an automated gel cutter and processor (Shimadzu, Xcise™). The gel spots were washed and destained with 50% ACN and 50 mM NH4HCO3 (Solvent 1), and subjected to in-gel digestion with 30 μL of solvent 7 (50 μl of trypsin stock solution in 4 ml of 50 mM of NH4HCO3) for 2 hr at 37 ºC. ZipTips (C18) were wetted and conditioned with 50% ACN and 0.05% TFA (Solvent 5) and 0.1% TFA (Solvent 3), respectively. Cleaved peptides bound to the C–18 resin were desalted using 0.1% TFA (Solvent 3). The peptides were then eluted and spotted with 2.5 μL of Solvent 4 (5mg/ml of CHCA in 50% ACN and 5mM of NH4CHO3) onto a 384-well MALDI plate. Finally, samples were identified using MALDI TOF/TOF (AB Sciex 4800).
Data processing
The acquired mass spectra were processed using DataExplorer® software, and the mono-isotopic peptide masses were assigned and used in the database search. The protein identification was analyzed against Homo sapiens protein sequence inMASCOT database search (http//www.matrixscience.com) using SWISS-PROT database entries. Modification of cysteine by carbamidomethylation and methionine by oxidation was allowed. The precursor and product mass tolerance were set as +/–50 and +/–100 ppm, respectively. Two or more unique peptides for each protein were taken for confirmation of the protein present in the sample.
Functional annotation
The salivary proteins identified during the ovulation and post-ovulation phases were subjected to functional annotation using STRAP online database. The GO terms of proteins were classified based on the biological processes in which they participate, the cellular location and the molecular function. The results revealed that the ovulation phase had more number of GO terms and greater percentage of annotations than during the post-ovulation phase.
Molecular functional ontology
The GO entries were used to depict the percentage of proteins at molecular functional level through Interproscan analysis in BLAST2GO. The cloud tag image confirmed that the proteins identified in saliva of ovulation phase are essentially those with binding property and catalytic activity. Particularly, among the ovulation phase salivary proteins (Figure 2A) showed up higher number of binding proteins (41.6%) and metal ion binding proteins (16.1%) compared to other phases (Figure 2B). Further, the molecular functional network was constructed using GO terms of salivary proteins. The integrated network map revealed the proteins identifiedduring ovulation phase to have glycoprotein binding, ion binding, and immunoglobulin binding properties, also with receptor activity. Additionally, the molecular network analysis revealed the interaction between the identified proteins.
Statistical analysis
The protein concentration and band intensity values corresponding to ovulation, preovulation and post-ovulation phases were represented as mean ± SD and analyzed using one-way analysis of variance (ANOVA) using SPSS 16 software (SPSS Inc., Cary, NC, USA).